

If you want to invest in or buy PLTR and wonder what the right price to start accumulating PLTR is, then you are in the right place. As we go through the analysis, we will determine different patterns and how PLTR reacts to them. We will also see support and resistance, which is a good area for any instrument to buy or sell. Without any further delay, let’s dive into the Palantir price analysis and explore different opportunities arising from it.
Palantir (PLTR) Price Analysis of May 5, 2025
The Palantir price opened at $118.68, gapping up from the previous close and the day’s low of $116. The initial move formed an upward-moving channel that broke to the downside at 14:40 UTC, confirmed by a MACD Death Cross. However, the Palantir breakout lacked conviction and quickly reversed, forming another ascending channel. Price then entered a consolidation phase, moving sideways in a tight range between support at $123 and resistance at $123.70. At 18:35 UTC, a breakout above this range occurred, supported by a MACD Golden Cross, pushing the price to an intraday high of $124.40 before momentum stalled.

Chart 1: PLTR M5 Chart, Analysed by vallijat007, published on TradingView, May 5, 2025
Palantir Technologies opened the day at $118.68, which was above the previous close and the day’s low of $116, signaling a gap-up opening. The first candlestick spiked to the upside and formed an upward-moving channel. This channel broke to the downside at 14:40 UTC, supported by a Death Cross on the MACD. However, the Palantir breakout failed to follow through, and the price quickly rebounded, forming another upward-moving channel. This pattern led to a period of sideways movement, with price action consolidating into a narrow range. Support was established at $123, while resistance held firm at $123.70.
PLTR’s Critical Juncture: Can It Hold Gains or Will Profit-Taking Hit?
The Palantir price escaped the narrow range when a MACD Gold Cross signal occurred during UTC 18:35. Price surged out of the range with optimistic indications, but the market displayed weak momentum following its peak at $124.40. The buying interest remained steady throughout the day, which drove Palantir stock to close at $124.25 per share. Throughout the period, the price moved in an upward pattern but failed to demonstrate consistent breakouts and maintain support.
Future price movements for Palantir stock indicate potential upward expansion to $130 in case the current $124.40 high point gets broken by sustained high trading volume. There exists support at the $120 area for PLTR if the current consolidation range breaks down due to renewed selling pressure. The strength of approaching price movements can be assessed by traders through MACD and RSI verification signals. The momentum indicators show a bullish trend, but insufficient direction stability warns traders to stay cautious.
PLTR Tests Key Resistance: Will $124.40 Break or Reject?
The Palantir price closed the day at $124.25, solidifying a bullish bias but lacking follow-through above the intraday high of $124.40. If the price breaks above that level with volume and strong momentum, a rally toward $130 is possible. However, if consolidation breaks to the downside, price could retrace toward the $120 support zone. Momentum indicators like MACD and RSI show signs of strength but not decisiveness. With weak follow-through on breakouts, traders should look for confirmation before entering new positions. The stock appears poised for a larger move, but for now, the range remains intact, and direction is uncertain.
Palantir (PLTR) Price Analysis of May 29, 2025
Palantir stock opened higher, signaling early bullish intent with a gap-up, but momentum quickly faded. The price climbed to the session high before retracing to fill the gap and mark a low. From there, price action turned choppy. Multiple technical patterns emerged, including channels, ranges, and triangles, most of which broke out but failed to follow through. A death crossover quickly countered each golden crossover of the MACD, and RSI twice dropped below 30, flagging oversold conditions and potential reversals that ultimately lacked conviction. The Palantir price remained stuck in a repetitive cycle of brief rallies and sharp pullbacks.
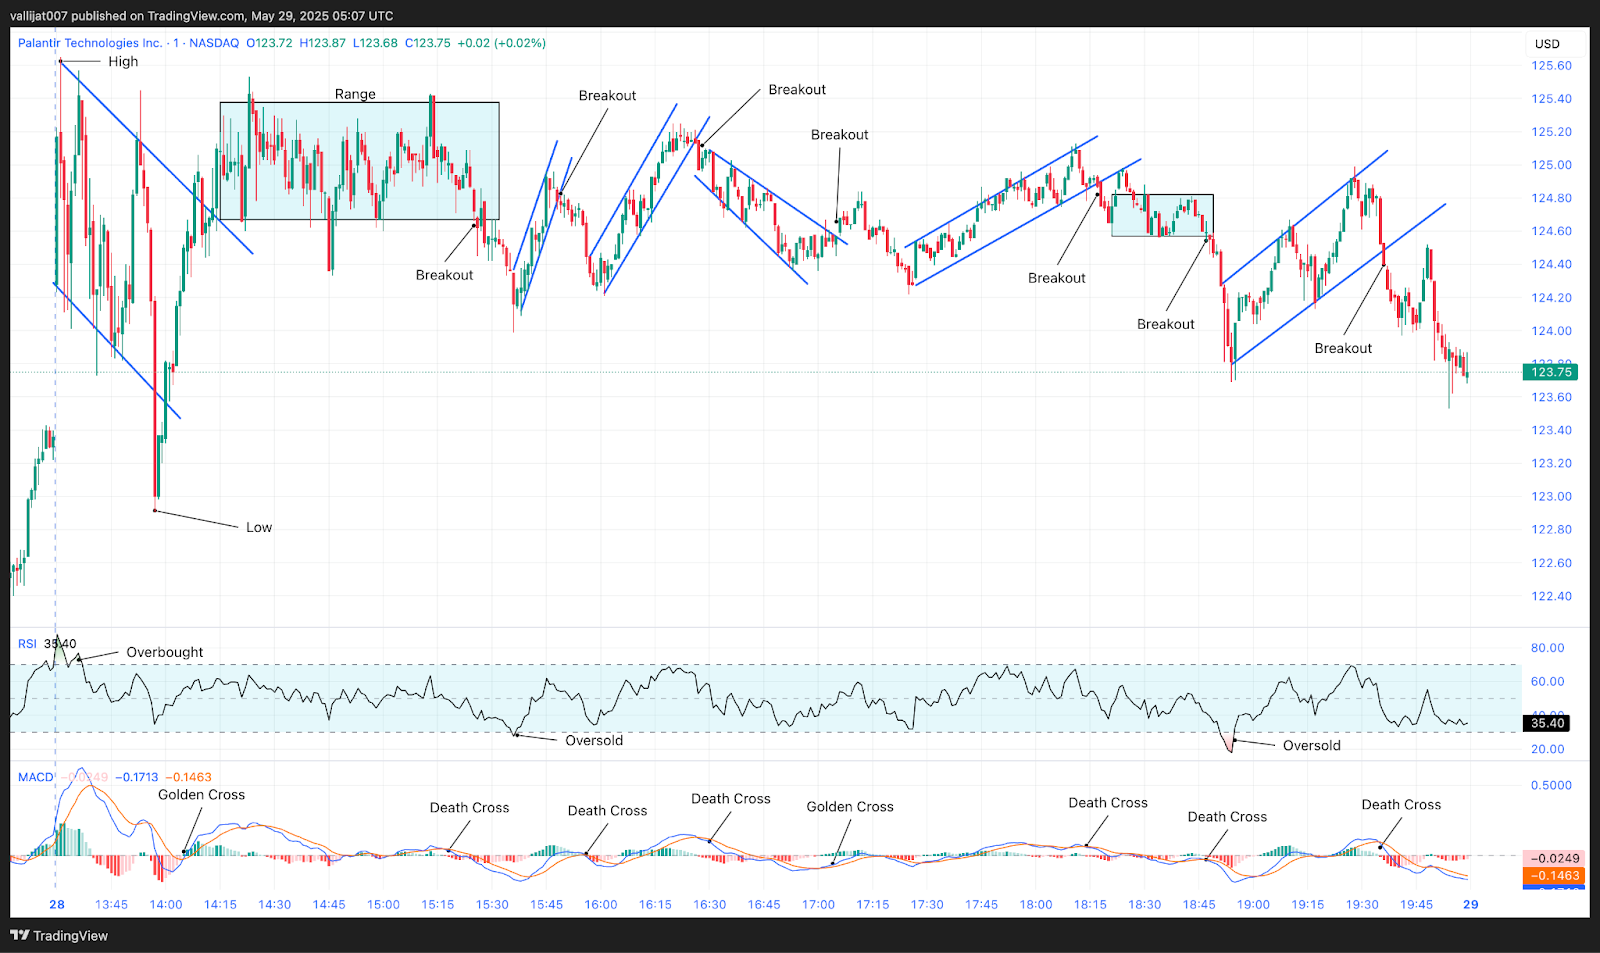
Chart 2: PLTR M1 Chart, Analysed by vallijat007, published on TradingView, May 29, 2025
The Palantir price opened at $124.28, which was above its previous closing price, indicating a gap-up opening. After the open, the price moved higher, marking the high for the day at $125.65, but then dropped to the downside, filling the gap and marking the low of the day at $122.91. Palantir price formed a downward-moving channel, which broke out to the upside at 14:14 UTC, supported by a golden crossover of MACD, but the Palantir breakout failed to generate momentum, and a range developed. The range broke out to the downside at 15:26 UTC, supported by a death crossover of MACD, but the move failed to sustain further downside momentum.
Rangebound Struggle at $123.75 Close
In the meantime, at 15:36 UTC, RSI dropped below 30, indicating oversold market conditions, suggesting a potential reversal or at least a pullback. An upward-moving channel appeared, which broke to the downside at 15:48 UTC, supported by a death crossover of MACD, followed by a second upward-moving channel that again broke to the downside at 16:27 UTC, also supported by a death crossover of MACD. This move led to the formation of an expanding triangle pattern.
The expanding triangle pattern broke out to the upside at 17:06 UTC, supported by a golden crossover of MACD, but the Palantir breakout failed to sustain. The Palantir price dropped again and formed another upward-moving channel, which broke to the downside at 18:18 UTC, supported by a death crossover of MACD, leading to the formation of a range. This range broke to the downside at 18:48 UTC, supported by another death crossover of MACD, followed by the appearance of another upward-moving channel. In the meantime, at 18:55 UTC, RSI dropped below 30, again indicating oversold market conditions and suggesting a potential reversal or pullback.
The upward-moving channel eventually broke to the downside at 19:36 UTC, supported by a death crossover of MACD, and Palantir stock closed at $123.75. The price action showed extreme trading range behavior, where most breakout attempts failed to sustain a trend and reversed direction. Traders should approach this type of market structure cautiously, especially when momentum is weak and signals are inconsistent.
Expect More Consolidation Unless Momentum Returns
The Palantir stock was defined by failed breakouts and weak momentum, a hallmark of indecisive market behavior. Despite multiple bullish and bearish signals from MACD and RSI, the price repeatedly reversed, showing no clear directional bias. Since momentum indicators are not matching and follow-up is lacking, the market is currently in a short-term consolidation mode. It is better for traders to confirm a breakout before making directional trades. If the Palantir price does not break away from its current structure, with strong volume and trend, it will likely keep moving sideways.
Palantir (PLTR) Price Analysis of June 17, 2025
Palantir stock opened at $140.03, gapping up above the previous close. After a brief dip to mark the daily low at $139.82, the price moved upward, forming a converging triangle pattern. The triangle broke out to the downside after reaching the session high of $144.86. Multiple shifts between channels and ranges followed, reflecting indecision. RSI fluctuations between overbought and oversold levels, combined with recurring MACD crossovers, defined a volatile session. Palantir stock ultimately closed at $141.34, near the mid-range of the day’s high and low.
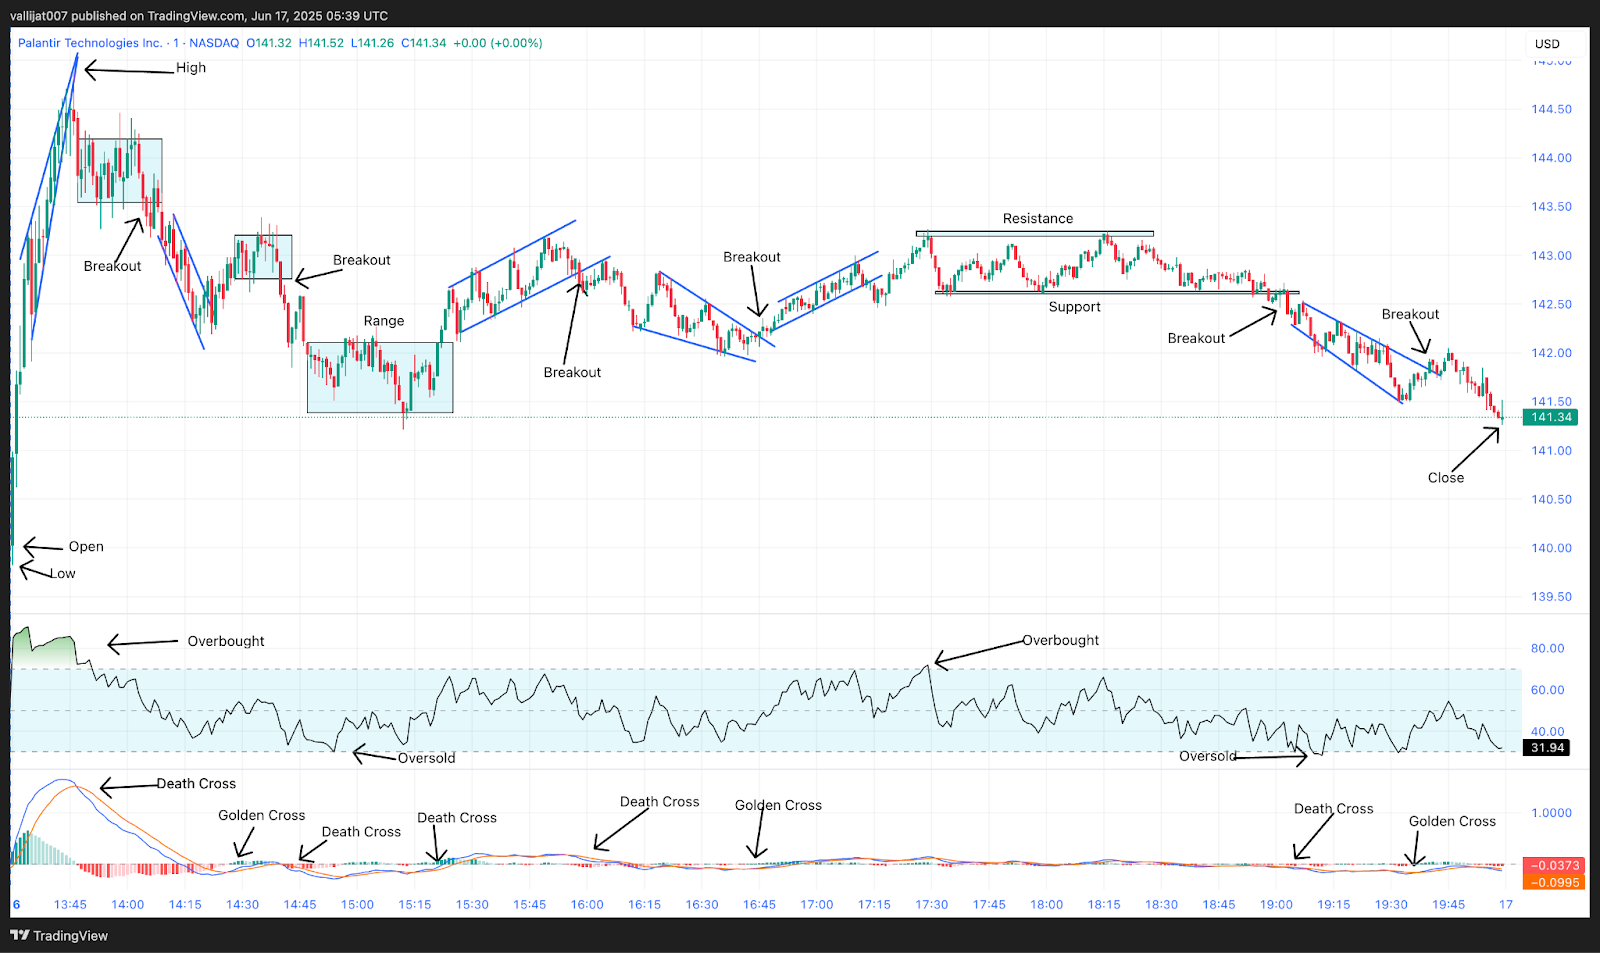
Chart 3: PLTR M1 Chart, Analysed by vallijat007, published on TradingView, June 17, 2025
The Palantir price opened at $140.03, which is above its previous close. After a gap-up opening, the price marked its low for the day at $139.82 and rose to the upside, forming a converging triangle pattern. The converging triangle pattern marked the high for the day at $144.86. The pattern broke out to the downside at 13:46 UTC, supported by a death crossover of MACD, and formed a range. The range broke out to the downside at 14:05 UTC, supported by a death crossover of MACD, and formed a downward-moving channel.
Consecutive Range Breakdowns Between 14:40-15:22 UTC
The downward-moving channel broke out to the upside at 14:23 UTC, supported by a golden crossover of MACD, and formed another range. Supported by MACD’s death crossover, the range broke to the bottom at 14:40 UTC and created yet another range. RSI fell below the 30 mark at 14:54 UTC, pointing to oversold market circumstances and possibly a reversal or at least a pullback. Supported by a golden crossover of MACD, the range broke out to the upside at 15:22 UTC, forming an upward-moving channel.
Session Concludes at $141.34 After Failed Upside Breakout
The channel broke out to the downside at 15:58 UTC, supported by a death crossover of MACD, and formed a converging triangle pattern. The converging triangle pattern broke out to the upside at 16:46 UTC, supported by a golden crossover of MACD, and formed another upward-moving channel. The channel attempted to break to the downside at 17:15 UTC, supported by a death crossover of MACD, but the downside Palantir breakout failed and price rose, forming a resistance area at $143.20 and a support area at $142.60.
The price broke the support area to the downside at 18:58 UTC, supported by a death crossover of MACD, and formed a downward-moving expanding triangle pattern. At 19:12 UTC, RSI dropped below the level of 30, indicating oversold market conditions. The expanding triangle pattern broke out to the upside at 19:40 UTC, supported by a golden crossover of MACD, but upside momentum was weak, and Palantir price dropped to the downside, closing at $141.34.
$144.86 High Rejected as Palantir Closes Weak at $141.34
Despite hitting a session high of $144.86, the Palantir price failed to hold gains as bearish momentum intensified late in the session. The price action featured frequent death crossovers of MACD and repeated RSI dips below 30, clear signs of market stress. While several upward Palantir breakouts occurred, they lacked follow-through, indicating weak buyer conviction. The close at $141.34, near the lower third of the day’s range, points to exhaustion. Unless Palantir stock reclaims and holds above $143.20, the current trend suggests further downside toward the $140.00 support zone. Traders should approach near-term rallies with caution.


