

Are you watching Pudgy Penguins native token, ‘PENGU’, and wondering whether now’s the right time to jump in or wait? This PENGU price analysis brings you up to speed on recent price moves and key technical setups. Whether you aim to ride the next PENGU breakout or justgauge short-term momentum, we break it all down using actual chart patterns and indicators like RSI and MACD. Follow along as we unpack the action and give you a clearer view of where PENGU might head next.
PENGU Price Analysis of May 5th, 2025
The PENGU price action over the last 24 hours shows a strong upward breakout early in the session. Price climbed from around $0.0097, forming a sharp uptrend by 10:30 UTC. The momentum pushed it as high as $0.0111 by 14:30 UTC, following a classic uptrend channel pattern. RSI during this phase briefly entered the overbought region around 11:30–12:30 UTC, while MACD showed a golden cross and rising histogram bars, indicating strong bullish momentum. However, after tapping the $0.0111 region, buying pressure faded and the trend began to slow, stalling at a narrow resistance zone.

Chart 1- PENGU/USDT M5 Chart, Analyzed by Alokkp0608, published on May 5th, 2025.
From 14:30 UTC to around 20:35 UTC, Pudgy Penguins token activity entered a sideways path ranging between $0.0110 and $0.0104. During this consolidation, the RSI hovered mostly in the neutral zone but touched overbought near 16:00 UTC, then cooled. MACD began flattening, showing reduced momentum and a potential reversal buildup. The sideways behavior hinted at indecision, with neither bulls nor bears clearly in control. This range persisted despite a few volatile spikes, showing price compression that ultimately resolved to the downside. The inability to retest or break above $0.0111 reinforced its role as a firm resistance level.
Bearish Shift and Support Retest
Starting around 20:35 UTC, PENGU price entered a descending channel, dropping sharply and testing lower support levels. The decline accelerated post 00:00 UTC, eventually reaching the $0.0100 mark by 02:05 UTC, an important psychological and structural support. RSI readings during this fall twice dipped into oversold territory, especially between 00:00 and 02:00 UTC, showing bearish exhaustion. MACD confirmed the downtrend with a death cross at 21:00 UTC and widening negative histogram bars. This segment marked the most bearish stretch of the day, yet the prompt bounce from $0.0100 hinted at strong demand sitting at that level.
Following the bounce from $0.0100, PENGU reversed back into an upward channel, gaining strength and reclaiming levels near $0.0110 by 08:00 UTC. This uptrend was supported by a MACD golden cross at 03:30 UTC and an RSI climb that approached overbought near 07:00 UTC. The price continued pushing toward the previous resistance near $0.0112, showing impressive recovery momentum. However, bullish control started to fade near 08:00 UTC. RSI touched overbought again, suggesting temporary overheating, while MACD histogram peaks began contracting, pointing to weakening follow-through strength.
Rising Weakness Near Key Resistance
The most recent price action shows Pudgy Penguins token losing strength just below the resistance level at $0.0112 after peaking near 08:00 UTC. By 09:00 UTC, the price had pulled back to $0.01082 with a clear rejection above the $0.0111 area. RSI dropped quickly from overbought to the midline, reflecting fading bullish momentum. Meanwhile, MACD showed a fresh death cross, signaling the possible start of a new downtrend or at least a broader consolidation. The inability to sustain gains above $0.0111, coupled with weakening indicators, sets the stage for a possible pullback unless renewed volume enters soon.
Outlook: Bulls Need Strong Momentum Above $0.0112
PENGU’s 24-hour trend shows multiple directional shifts: early bullish PENGU breakout, mid-session consolidation, a firm downtrend, and a resilient recovery. The PENGU price is currently facing rejection just under the $0.0112 resistance. If bulls manage a clean break above $0.0112 with strong volume, the next upside targets lie near $0.0115 and $0.0118. However, failure to hold above $0.0108 could lead to a retest of $0.0104 or even the key support at $0.0100. MACD’s recent death cross and RSI’s drop from overbought suggest weakening momentum, so the next few candles are crucial. The trend favors cautious optimism, with clear breakout confirmation needed.
PENGU Price Analysis of May 9th, 2025
The PENGU price action over the last 24 hours shows an initial bullish breakout followed by extended sideways movement. Pudgy Penguins token broke above $0.0135 around 08:05 UTC and surged to $0.0143 by 08:40 UTC, establishing a short-term uptrend. This upward move coincided with RSI entering overbought territory and MACD signaling a golden cross. However, momentum cooled quickly, shifting into a narrow sideways path between $0.0135 and $0.0145. MACD formed a death cross during this consolidation, and RSI hovered neutrally, hinting at decreasing buying strength after the initial rally.
Chart 2- TRX/USDT M5 Chart, Analyzed by Alokkp0608, published on May 9th, 2025.

For the next 9 hours (09:00 to 18:00 UTC on May 8), PENGU price traded in a tight sideways range, oscillating between $0.0143 and $0.0135. No breakout attempts were observed during this window, and trading remained muted. RSI dipped into oversold twice, showing weakening buyer support, while MACD flipped between minor golden crosses and death crosses, reflecting indecision. This prolonged consolidation above the earlier breakout zone suggested that $0.0135 had become a crucial support level. Price stability during this phase built up latent pressure ahead of a potential PENGU breakout.
Spike Breaks Sideways Path, Then Faces Resistance
From 18:00 UTC to 03:00 UTC, Pudgy Penguins token continued to respect its sideways path, trading flat without notable volume spikes or volatility. Support at $0.0135 remained firm, while resistance near $0.0145 capped the upper end. RSI repeatedly approached the neutral line, and MACD signals remained flat, indicating balanced momentum. The extended range suggested accumulation, preparing for a larger move. This anticipation played out around 06:00 UTC on May 9, when a sudden spike shot the price from $0.0140 to a one-time high of $0.0170. This marked a PENGU breakout event and disrupted the prior sideways cycle.
Between 06:00 and 09:00 UTC, the PENGU price retreated sharply from $0.0170 and stabilized near the $0.0160 resistance. RSI spiked into overbought territory and began falling shortly after, signaling a blow-off top. MACD also printed a golden cross during the breakout, but soon reversed with a death cross, reflecting quick momentum exhaustion. The $0.0160 resistance proved strong, rejecting any further upside. Following the spike, PENGU entered a new sideways path slightly below this resistance, hinting at a possible retest scenario depending on upcoming volume and sentiment.
Consolidation Near Resistance After PENGU Breakout
In the most recent interval, PENGU traded narrowly between $0.0151 and $0.0155, holding above earlier breakout zones but below the critical $0.0160 resistance. RSI cooled off to neutral levels, while MACD lines flattened out after the morning volatility. The market appeared to be digesting the earlier spike, with buyers attempting to stabilize the price and build support for another leg up. The $0.0150 level now acts as minor support, while any move above $0.0160 could revive bullish momentum. However, the lack of strong indicator signals suggests cautious sentiment for now.
Momentum Shift After Spike Faces Key Resistance
PENGU’s latest breakout above $0.0145 surged into $0.0170 but faced heavy rejection at the $0.0160 level, shifting momentum from bullish to neutral. Support is now firm around $0.0150 and $0.0135, while $0.0160 remains the key resistance to watch. RSI behavior shows the spike pushed the market into overbought before pulling back, and MACD reflected the shift with a brief golden cross followed by a death cross. Momentum is cooling, and unless bulls reclaim $0.0160 with volume, price may stay in consolidation. The Price analysis suggests potential for another breakout if $0.0160 is breached convincingly.
PENGU Price Analysis of May 13th, 2025
The PENGU price action over the last 24 hours shows a shift from steep bearish pressure to a more controlled uptrend. From 09:00 UTC, the Pudgy Penguins token steadily declined within a descending channel, slipping from the $0.01480 range to $0.01325 by around 15:05 UTC. RSI entered oversold conditions twice during this phase, confirming intense selling pressure. Despite a small consolidation around $0.01385 at 17:10 UTC, the rebound was weak and short-lived. MACD also showed repeated death crosses, reflecting bearish control. The sharp fall finally found a base near the key support of $0.01250 at 18:45 UTC, initiating a potential reversal pattern just before momentum shifted.
Chart 3- PENGU/USDT M5 Chart, Analyzed by Alokkp0608, published on May 13th, 2025.
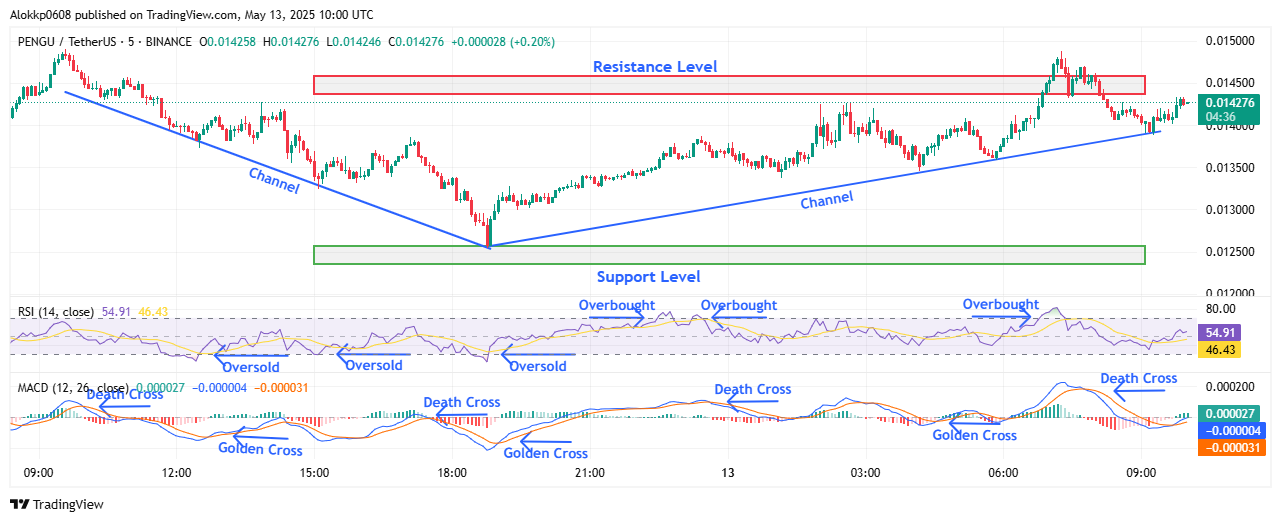
Between 18:45 UTC and 00:45 UTC, the price entered a slow but stable recovery within an ascending channel. Price bounced from the support level and steadily climbed toward $0.01387 by 22:50 UTC. This move was supported by a golden cross in MACD around 19:00 UTC, which signaled early bullish momentum. RSI moved out of the oversold zone and started oscillating in the mid-range, hinting at strengthening sentiment. From 23:00 UTC onward, the price action shifted into a sideways phase, indicating temporary indecision as traders waited near breakout levels. The structure remained constructive as it stayed above the rising trendline support.
Buyers Regain Control After Dip
Between 01:00 UTC and 06:00 UTC, Pudgy Penguins token made a second bullish attempt, targeting the overhead resistance near $0.01450. The upward thrust from $0.01390 took the price to $0.01426 by 02:35 UTC. RSI hit overbought territory during this leg, reflecting short-term bullish exhaustion. MACD also confirmed a bullish crossover, aligning with the upward momentum. However, the rally paused before touching resistance, causing a minor rejection and consolidation below $0.01410. The price formed higher lows, maintaining its place inside the broader uptrend channel. This showed buyers were still present, despite the brief rejection near the PENGU resistance zone.
From 06:00 UTC to around 09:30 UTC, the PENGU price broke through resistance briefly, reaching as high as $0.01475. This breakout coincided with another RSI overbought spike and a sharp MACD golden cross, suggesting peak buying enthusiasm. However, the move was unsustainable as sellers quickly stepped in, dragging the price back below resistance by 08:30 UTC. A fresh MACD death cross formed, and RSI slid back toward neutral. Still, the structure of higher lows remained intact, showing that while resistance was strong, the bulls hadn’t fully lost control. The price stabilized above $0.01400, finding support along the rising channel line.
Consolidation Near Resistance After Breakout
In the latest price activity leading up to 10:00 UTC, PENGU price hovered just below resistance around $0.01427, trying to recover from the earlier rejection. The price found footing along the ascending channel support and began grinding upward again. Momentum has turned mixed, RSI is back in the neutral range after overbought conditions faded, and MACD is flatlining slightly below the signal line, indicating hesitation. Despite the retreat from the highs, PENGU remains technically bullish as long as the price holds above $0.01400. A breakout above $0.01450 could unlock further upside, but the bulls need stronger volume to push decisively through the PENGU resistance zone.
PENGU Momentum Cools Just Below Resistance Zone
The Pudgy Penguins token’s recent surge met resistance at $0.01475, triggering a pullback toward $0.01400, where it now consolidates. Momentum remains moderately bullish, supported by a rising channel and higher lows. If price sustains above $0.01400, another test of the $0.01450–$0.01475 PENGU resistance zone looks likely. RSI has cooled to mid-50s, offering room for upside, while MACD’s recent death cross signals reduced momentum. Watch for a new golden cross or RSI push above 70 to confirm renewed strength. If the channel holds, buyers may retarget $0.01500. A break below $0.01400, however, could pull the price back toward $0.01360 or even $0.01325.
PENGU Price Analysis of June 7th, 2025
The PENGU price action today, from the start of trading to 11:20 UTC, shows a strong bullish breakout followed by a shift to consolidation before another push upward. The session opened inside an uptrend channel, with price rallying from the initial support zone near $0.00937 and breaking through resistance at $0.00969 by 01:00 UTC. This breakout formed a Higher High (HH) and Higher Low (HL) structure. However, a short dip followed by a death cross at 01:14 UTC suggested temporary exhaustion. RSI had entered overbought territory during the rally, reinforcing the need for a pullback before continuation.
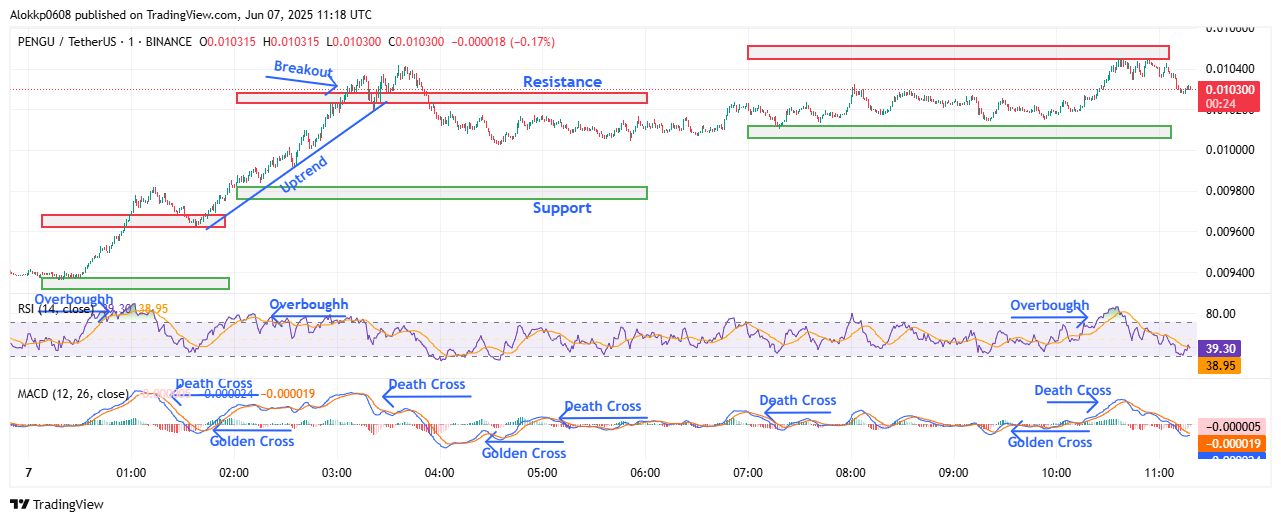
PENGU/USDT M-1 Chart, Analyzed by Alokkp0608, published on June 7th, 2025.
Between 01:30 UTC and 03:15 UTC, Pudgy Penguins token maintained its bullish momentum within a new rising structure. The support shifted up to $0.00982, and resistance redefined near $0.01027. A golden cross around 01:42 UTC reignited momentum, sending the price past $0.01027 by 03:05 UTC. However, this breakout was brief and unsustained. A sharp rejection occurred after another death cross at 03:15 UTC, with the price making a Lower High (LH) and starting to slip toward $0.01003. RSI also reversed from overbought during this rejection, indicating weakening strength among buyers.
Range-Bound Behavior Followed by Renewed Interest
Between 03:30 UTC and 07:00 UTC, PENGU price moved sideways in a narrow range between $0.01003 and $0.01030. This sideways path suggested market indecision, reinforced by back-to-back MACD death crosses and flattened RSI just under midline levels. The price repeatedly failed to clear minor resistance at $0.01030, showing no clear higher highs, and mostly printing horizontal candles. A support zone formed near $0.01003, where the price bounced multiple times. This phase hinted at accumulation but lacked strong conviction either way.
From 07:00 UTC to 10:15 UTC, the range-bound movement continued, but small HLs began to build near $0.01010, signaling slow upward pressure. A golden cross on MACD at 09:25 UTC marked the return of bullish bias. RSI also pushed back toward the upper mid-band, suggesting recovering momentum. Still, the lack of a decisive higher high kept the move in check until the final hour. This period reflected the market trying to regain confidence after a flat consolidation stretch.
Strong Move Toward Resistance Around $0.01044
After 10:15 UTC, PENGU price began breaking out of the sideways zone and formed a new uptrend channel. Support moved up to $0.01011 while resistance tightened around $0.01044. The price rose steadily, forming clear HLs and HHs, and touched $0.01044 before pulling back slightly. However, a fresh death cross at 10:40 UTC dampened some momentum. RSI had touched overbought levels again during this breakout, indicating strong short-term interest but also the likelihood of minor corrections. The quick rejection near $0.01044 shows this zone now acts as a strong local resistance.
Bullish Momentum Cooling at Resistance Near $0.01044
Pudgy Penguins token currently shows slowing bullish momentum after reclaiming ground above $0.01030. The short-term outlook leans cautiously bullish but with signs of local exhaustion. Key support levels to watch are $0.01011 and $0.01003. Resistance zones remain at $0.01030 and $0.01044. MACD’s latest death cross could limit upside unless a swift bullish crossover follows. RSI has retreated from overbought but remains neutral, suggesting that momentum could swing either way. If bulls defend the $0.01011–$0.01003 region, a fresh push above $0.01044 is possible. However, a break below $0.01003 would shift short-term momentum back to neutral or bearish.


