

The PEPE Coin has been facing heavy selling pressure throughout the trading session, with the price tightening before a sudden PEPE bullish breakout attempted to disrupt the market sentiments. On briefly seeing a spike toward $0.0000072, the PEPE Price was immediately rejected and taken down into a steep descending channel. Significant support formed at $0.0000064, while strong resistance caps any further gains at around $0.0000068, leaving price movements increasingly trapped in a zone of rising volatility.
The RSI moved violently in both directions, signaling warnings of increasing instability and an explosive move. This heavy momentum turned against bullish attempts, signaling a highly possible day of action for the market. Let’s now delve into the PEPE Price analysis for clues into the next move for PEPE.
PEPE Price Analysis for April 28, 2025
PEPE Coin began trading operations yesterday at $0.000008884. PEPE’s price encountered its first significant break when it reached 0.000009200 before remaining under heavy resistance. Trading formed a well-defined support block around $0.000008600, near which the price was reached.
Soon after the market opened at 03:00 UTC, the MACD indicator displayed a golden cross signaling potential upcoming bullish price movement. PEPE Price fluctuations failed to exceed its trading bounds. The market developed another golden cross pattern, intensifying the buying pressure. PEPE prices experienced a minor decline after the death cross formation occurred at 15:00 UTC. The market experienced two instances of bearish reversal patterns via golden crosses, which happened at 12:00 UTC and another one at 18:00 UTC. Both bullish signals were opposed immediately by bearish signals through death crosses. RSI entered two oversold positions while maintaining support strength through this period.

Chart 1, PEPE/USDT M5 Chart, Analysed By Anushri Varshney, Published on TradingView, April 28, 2025
At 03:00 UTC, the second golden cross triggered the PEPE price to move towards the consolidation phase. PEPE failed to sustain its attempt at breaking through the resistance and support zones above $0.000009200. The price recovery of the RSI reached approximately 60.35 as the trading day finished, indicating a situation of market stability. PEPE established a defined horizontal trading range, which produced several significant short-term trading opportunities that materialized from MACD indicator signal changes and RSI indicators.
What Does PEPE Price Action Suggest?
The PEPE Coin is fluctuating in a tight range, with PEPE price finding solid support at $0.00000860 and sliding past resistance at $0.00000920. The MACD chart shows a series of golden and death crosses, indicating continual churns in the short-term momentum. However, no sign of PEPE pushing strongly above resistance. RSI has dipped into oversold territory several times, indicating buying opportunities. Traders should watch for a golden cross on MACD while the RSI surges above 60 for the next bullish rally.
Will PEPE Coin Break Out Soon?
PEPE Coin price shows signs of consolidation, but a strong move will be needed to confirm new trends. According to the price analysis, the PEPE price is stuck between support at $0.00000860 and resistance at 0.$00000920. The RSI has hit the oversold territory several times, suggesting buyers are coming into action to protect support. A breakout for PEPE is still lacking in the flow. An optimistic reading for traders would be a golden cross on the MACD and the RSI crossing above 60. If this were to happen, the PEPE breakout could break resistance and launch a fresh rally.
PEPE Price Analysis Of April 30th, 2025
PEPE price action started with low volatility, consolidating between $0.000000872 and 0.000000910 from 00:00 to 03:00 UTC. This narrow sideways move showed limited direction, with RSI hovering near 50 and MACD lines showing fluctuations. At 03:25 UTC, the token dipped to $0.000000882, briefly breaking below support. The token declined to $0.000000890 at 03:45 UTC but stayed in the defined trading range. A death cross on MACD affirmed the downward trend while RSI dropped into oversold territory below 30, triggering a minor buying response that led to a brief recovery. Between 05:00 UTC and 09:00 UTC, the price of PEPE experienced an upward movement in a small rising pattern.

Chart 2, PEPE/USDT M5 Chart, Analysed By Anushri Varshney, Published on TradingView, April 30, 2025
The market achieved its highest point at $0.000000910 during this period but appeared to move near the resistance. The RSI reading reached the overbought area at 07:15 UTC, indicating that exhaustion had set in. During the initial part of the price rally, the golden cross formed on the MACD earlier in the session, confirming the start of bullish momentum before the price hit resistance. The price failed to maintain itself above $0.000000900 while it returned to a period of horizontal movement. PEPE maintained a small price range stretching from $0.000000890 to $0.000000905 when the purchasing strength began to wane.
Prolonged Consolidation and Bearish Breakdown in PEPE Price
The PEPE token remained stagnant while confined within a flat horizontal channel. Price movement within the RSI area maintained a balanced state across the period. PEPE repeatedly tested $0.000000905 resistance without breaking through it to close above. The asset did not trade at high volumes which demonstrated there was no market leader during this consolidation period. The market initiated a brief selling pressure at 17:50 UTC which caused PEPE to move toward $0.000000880.
From 19:00 UTC until the next day, PEPE showed bearish price movement through a descending trend. Bearish indicators suggested continued weakness, with no immediate signs of trend reversal. By 23:30 UTC, the token hit a low of $0.000000873. The RSI indicator entered the oversold zone a second time to validate pronounced bearish market momentum. The market remained under seller control following the price target near $0.000000880. The downtrend resisted growth throughout its duration till its weak finish at the close of April 29.
PEPE Price Outlook – What Lies Ahead for PEPE?
During the early hours of April 30, the PEPE token tried to recover after bouncing off the $0.000000873 level. The token traded slightly upward for the last six hours, moving from 00:00 UTC to 06:00 UTC, finally hitting a high of $0.000000891 before retracing. Near 02:30 UTC, a golden cross appeared on the MACD, indicating the first bullish momentum. But a sudden downward price movement before 05:00 UTC gave a death cross, showing waning strength. The PEPE token remained range-bound between $0.000000880 and $0.000000891, showing no clear directional bias.
PEPE Price at Crossroads – Awaiting Breakout Confirmation
The recent golden cross on the MACD shows that upside is a prospect although repetitive death crosses and neutral RSI readings show mixed momentum. If confirmed, the above stated breakout could send PEPE to try the upper zone near $0.000000910 in retesting. But if PEPE loses support again and crosses below $0.000000871, more selling pressure might be created, keeping prices lower. Traders should closely monitor RSI behaviors and MACD crossovers for now. A most significant indication of the next move may come with increased trading volume. The upcoming sessions will be vital to seeing if bulls can maintain a steady PEPE breakout.
PEPE Price Analysis For May 2, 2025
PEPE coin opened the session with slight bearish pressure, limiting price action to a trading range. However, PEPE showed upward momentum early on May 1, but the rally lost steam after a MACD death cross at 01:45 UTC triggered short-term selling. A golden cross at 04:50 UTC helped the price recover, but the move lacked strength. By 06:45 UTC, PEPE attempted a breakout, but the momentum quickly faded as the rally failed to gain strength. RSI briefly hit overbought levels, signaling a potential reversal. At 07:15 UTC, a MACD death cross appeared, and the price began to fall sharply, ending the breakout attempt. At 10:15 UTC, RSI entered the overbought territory, triggering selling pressure and pushing the price down from its session high at $0.00000909.
This caused the prices to hit the resistance level at $0.00000910, marking the highest hit of the day. PEPE struggled to break higher despite reaching a peak, reflecting market caution. Lower highs and weakening support suggest a bearish sentiment, as traders remain hesitant in the face of uncertainty. At 13:15 UTC, PEPE tested its support at $0.00000871. If this level fails to hold, we could see further downside towards $0.00000850. The price remained confined to the declining channel because the rebounding force proved inadequate.
Bearish Momentum Slows, Price Forms Tight Range
The price action between 15:00 and 21:00 UTC showed that the falling trend partially lost its downward momentum. RSI activity remained balanced, which indicated that the market momentum reached equilibrium. The PEPE price maintained a narrow trading pattern in a boundary space within the descending channel.

Chart 3- PEPE/USDT M5 Chart, Analysed By Anushri Varshney, Published on TradingView, May 2, 2025
In the final hours of the trading session, PEPE coin tried to re-enter its descending channel. However, the brief price surge failed to hold, and the coin slipped back to its range near $0.00000871. RSI briefly crossed above 70, suggesting short-term overbought conditions. The current trading conditions show that the price is stabilizing close to its support level while waiting for confirmation on its price trajectory. PEPE price movements could increase upwards after a decisive breakout surpassing the resistance area, but weak support holding could cause additional downward trends.
PEPE Holds Above 0.00000874 After 2 Rejections
On May 2, 2025, the PEPE coin traded within a symmetric price range between $0.00000874 and $0.00000891, price action indicated bearish momentum through RSI positions and varied MACD patterns contributing to the market volatility. At 01:10 UTC, PEPE tested resistance near $0.00000888. A golden cross, where the short-term moving average crosses above the long-term moving average, briefly suggests upward momentum. However, the move lacked strength, and the price failed to maintain its rise. Several MACD death crosses and falling RSI values signaled weakening buyer momentum. The price stayed above support but lacked strength for a PEPE breakout. Traders should avoid prominent positions until a confirmed breakout or breakdown appears.
PEPE Price Struggles to Hold Ground as Bulls Lose Momentum
PEPE prices hover near their support zone without developing any agreement on a new market direction. The coin made an unsuccessful attempt to escape from its downward channel pattern. The market bears cannot elevate the price above the current short-term resistance zone at $0.00000888. However, sellers have failed to push the PEPE price below $0.00000871 during this period. For PEPE coin to experience an effective breakout, it requires solid volume and precise trend indicators, which should establish momentum. A PEPE breakout should occur when buyers surpass the resistance zone at $0.00000910, creating temporary upward momentum. Traders should avoid prominent positions until a clear breakout or breakdown is confirmed with volume support.
PEPE Price Analysis of May 6, 2025
Pepe price has witnessed a degrading price action in the last 24 hours. The coin started its trading session with an upward bullish momentum, where the prices were moving around the $0.00000837 resistance level in the early hours of the trading session. Let’s break down the PEPE price action and assess Pepe’s next possible moves. Pepe commenced the trading session yesterday at $0.00000822. A death cross formed at 01:10 UTC, creating an impact on the price action of Pepe coin. By 02:15 UTC, a golden crossover formed, giving support to begin a bullish momentum. Pepe went into a remarkable upward momentum and hit the resistance level at 06:00 UTC.

Chart 4- PEPE/USDT M5 Chart, Analysed By Anushri Varshney, Published On TradingView, May 6, 2025
This momentum was also supported by the overbought signal that appeared on the RSI indicator at the same time. However, a decline occurred after a death crossover hit the MACD at 08:05 UTC, calling for a possible trend reversal. The trend reversal began as Pepe underwent a remarkable price decline to $0.00000803 in the next 4 hours until a golden crossover came into action at 12:20 UTC. The RSI was oversold at this point, indicating a possible reversal. A reversal followed, but could only push the price to $5.297. At 6:10, a death cross dropped prices to $0.00000807. At this point, the price formed another upward trend, which was met with a few corrections. This trend led the price to $0.00000807 by 18:45 UTC.
Pepe Scales to $0.00000788, Fails to Hold On to Gains.
This abrupt rise also led to an overbought RSI. While market participants expected a deep correction, Pepe found a bottom close by at $0.00000779. Thanks to the multiple crossovers on MACD that don’t let a significant pepe breakout occur during the day. At 20:35 UTC, an oversold condition occurred on the RSI, intensifying the buying pressure among the traders. However, a golden crossover also occurred at 21:00 UTC, indicating a Pepe price gain and leading the price action move into an upward channel. However, the crossovers don’t let the change happen. These fluctuations continued to occur till the arrival of the next day.
Pepe Coin Faces Strong Trading Zone Pull -Is A Breakout Coming?
Pepe price was recorded trading at around $0.00000795. It initially slipped to $0.00000774, but a golden crossover appeared at 02:55 UTC, holding the price in the trading range. However, the new day brought renewed bullish pressure, as the price spiked to $0.00000798 within 30 minutes. The prices are now moving in an ascending movement. Since then, the bulls have taken control. Although a bullish reversal was observed, Pepe has since returned to trade at $0.00000796
Is PEPE on the Verge of a Breakout?
PEPE coin experienced dramatic price peaks and troughs within 24 hours. Every appearance of a golden or death cross pattern in the charts resulted in shifting price levels. PEPE shows restricted price movements as aggressive investors battle it out to gain dominance. Several major indicators, from RSI to MACD, revealed contradictory signals between bullish and bearish territory, thus confusing traders. A stable price zone maintained $0.00000796 throughout the period.
PEPE shows strong potential for purchases and acquisitions across its framework at lower price levels. PEPE trading zone conserves its condensed nature through the repeated market authority agreements between active buyers and sellers. A price breakout may occur through continuous market pressure applied by buyers. Traders should focus on market-rate changes accompanied by important signal patterns.
PEPE Price Analysis of May 8, 2025
The PEPE price analysis over the last 24 hours shows a clear breakout from range-bound action, followed by a rally. Yesterday, the price moved sideways between the support at $0.00000795 and the resistance at $0.00000833. Market momentum was neutral during this phase, as seen by repeated death crosses on the MACD and a neutral RSI. A golden cross appeared on the MACD, signaling the start of bullish momentum. The price continued to move into the trading channel and surged to $0.00000888 by 04:30 UTC. During this movement, RSI hit overbought levels above 70, while volume surged, confirming a strong breakout.

Chart 5- PEPE/USDT M5 Chart, Analysed By Anushri Varshney, Published on TradingView, May 8, 2025
After the rally topped at $0.00000888, the price began to fluctuate. Between 05:00 and 06:30 UTC, PEPE coin pulled back slightly but held the channel support, staying above $0.00000870. From 07:00 UTC to 09:30 UTC, the market shifted into consolidation. PEPE traded between $0.00000870 and $0.00000880, unable to break the upper resistance but still above the breakout zone of $0.00000833. Another golden cross formed on the MACD near 08:30 UTC, indicating an attempt to regain control.
By 10:00 UTC, price attempted another push, briefly touching $0.00000880 again, but was rejected, forming a minor double top. After that, the price drifted slightly lower but continued to respect the upward channel structure. A fresh death cross appeared on the MACD at 10:45 UTC, confirming a temporary stall. RSI remained stable in the mid-zone. Around 11:30 UTC, PEPE is trading around $0.00000875. It remains well above the previous resistance level at $0.00000833. The price action is still bullish, but the market is waiting for either a PEPE breakout above $0.00000888 or a retest of the support zone to confirm the next move.
PEPE Price Stalls Below $0.00000888 as Market Enters Consolidation
The PEPE Price is consolidating today after failing to break the $0.00000888 resistance during the early hours around 02:30 UTC. Since then, PEPE Coin has stayed range-bound between $0.00000865 and $0.00000880 through the session. The bullish PEPE Breakout from yesterday remains valid, but momentum has slowed. RSI is neutral near 55, and MACD turned flat after a weak golden cross at 07:15 UTC. As of 11:00 UTC, the price is holding near $0.00000875. With price staying between $0.00000833 and $0.00000888, a breakout in either direction will likely define the next major move.
PEPE Price at a Crossroads, Key Resistance and Support Awaited
PEPE Price is consolidating after a strong breakout, and the bullish structure remains intact, although momentum has slowed. Price remains above strong support at $0.00000833 and continues to face resistance at $0.00000888. At the time of writing, momentum indicators have also cooled and are indicating indecision in the market, but have remained neutral as well. As long as the price holds above this level, the bullish structure remains intact, and traders are watching closely for a decisive move. PEPE coin is in a tightly bound range and waits for conviction.
From here, the next phase of price action will be dependent on whether PEPE can break upper resistance or if a deeper pullback to support is likely to occur. The behaviour of the price will be interesting near either of these areas, and it will be important in determining the next direction of the trend.
PEPE Price Analysis of May 12, 2025
The PEPE price opened with high volatility yesterday. A clear PEPE breakout defined the day, turning early weakness into upward momentum. The day opened with a drop from $0.00001390, and the market moved into a downward channel through the early morning hours. Between 01:00 and 08:00 UTC, price action remained contained inside the channel. MACD triggered a golden cross near 02:30 UTC, but failed to spark momentum. A brief death cross at 06:30 UTC aligned with a final dip, where RSI touched oversold levels at 07:45 UTC. The PEPE coin bottomed near $0.00001280, just above the support level at $0.00001259.
From 08:00 UTC onward, sentiment turned. Buyers stepped in, gradually pushing PEPE into an upward channel. MACD triggered another golden cross at 11:45 UTC, confirming bullish intent. RSI climbed through neutral and briefly entered the overbought zone at 13:30 UTC. At 17:30 UTC, a sharp candle pushed the price outside the rising channel, marking a clear breakout. The price rallied straight into the day’s resistance level at $0.00001424 by 18:30 UTC.
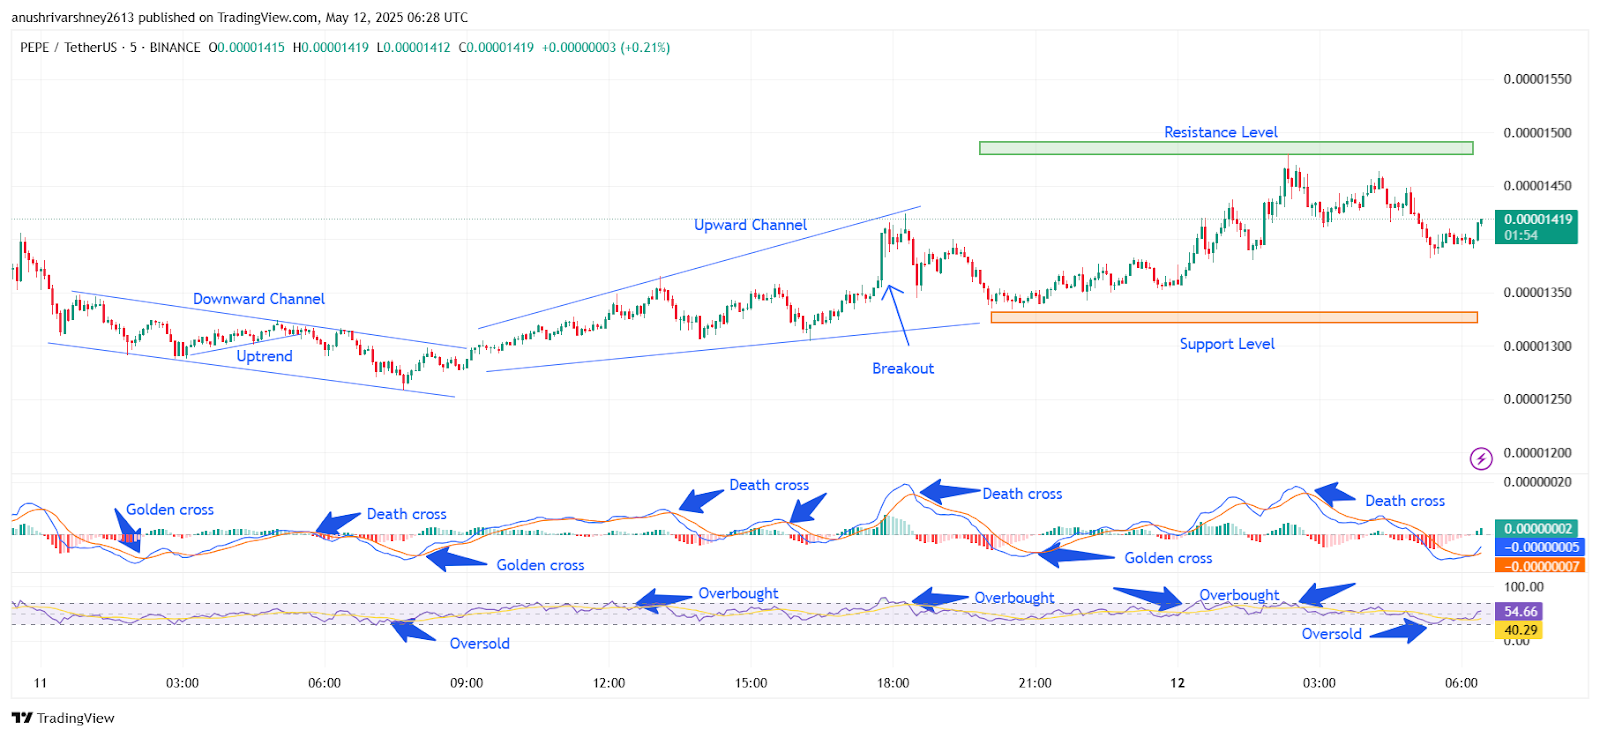
Chart 6- PEPE/USDT M5 Chart, Analysed By Anushri Varshney, Published on TradingView, May 12, 2025
A lower high formed at 20:15 UTC, as MACD turned into a death cross, and momentum slowed down. Despite brief spikes, the price couldn’t reclaim the breakout high. A series of bearish candles formed as the market moved around $0.00001400. Throughout the day, PEPE coin respected its support level, climbed with structure, and confirmed a strong breakout. The rejection near $0.00001424 kept gains in check, but trend conditions remain bullish.
PEPE Coin Starts Cautious Recovery Above New Support
The PEPE price today is showing signs of stabilization after an overnight pullback. Price found new intraday support near $0.00001345 and is attempting a slow recovery. The current range is capped by a fresh resistance level at $0.00001410. After dipping early in the session, PEPE rebounded with mild volume, and MACD has flipped into a smooth bullish crossover. RSI remains near 54, suggesting room for movement on either side. So far, the structure is neutral, with no aggressive trend confirmed. A push above $0.00001410 could open a short-term rally toward $0.00001440, while rejection may keep the price consolidating near support. The PEPE price needs stronger volume to regain breakout momentum.
PEPE Breakout Holds as Bulls Defend Structure
The PEPE price delivered a structured move from early weakness to a decisive intraday PEPE breakout. After holding the $0.00001259 support level, the bulls started to gain power, forming an upward channel and pushing the price into breakout territory before 17:30 UTC. The breakout led to a quick push toward the $0.00001424 resistance level. Momentum weakened post-breakout, and lower highs confirmed a slowdown. Despite the late retracement, price respected key midrange zones at $0.00001360 and rebounded slightly into the close. Indicators like MACD and RSI echoed this cycle, showing multiple momentum shifts, overbought exhaustion, and settled price action. Overall, the day confirmed structural improvement and growing buyer interest. The outlook remains bullish above $0.00001350. A break back above $0.00001424 could extend the rally, while failure to hold above $0.00001320 may put pressure back on buyers.
PEPE Price Analysis For May 14, 2025
The PEPE Coin price analysis over the last 24 hours shows a high mix of trends, consolidation, and momentum shifts. The day began somewhat slowly, but steadily declined as the price of PEPE entered into a downward channel near 05:00 UTC. The price then dropped from $0.00001470 to a low of $0.00001360. The MACD remained bearish, and the RSI ranged near the oversold zone, confirming weakness in momentum. At 05:15 UTC, the trend shifted as a golden cross formed on the MACD. The price began climbing inside a clean upward channel. Between 05:30 UTC and 08:30 UTC, the price moved from $0.00001360 to $0.00001450.
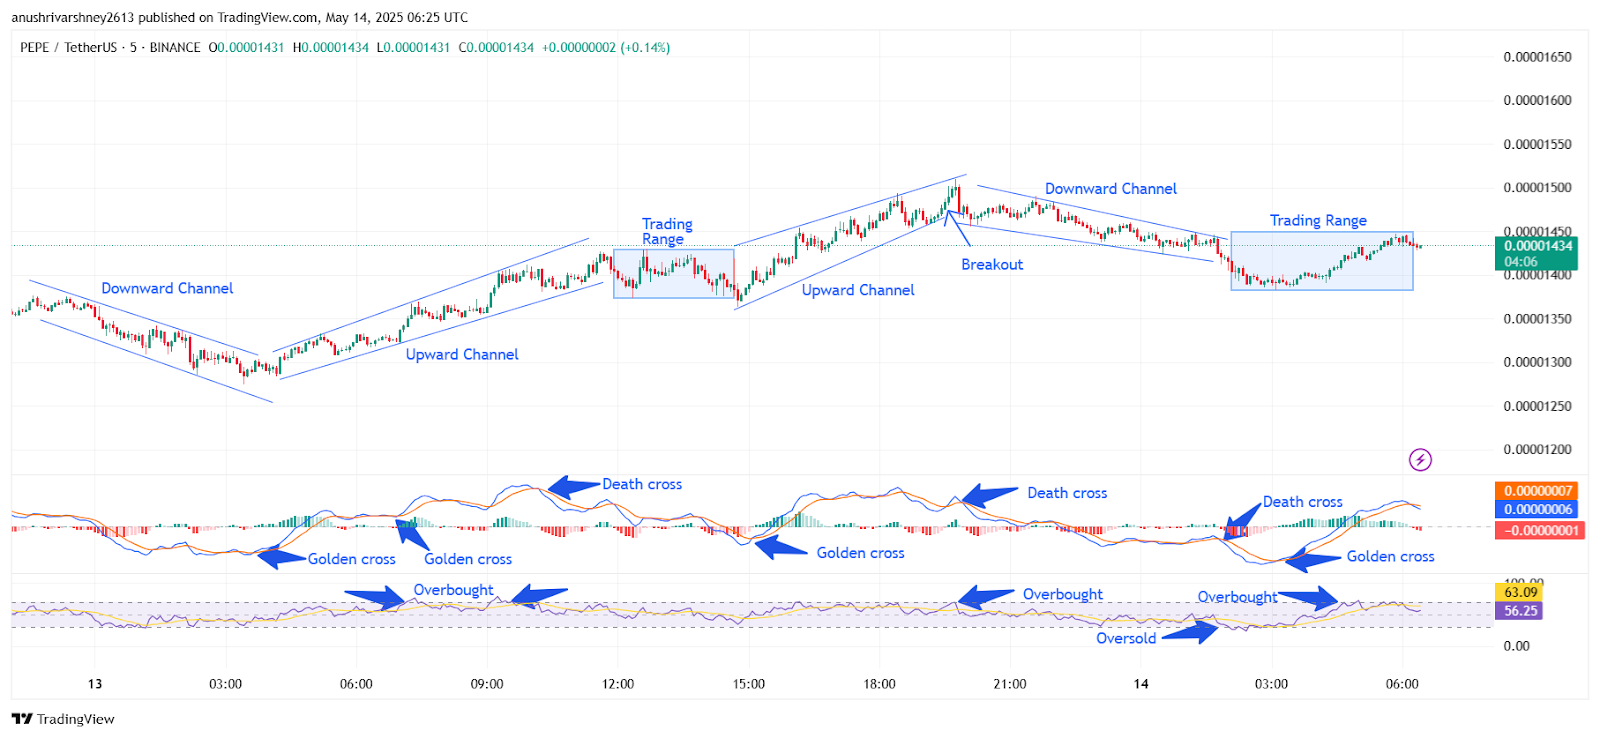
Chart 7- PEPE/USDT M5 Chart, Analysed By Anushri Varshney, Published on TradingView, May 14, 2025
From 08:30 UTC to 11:45 UTC, the price entered a sideways range between $0.00001430 and $0.00001450. This trading range showed indecision after the morning recovery. A fresh golden cross appeared in the middle of the day, triggering the second rally on yesterday’s trading session. From 12:00 to 17:45 UTC, the PEPE price moved inside another upward channel. The coin broke above the earlier range and climbed sharply from $0.00001440 to a peak of $0.00001640.
By 18:00 UTC, the price started reversing as RSI dropped from overbought territory and a death cross appeared on the MACD. The PEPE coin then entered a downward channel from 18:30 UTC to 23:00 UTC. Price fell steadily from $0.00001640 to $0.00001410. The MACD and RSI showed strong bearish momentum. During the final hour, from 23:00 to 23:59 UTC, the price stabilized between $0.00001400 and $0.00001430.
PEPE Price Slows After Volatile Reversal
The PEPE price traded sideways today after yesterday’s heavy drop. As of 03:00 UTC, the coin stayed in a narrow range of between $0.00001400 and $0.00001420. RSI is below 50, and MACD has been neutral, showing low momentum. At 03:30 UTC, a golden cross occurred, resulting in a small bounce to $0.00001450. However, RSI only reached 63 before pulling back. PEPE then entered another narrow range between $0.00001420 and $0.00001440, showing signs of indecision. No clear PEPE breakout has occurred yet. Momentum is neutral, and traders are watching for direction.
PEPE Price Awaits Clear Direction
PEPE Coin is currently in a wait-and-watch phase after yesterday’s heavy volatility. The strong rejection from $0.00001640, followed by a sharp drop, has caused traders to remain cautious. Today’s sideways movement shows the market is trying to regain balance. Indicators like RSI and MACD remain neutral, hinting at reduced momentum on both sides. For bulls to regain control, the PEPE price must break above $0.00001460 with strong volume. It would confirm a new short-term uptrend and could open a move toward $0.00001500.
If support near $0.00001400 breaks, a retest of $0.00001360 remains possible. Overall, the chart reflects consolidation after a wide swing, and the next clear move will likely decide direction for the coming sessions. Until then, the PEPE Coin remains in range with no confirmed breakout yet, but a PEPE breakout setup may be developing as volatility compresses and momentum begins to rebuild.
PEPE Price Analysis For May 19, 2025
Over the last 24 hours, the PEPE Price analysis shows a full cycle of bullish and bearish moves, driven by channel formations, crossovers, and multiple PEPE breakout signals. The action began with strong upside momentum, followed by sharp corrections and a final attempt to stabilize before today’s session. PEPE token started the day near $0.00001220 and entered an upward channel during the early hours. From 01:00 to 07:30 UTC, the price moved steadily higher inside this structure. A clean golden cross formed on the MACD at 03:00 UTC, while the RSI crossed into overbought around 04:30 UTC, confirming strong buying interest. By 07:30 UTC, the price touched the upper boundary of the channel, hitting $0.00001460.
However, between 08:00 and 12:00 UTC, the bullish trend faded. A death cross appeared on the MACD at 09:30 UTC, followed by the breakdown of the upward channel at 10:00. This confirmed a shift in momentum. The PEPE Price dropped quickly, forming a clear downward channel by 12:30 UTC. Sellers took control, and by 16:00 UTC, PEPE had retraced to $0.00001250. The RSI showed oversold conditions, and a MACD golden cross appeared again at 16:30 UTC, signaling early recovery signs.
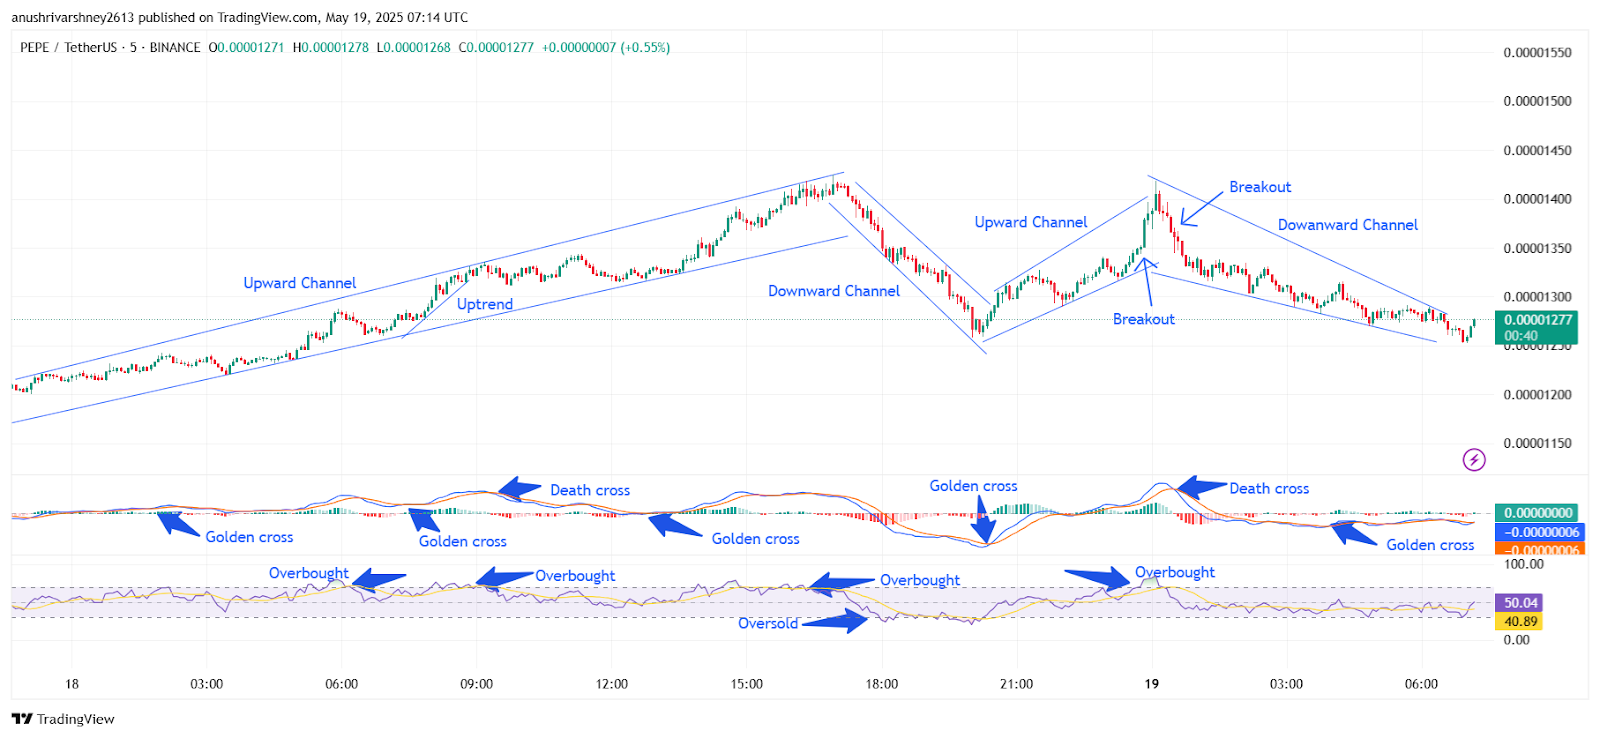
Chart 8- PEPE/USDT M5 Chart, Analysed By Anushri Varshney, Published on TradingView, May 19, 2025
Between 17:00 and 20:00 UTC, the PEPE Coin bounced back and built a short-lived upward channel. A sharp PEPE breakout at 19:00 UTC lifted the price back above $0.00001390, reaching a quick peak. From 21:00 UTC onward, PEPE entered a second downward channel. A new death cross on the MACD at 22:00 UTC added to the bearish confirmation. The PEPE Price moved slowly lower throughout the night, between $0.00001250 and $0.00001270.
PEPE Price Rebounds 2.1% After Falling from $0.00001460 High
Today’s PEPE Price shows early signs of recovery after yesterday’s extended decline. During the first few hours, PEPE Coin traded sideways near $0.00001260 inside a tight range. Around 06:30 UTC, the MACD flashed a golden cross, and RSI climbed above 50, signaling mild bullish momentum. A minor PEPE Breakout followed as the price crossed $0.00001275, slightly breaking the descending channel. However, volume remained weak, limiting upside strength. PEPE trades near $0.00001277 by noon, showing stabilization but not full reversal. Indicators stay neutral, with RSI around 50 and MACD flattening out. A close above $0.00001300 is needed to confirm a stronger PEPE token rebound later.
PEPE Coin Faces Key Turning Point After Volatile Moves
The PEPE Price is now at a critical point after cycling through multiple trends over the past 24 hours. The chart shows two clear upward channels, followed by breakdowns into downward channels, highlighting strong volatility. Several PEPE Breakout points were visible, but none held long due to repeated overbought RSI signals and MACD death crosses. While the early gains pushed PEPE Coin near $0.00001460, the failure to sustain that level led to a steep drop back toward $0.00001250.
Now, with a fresh golden cross forming on MACD and RSI stabilizing near 50, the PEPE Price shows potential for a short-term bounce. However, without strong volume or a breakout above $0.00001300, upside momentum may stay limited. Traders should watch the next few candles closely. A confirmed breakout could shift sentiment, while a rejection may bring further retests of the lower support zone near $0.00001250.
PEPE Price Analysis For May 23, 2025
The PEPE Price analysis shows a full day of shifting momentum, marked by uptrends, channel breakdowns, and sharp recoveries. The price action began strongly in the early hours, climbing steadily inside an upward channel. This early strength was backed by a golden cross on the MACD and an RSI overbought signal around 00:45 UTC, pushing PEPE Coin toward the $0.00001660 zone. By 01:50 UTC, the trend reversed. Price broke below the channel, entering a downward channel as RSI dropped and a MACD death cross printed at 02:30 UTC. Bears controlled momentum for 30 minutes until the price settled in a tight trading range between 02:45 and 03:15 UTC, holding around the $0.00001580 to $0.00001600 levels.
A brief PEPE breakout attempt followed as MACD flipped bullish again with a golden cross near 03:20 UTC, but the rally was short-lived. The price turned lower again at 03:35, entering a fresh downtrend. By 04:00 UTC, the price broke below previous range support, confirming the trend shift. Multiple death crosses and RSI oversold zones followed between 04:30 and 05:30 UTC, keeping pressure on the PEPE price.
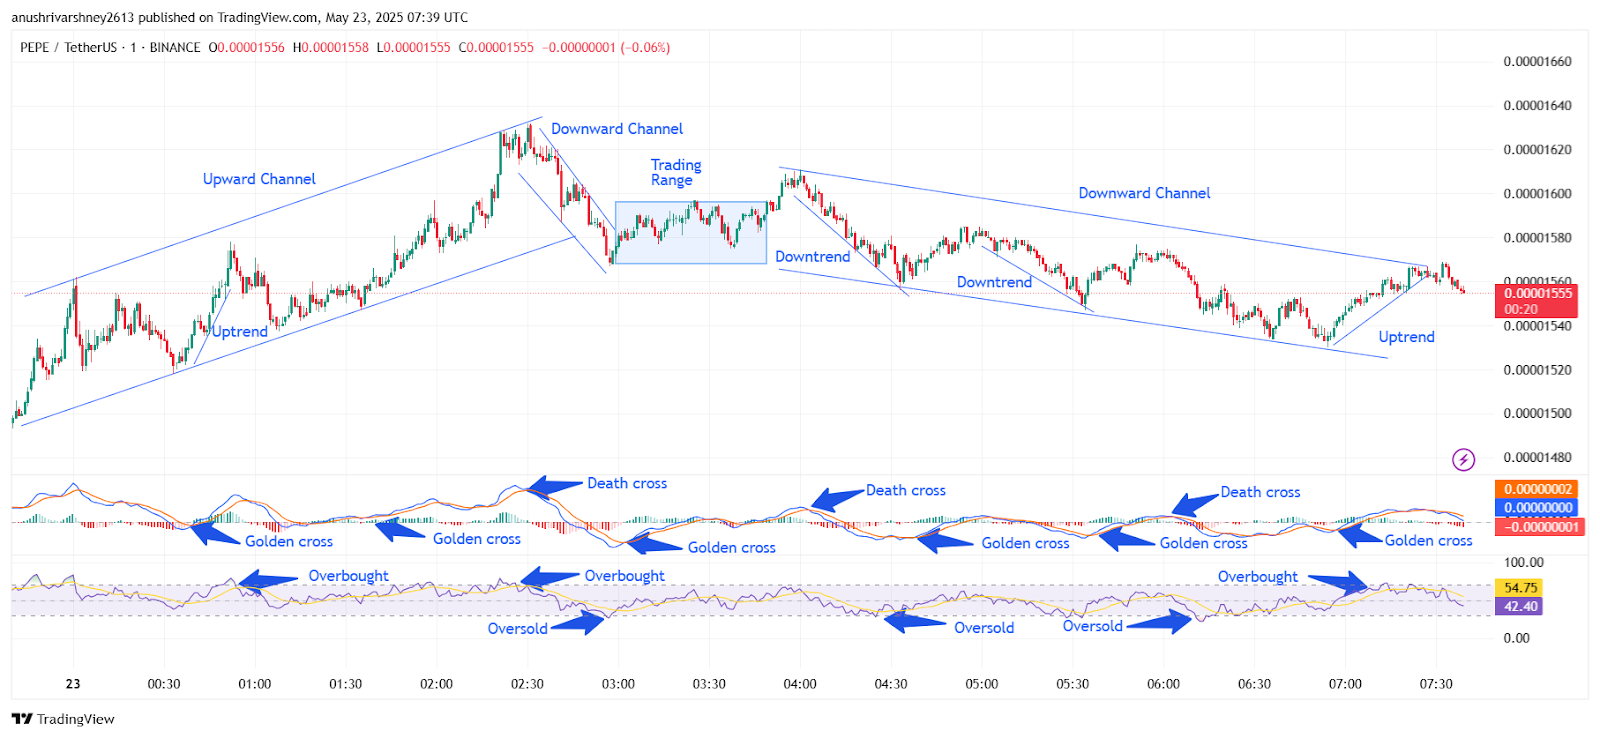
Chart 9- PEPE/USDT M1 Chart, Analysed By Anushri Varshney, Published on TradingView, May 23, 2025
The broader structure formed a downward channel from 05:00 to 06:30 UTC, with clear lower highs and lower lows. The PEPE Price touched its daily low near $0.00001520 at 05:45 UTC. However, bulls returned just after, forming a short uptrend starting at 06:30 UTC. This bounce was supported by a MACD golden cross and an RSI overbought signal at 07:00 UTC, lifting the price back toward $0.00001560.
PEPE Price Holds Between $0.00001520 and $0.00001600 as Momentum Cools
By 07:30 UTC, the price had stalled again, showing sideways movement. A final death cross was seen on the MACD near the end of the session, suggesting reduced bullish strength heading into the next period. Overall, PEPE Coin spent the day cycling through clean technical phases. The price began with strength, reversed into downtrends, then attempted a late recovery. Key resistance remains at $0.00001600 while support holds near $0.00001520. Each breakout and reversal was well-validated by MACD and RSI. If bulls keep the price above $0.00001560, another PEPE breakout toward $0.00001600 is possible. But if it slips below $0.00001540, downside risks may return. The market shows mixed signals for now, and short-term traders should stay alert to intraday shifts.
PEPE Coin Future: Key Levels Hold After Volatile Swings
The PEPE Coin market today displayed a mix of aggressive swings and controlled rebounds, forming clear intraday patterns. Early strength inside an upward channel was backed by a golden cross and RSI overbought zone, but bears took over quickly after a confirmed breakdown. The mid-session saw PEPE Price locked in a trading range, followed by a clean downward channel where repeated death crosses and RSI oversold signals pushed price to the day’s low near $0.00001520. A minimal PEPE breakout attempt occurred in the final hours, driven by bullish MACD crosses and renewed RSI strength.
Price lifted to 0.00001560 but failed to break resistance at $0.00001600. Overall, the PEPE Coin market held its broader support while showing signs of reactive recovery. As long as the $0.00001540–$0.00001520 zone holds, bulls can reattempt another breakout. However, losing that zone may bring more downside. Momentum remains fragile, and traders should monitor short-term indicators closely.
PEPE Price Analysis For June 2, 2025
The PEPE price analysis highlights a full cycle of trading activity, with early volatility, sharp corrections, and a late recovery. The day began with the PEPE coin trading sideways inside a tight range near $0.00001168. Momentum was neutral, with no clear direction. By 00:30 UTC, a minor uptrend started forming as RSI crossed above 60 and MACD showed a golden cross. Price pushed toward $0.00001178 before topping out.
However, the uptrend was short-lived. By 01:00 UTC, PEPE coin reversed course. PEPE coin slipped into a descending pattern by 01:30 UTC, with the price breaking below $0.00001160. A death cross confirmed the bearish shift on the MACD. RSI dropped quickly, reaching oversold territory by 02:00 UTC. A small relief bounce came at 02:15 UTC, but it was short-lived as the decline extended further as sellers remained in control.
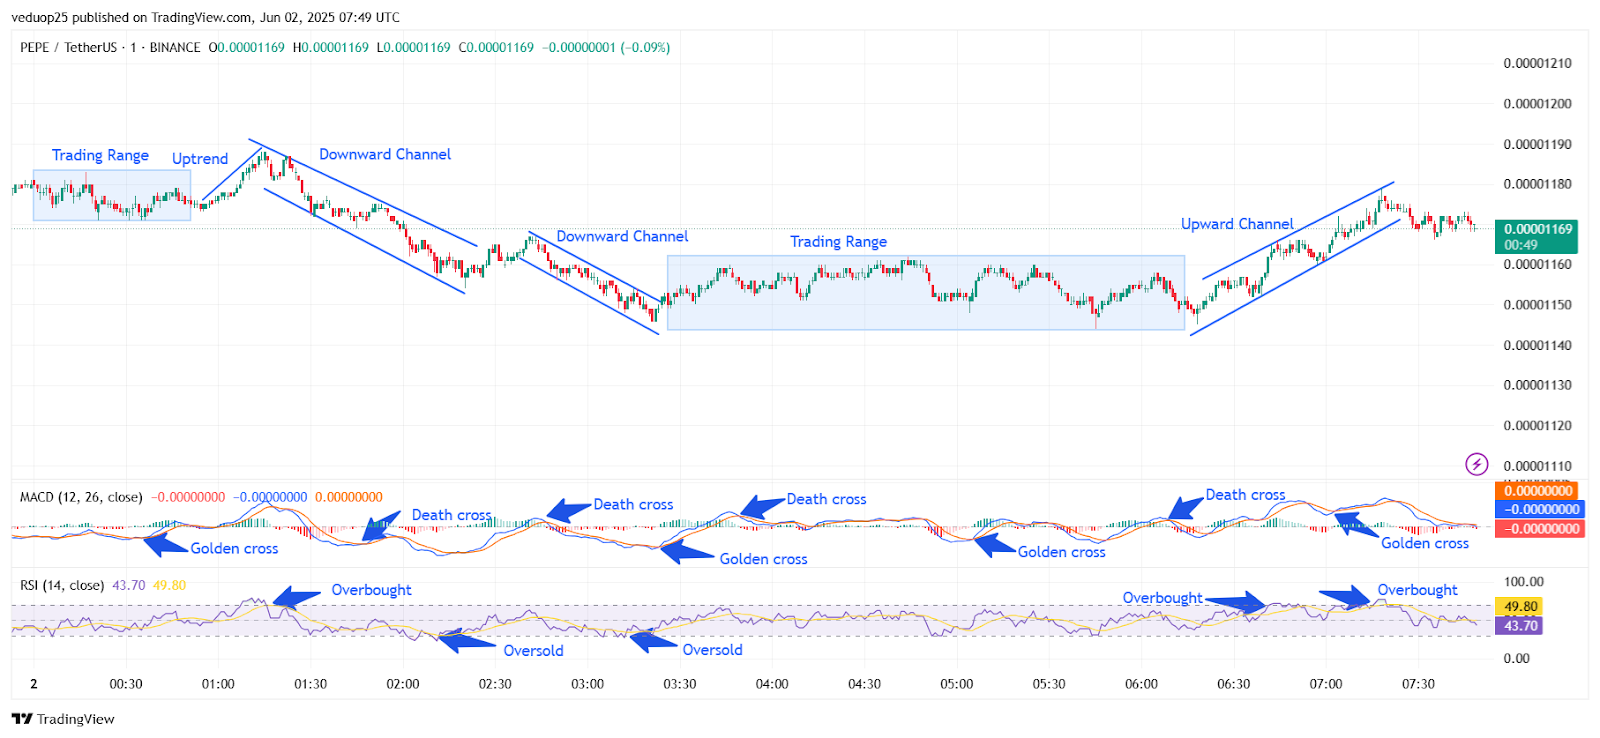
Chart 10- PEPE/USDT M1 Chart, Analysed By Anushri Varshney, Published on TradingView, June 2, 2025
From 02:30 UTC to 03:30 UTC, the downtrend progressed into a second downward channel. MACD flashed another death cross, while RSI touched oversold again. The PEPE price found a short-term bottom near $0.00001135. Buyers started stepping in from this level, and by 03:45 UTC, a slow recovery began.
PEPE Breakout Rally Stalls After Hitting 0.00001180 High
Between 04:00 and 05:30 UTC, PEPE coin entered a trading range between $0.00001140 and $0.00001155. This sideways action came with several golden and death crosses on MACD, but none had strong follow-through. A clear PEPE breakout appeared at 05:45 UTC as the price jumped into an upward channel. A strong golden cross on MACD and rising RSI toward 70 confirmed bullish momentum.
PEPE price surged from $0.00001155 to a high near $0.00001180 by 07:00 UTC. RSI entered overbought twice during this stretch, marking peak buying pressure. After 07:00 UTC, the rally paused. A mild pullback followed as MACD showed a death cross and RSI cooled. By 07:30 UTC, PEPE coin was consolidating just above $0.00001169, holding support after the breakout.
PEPE Coin Holds Support After Volatile Breakout Session
The recovery from the $0.00001135 low was key, showing buyer interest at oversold levels. Once momentum returned around 05:45 UTC, the PEPE coin entered a strong upward channel with bullish signals across the MACD and RSI. The price hit an intraday high near $0.00001180 before facing resistance. Despite the late-session pullback, PEPE price held above $0.00001169, signaling possible trend continuation if support levels remain intact. The RSI’s recovery to neutral and the MACD’s recent golden cross earlier in the session remain encouraging.
While overbought signals triggered a pause in momentum, there was no sharp rejection. If the PEPE coin maintains its footing above $0.00001165, another PEPE breakout may form soon. Bulls should watch for renewed buying above $0.00001175, while bears may eye support breaks below $0.00001160. If momentum holds, PEPE coin could revisit the day’s high in upcoming sessions.
PEPE Price Analysis For June 6, 2025
The PEPE price analysis shows a clean technical structure with three distinct phases: early consolidation, a PEPE breakout inside an upward channel, and late-session range movement. The session began near $0.00001107 at 00:00 UTC, with the PEPE coin holding a flat trading range between $0.00001103 and $0.00001109 until 01:30 UTC. During this phase, momentum was low, with RSI hovering around 50 and MACD showing early golden crosses.
At 01:35 UTC, a mild downtrend broke the range to the downside, but the move was short-lived. PEPE price quickly reversed around 02:00 UTC as RSI entered oversold territory. A strong PEPE breakout followed, confirmed by a golden cross on MACD near 02:15 UTC. This breakout marked the start of a steady upward channel that carried the price higher through the mid-session.
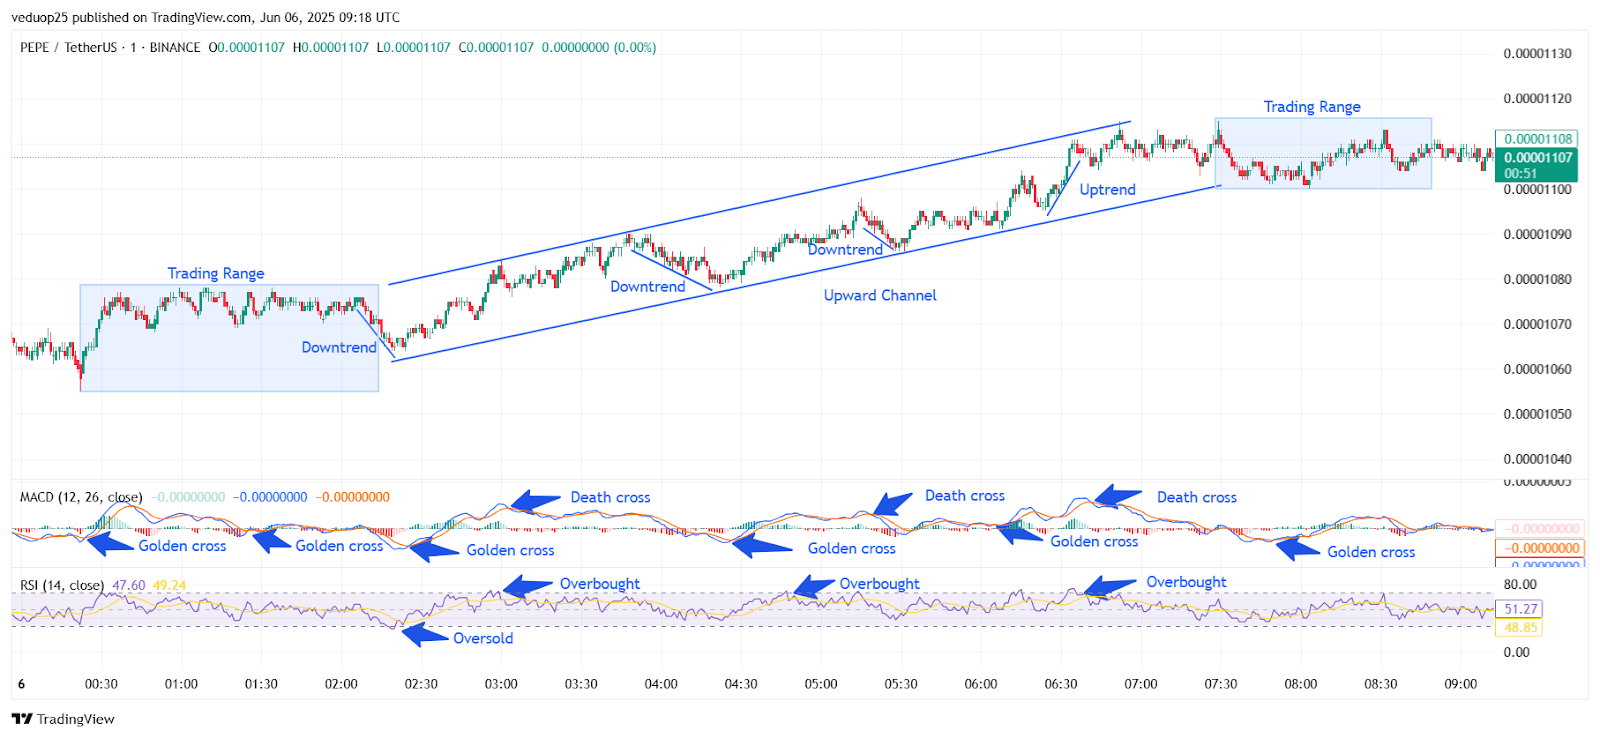
Chart 11- PEPE/USDT M1 Chart, Analysed By Anushri Varshney, Published on TradingView, June 6, 2025
Between 02:15 and 04:45 UTC, the PEPE coin moved inside the channel with higher highs and shallow dips. Each brief downtrend inside the channel was followed by a recovery, with golden crosses appearing repeatedly on the MACD. RSI moved into overbought territory multiple times, notably around 03:00 UTC and again near 04:30 UTC, signaling strong buyer momentum. The price reached a session high of $0.00001126 around 04:45 UTC.
PEPE Breakout to $0.00001126 Fades Into $0.00001106–$0.00001112 Range
By 05:00 UTC, momentum began to fade. MACD printed a death cross near 05:30 UTC, and RSI fell back to the neutral zone. The upward channel was broken at 06:00 UTC as the PEPE price dropped slightly and entered a new consolidation range. This range held between $0.00001106 and $0.00001112 for the session.
From 06:00 to 09:00 UTC, the PEPE coin traded sideways. The MACD flipped direction multiple times, signaling indecision. RSI remained balanced between 48 and 52, suggesting a cooling-off period after the earlier rally. Indicators aligned well with the price moves, offering clean golden crosses during the breakout and balanced signals during consolidation. PEPE coin trades within a tight range, awaiting its next directional move.
PEPE Price Leads to Channel Rally, Ends in Sideways Range
The PEPE coin ended the session on a neutral note after a clear breakout and structured rally. The early trading range was uneventful, but momentum shifted sharply in favor of the bulls once the PEPE breakout occurred around 02:00 UTC. The price steadily climbed within an upward channel, supported by repeated golden crosses and strong RSI spikes. This phase defined most of the mid-session action and pushed the PEPE price to a local high of $0.00001126.
However, by 05:30 UTC, indicators began to cool off. MACD flipped to a death cross while RSI settled near 50. From 06:00 UTC onwards, the trend faded and the price moved sideways inside a narrow band. With no strong reversal or continuation signal, the PEPE coin now sits in a consolidation phase. Traders will be watching for fresh volume or breakout signals to decide the next short-term direction.
PEPE Price Analysis For June 10, 2025
The PEPE price analysis shows a clear shift in momentum, starting with a deep correction phase, consolidation, and finally a clean upward breakout. Price opened near $0.00001274 and moved through a full cycle of decline, stability, and recovery. By 02:00 UTC, the PEPE coin was in a steep downtrend. The price dropped from $0.00001308 to $0.00001268 inside a falling structure. By 01:00 UTC, this shifted into a wide downward channel. RSI dipped into oversold territory twice, and MACD showed golden crosses at 00:30 and 01:15 UTC, though they failed to shift the trend. Bears dominated this phase.
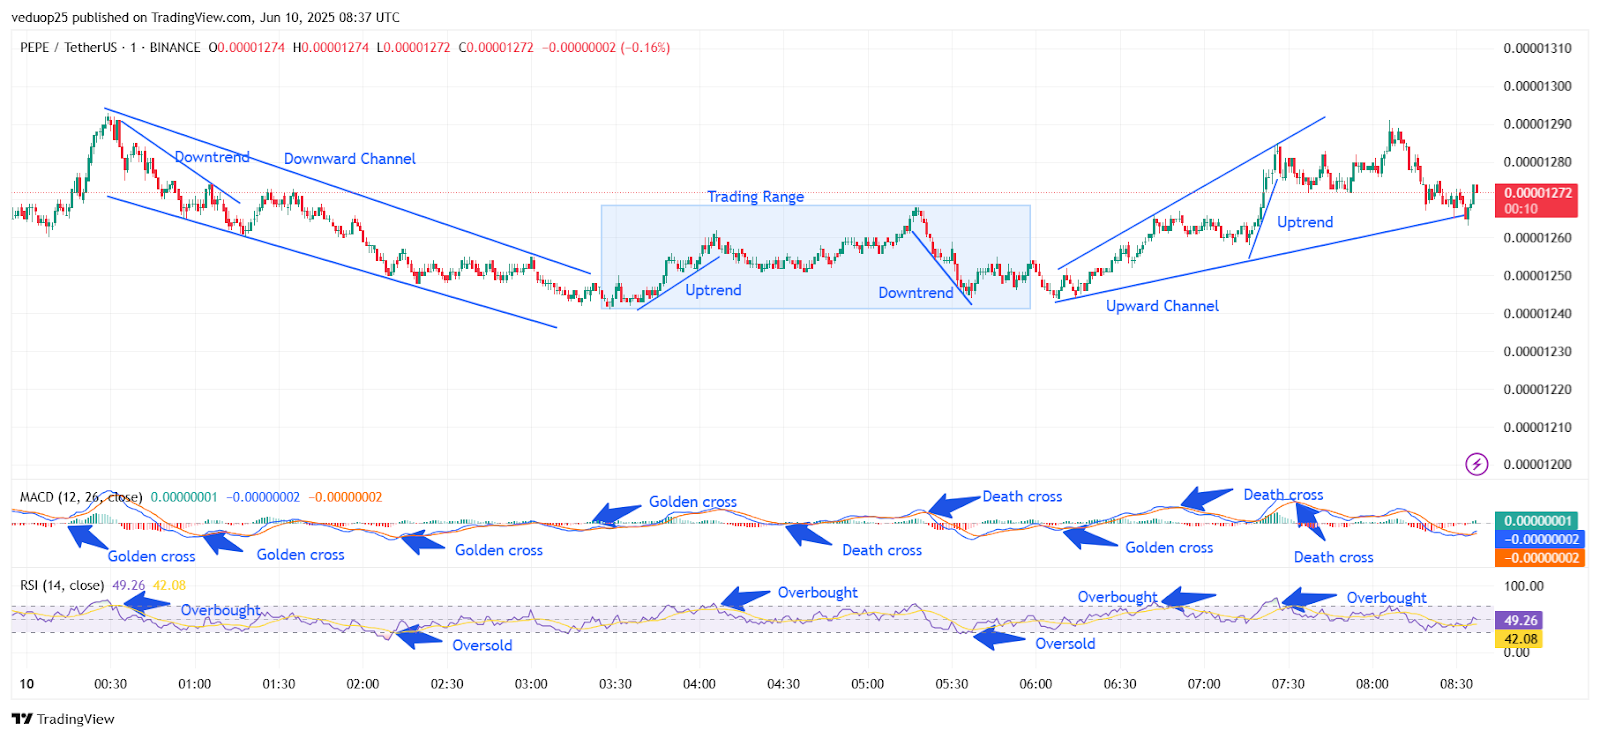
Chart 12- PEPE/USDT M1 Chart, Analysed By Anushri Varshney, Published on TradingView, June 10, 2025
Between 02:00 and 03:30 UTC, PEPE price stayed inside the same downward channel. Price slipped further to $0.00001252. Momentum remained weak. RSI touched a low near 35, and MACD briefly flipped bullish but flattened again. From 03:30 UTC, a small uptrend began forming near the lower edge of the channel. From 03:30 to 05:30 UTC, PEPE moved into a tight trading range. Price bounced between $0.00001252 and $0.00001274. A mild uptrend showed around 03:45 UTC, but it was short-lived. MACD printed golden crosses around 04:00 UTC, followed by death crosses near 05:00 UTC. RSI moved above 60 briefly, touching the overbought zone, before falling back again. A short downtrend followed inside the range.
PEPE Breaks Out Above $0.00001250, Eyes $0.00001290 Next
The breakout phase started after 05:30 UTC. From 05:30 to 07:30 UTC, the PEPE coin surged out of the range into an upward channel. Price climbed steadily from $0.00001250 to $0.00001290. RSI reached overbought levels multiple times, especially around 06:45 and 07:00 UTC. MACD confirmed strength with back-to-back golden crosses during this rise. The bullish structure was clearly in control during this phase.
In the final stretch from 07:30 to 08:30 UTC, the PEPE price pulled back slightly but held above $0.00001270. MACD gave a death cross near 08:00 UTC, and RSI returned to neutral. Price stayed inside the upward channel, showing signs of steady momentum. Overall, the day closed with the PEPE breakout intact and bullish signs holding. Key support sits at $0.00001250. A push above $0.00001290 could confirm further upside for the PEPE coin in the next session.
PEPE Maintains Uptrend With Breakout Still Intact
The PEPE price closed the session with bullish momentum firmly intact. The coin reversed course after a heavy early correction and built strength into a confirmed breakout. RSI readings showed oversold conditions early in the day, but shifted to overbought levels during the rally phase, signaling a clear change in sentiment. MACD played a pivotal role throughout the session, with multiple golden crosses supporting the breakout between 05:30 and 07:30 UTC.Although a minor pullback followed, the price held above $0.00001270 and stayed within the rising channel. This steady close and intact support at $0.00001250 keeps the PEPE coin in a healthy structure.
A confirmed move above $0.00001290 may open the door for continued upside in the next session. However, failure to hold current levels could trigger short-term consolidation. The PEPE price outlook remains cautiously bullish as long as momentum indicators stay aligned.
PEPE Price Analysis For June 14, 2025
The PEPE price analysis highlights a mix of sharp drops, quick recoveries, and one strong PEPE Breakout that shifted the short-term direction. The PEPE Trend remained mostly bearish until bulls stepped in during the early morning hours. Around 00:45 UTC, the PEPE Price moved sideways with no strong momentum. But right after, the first drop came between 00:45 and 01:15 UTC. Price fell from $0.00001130 to $0.00001116.
A golden cross showed up briefly on MACD, but the move lacked support and flipped to a death cross by 01:30 UTC. From 01:30 to 02:15 UTC, the chart remained weak. Three short downtrends followed, but the price didn’t break below $0.00001110. MACD gave multiple golden crosses but failed to bring strength. A small upward move came next. Between 02:30 and 03:30 UTC, PEPE Price entered a clean upward channel and moved from $0.00001112 to $0.00001127.

Chart 13- PEPE/USDT M1 Chart, Analysed By Anushri Varshney, Published on TradingView, June 14, 2025
However, this move didn’t last. From 03:30 to 04:00 UTC, a fast reversal began. The price dropped back to $0.00001117. RSI hit overbought levels earlier and started falling. MACD also gave a clean death cross by 04:15 UTC. The PEPE Trend flipped again.
PEPE Breakout Follows Deep Downtrend, But Momentum Fades Quickly
Between 04:15 and 05:15 UTC, PEPE Price stayed in a downward channel. It hovered between $0.00001113 and $0.00001118 with no breakout signs. MACD gave small golden crosses, but momentum stayed weak. From 05:30 to 07:15 UTC, a wider downward channel took over. The price dropped further from $0.00001116 to $0.00001105. RSI touched the oversold zone, and MACD printed another strong death cross.
A clean shift came at 07:30 UTC. The PEPE trend flipped bullish for the first time in hours. PEPE Price broke out of the channel and jumped from $0.00001105 to $0.00001121 within 30 minutes. This was the day’s strongest PEPE Breakout. RSI pushed into the overbought zone, while MACD confirmed a golden cross. From 08:00 to 08:30 UTC, a minor pullback hit as sellers returned. The price dipped toward $0.00001112 again. A death cross followed on the MACD. The final hour between 08:30 and 09:00 UTC stayed neutral. PEPE moved sideways between $0.00001111 and $0.00001113.
PEPE Trend Remains Mixed Despite Brief Breakout
The PEPE Price showed a volatile session with more weakness than strength. Most of the day was filled with slow downtrends and tight downward channels, keeping the PEPE Trend under pressure. MACD gave several golden crosses, but most failed to hold momentum. RSI signals confirmed overbought and oversold zones, which lined up well with each major shift. The only clean move came after 07:30 UTC when the price hit oversold. A strong PEPE Breakout followed, pushing the price up sharply.
However, that breakout was short-lived as sellers quickly returned. The chart closed with flat movement, showing indecision at the end. For now, the PEPE Trend remains neutral to slightly bearish. If bulls want to regain control, they must defend the $0.00001105 support and create higher highs above $0.00001121. Traders should watch for another PEPE Breakout or breakdown near those levels before taking fresh positions.
PEPE Price Analysis For June 19, 2025
The PEPE price analysis shows a shift from early volatility to a stable trading range by the end of the session. The day began with a quick push upward. From 00:00 to 00:20 UTC, the PEPE coin moved inside a rising channel, climbing from $0.00001034 to $0.00001056. RSI spiked into the overbought zone, and the MACD showed a golden cross, confirming early bullish momentum.
However, from 00:20 to 01:15 UTC, the trend reversed sharply. PEPE price entered a downward channel and dropped to $0.00001035. RSI dipped toward the oversold area, and the MACD printed a death cross at 00:45 UTC, marking a clear loss in momentum. Between 01:15 and 04:15 UTC, the market entered a wide sideways phase. PEPE price traded in a range between $0.00001034 and $0.00001045.
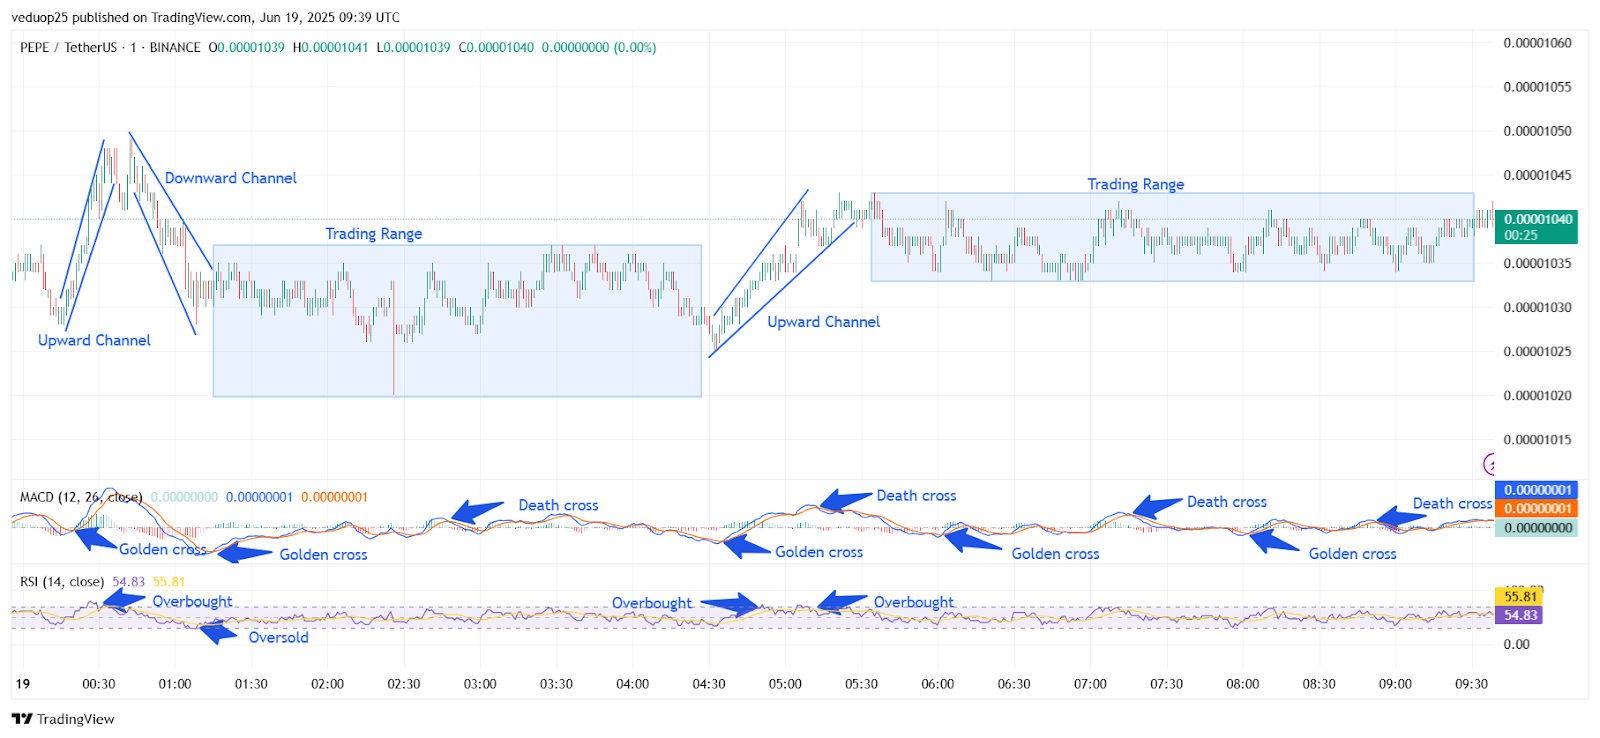
Chart 14- PEPE/USDT M1 Chart, Analysed By Anushri Varshney, Published on TradingView, June 19, 2025
Multiple golden and death crosses appeared on the MACD, showing mixed momentum. RSI stayed close to the midline, with no strong signals. Buyers and sellers stayed balanced throughout this period. At 04:15 UTC, the PEPE Coin saw a slight recovery. Price climbed in an upward channel from $0.00001035 to $0.00001049 by 05:00 UTC. RSI briefly moved above 70, and a golden cross formed on the MACD. This looked like the beginning of a possible PEPE Breakout.
PEPE Price Stalls Between $0.00001036–$0.00001042
But from 05:00 to 06:00 UTC, momentum faded. RSI came down from overbought, and the MACD formed a death cross again. Price retraced slightly, showing the move had no strength to continue. The rest of the session, from 06:00 to 09:30 UTC, was dominated by sideways action. PEPE price remained stable inside a narrow trading range between $0.00001036 and $0.00001042. MACD showed alternating signals with low volume, while RSI stayed near 55. This was a clear consolidation phase after the failed breakout.
By the close, PEPE coin returned to $0.00001040, showing almost no net gain over the day. The earlier breakout attempts were short-lived, and most of the session stayed neutral. A clear PEPE breakout will need stronger volume and RSI confirmation in the next sessions.
PEPE Price Fails to Hold Momentum Amid Sideways Pressure
The PEPE price closed the session with little change, despite early signs of volatility and brief breakout attempts. The initial upward channel and overbought RSI hinted at bullish intent, but sellers quickly regained control, pulling the PEPE Coin into a downward channel. While a recovery followed with another upward push, MACD and RSI failed to sustain a clear trend, and price action shifted back into a tight trading range.
Repeated golden and death crosses on the MACD reflected indecision, while RSI hovered around the mid-level. The failed PEPE breakout attempts suggest a lack of strong momentum or volume to drive a clear trend. Unless new buying pressure steps in, the current sideways structure may persist. Traders should watch for a breakout above $0.00001045 or below $0.00001035.
PEPE Price Analysis For June 23, 2025
The PEPE price analysis highlights a clear sequence of trend shifts, breakout attempts, and range-bound moves supported by technical signals. PEPE price opened the day near $0.00000886 and held flat for the first few minutes. Around 00:15 UTC, a minor uptrend pushed the price toward $0.00000892, but it quickly lost strength. A sharp rejection followed, creating a clear PEPE downtrend that extended until 01:00 UTC.
From 01:00 to 03:45 UTC, the price continued to move inside a downward channel, touching lower highs and finding support near $0.00000880. RSI entered overbought territory twice, signaling fading momentum early in the session. Meanwhile, the MACD death cross near 02:30 UTC aligned with the continued drop, validating bearish sentiment.
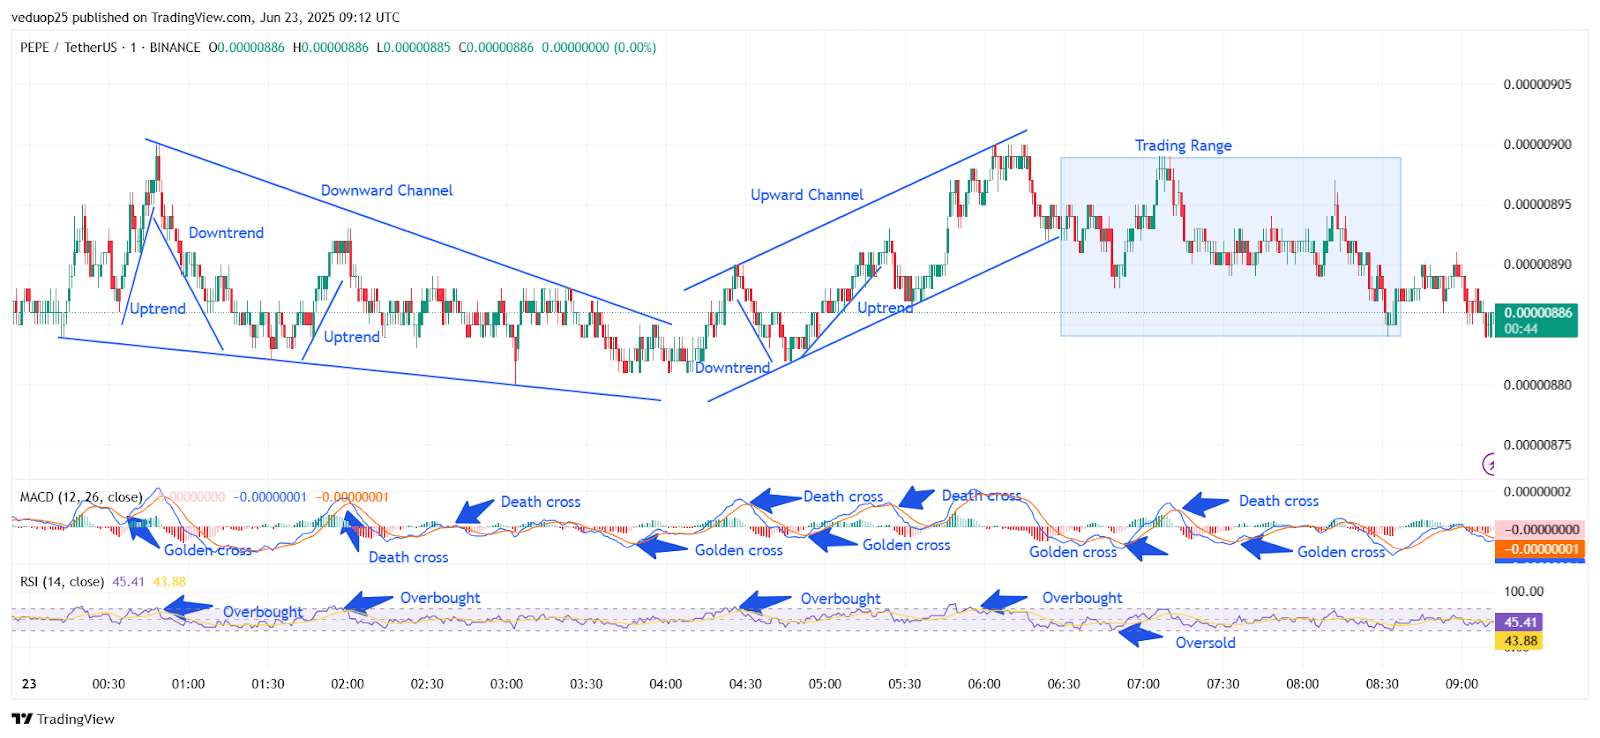
Chart 15- PEPE/USDT M1 Chart, Analysed By Anushri Varshney, Published on TradingView, June 23, 2025
By 04:00 UTC, the PEPE trend changed. Price bounced from the channel’s lower boundary, sparking a sharp recovery. This marked the beginning of an uptrend and later an upward channel. Price moved steadily higher from $0.00000882 to $0.00000898 by 05:45 UTC. A PEPE breakout from the previous downtrend was confirmed with a MACD golden cross, followed by another spike in RSI into the overbought zone around 05:15 UTC.
PEPE Price Stalls in Choppy Range Amid Weak Momentum
After reaching the local high near $0.00000898, momentum faded. A quick sell-off at 06:00 UTC shifted the price back into consolidation. From 06:30 UTC onwards, PEPE entered a sideways trading range between $0.00000890 and $0.00000897. This range held for nearly two hours, showing a lack of clear direction. RSI oscillated above and below 50 as the MACD had alternating periods of dead and golden crosses, indicating volatile price action.
PEPE price briefly hit $0.00000884, which pushed it into oversold territory on the RSI @ 07:15 UTC. Price found a small bounce but did not get follow-through from buyers and returned to the mid-range and consolidated until 08:45 UTC. In closing, PEPE’s day started with a downturn, then reversed with an upward breakout, and now settled into a tight range. A breakout of PEPE, either up with volume over $0.00000898 or down with volume under $0.00000884, will determine the direction of PEPE’s price action.
PEPE Price Holds Ground After Volatile Swings
The price of PEPE was mixed, moving from a solid downtrend into a strong recovery state and ultimately landing in a sideways range. PEPE was initially taken lower but managed to create a temporary pressure that created some bullishness as PEPE broke out above the downward channel MODE. Sadly, PEPE’s move was short-lived as it struggled to close above the conglomeration of resistances at $0.00000898, landing in a tight range for the remainder of the sessions. The indicators conveyed indecision throughout the session, indicating a mixed bag of overbought/oversold signals across the graphic.
The trend erased without anything convincing occurring from bulls or bears. PEPE returned to open for the day without bulls breaking through the upper range and bears not breaking the support. PEPE appears to be in a continuous state of consolidation, unless we see a confirmed breakout above the $0.00000898 mark, or a break below 0.00000884 in which tailors the next move into the coming sessions.
PEPE Price Analysis For June 27, 2025
The PEPE price analysis shows a series of short trends and clean reversals. The trading day started with a steady PEPE uptrend between 00:00 and 01:00 UTC. Price moved inside an upward channel, rising from $0.00000909 to $0.00000925. MACD showed a golden cross, and RSI moved out of oversold, giving the price an early lift. However, this upmove was short-lived. A sharp drop followed just after 01:00 UTC, and the PEPE price fell to $0.00000911 by 01:30 UTC.
From 01:30 to 04:00 UTC, the price entered a sideways trading range between $0.00000911 and $0.00000930. During this time, PEPE made small dips and recoveries. Two golden crosses hinted at a possible bounce, but the PEPE price couldn’t push higher. Around 04:00 UTC, MACD showed a death cross, which triggered the next down move.

Chart 16- PEPE/USDT M1 Chart, Analysed By Anushri Varshney, Published on TradingView, June 27, 2025
Between 04:00 and 06:00 UTC, the PEPE trend turned bearish. A downward channel formed as the price dropped from $0.00000926 to $0.00000908. RSI dropped into oversold again and again, while MACD showed two quick death crosses, confirming the downtrend. This marked the lowest point of the session.
PEPE Breakout Hits $0.00000934, Faces Strong Wall at $0.00000935
From 06:00 to 07:00 UTC, the market shifted direction. A strong bounce created a sharp PEPE breakout from the downward channel. Price quickly recovered to $0.00000930. This move came with a fresh golden cross on MACD and RSI climbing out of the oversold zone. Buyers stepped in, but the momentum didn’t last long. Then, between 07:00 and 08:00 UTC, sellers returned. The price fell again through a tight downward channel, dropping to $0.00000913.
From 08:00 to 09:30 UTC, the PEPE price reversed again in an upward channel. Price climbed to $0.00000934. This was supported by an oversold RSI trigger and multiple golden crosses on MACD. But the PEPE price couldn’t break above $0.00000935, where it met strong resistance again. After 09:30 UTC, the trend slowed down. The PEPE price stayed inside a tight range from $0.00000926 to $0.00000934. MACD signaled a mild golden cross, but no breakout followed.
PEPE Awaits a Confirmed Breakout After Choppy Movements
The PEPE price stayed highly reactive to technical triggers but lacked follow-through beyond key levels. PEPE moved up and down with help from golden crosses and RSI signals, but none of the trends lasted. Resistance near $0.00000935 held firm, rejecting multiple rallies, while support at $0.00000908 remained intact during sharp dips.
Momentum indicators like MACD and RSI suggested buyer attempts, but frequent death crosses and oversold RSI showed that the price had trouble holding gains. Without a decisive break, the current zone continues to trap the price within a sideways structure. A strong PEPE breakout above $0.00000935 or below $0.00000908 is now needed to define the next short-term direction. Until then, the PEPE trend stayed unclear, and the market kept reacting without a strong direction.
PEPE Price Analysis For July 2, 2025
The PEPE price analysis shows a structured blend of consolidation, trend movement, and repeated indicator signals. The day opened with PEPE trading near $0.00000956. Price action between 00:00 and 02:00 UTC remained flat inside a defined trading range. During this phase, the MACD showed low momentum, while the RSI touched oversold territory briefly, hinting at incoming demand.
At 02:15 UTC, a mild downtrend emerged. PEPE price began forming lower highs and dipped closer to $0.00000947. However, this weakness didn’t last long. By 03:00 UTC, a golden cross appeared on the MACD, signaling early bullish momentum. The RSI also began rising, moving from near-oversold to neutral levels. This triggered the start of a gradual recovery phase. From 03:30 UTC onward, the PEPE trend shifted into a clean upward channel. Price action between 03:30 and 06:00 UTC showed consistently higher highs and higher lows.

Chart 17- PEPE/USDT M1 Chart, Analysed By Anushri Varshney, Published on TradingView, July 2, 2025
The MACD witnessed alternating golden and death crosses, indicating brief but frequent shifts in momentum. Still, the overall movement remained bullish. During this phase, the RSI pushed into overbought territory multiple times, especially around 04:30 and 05:15 UTC, reinforcing strong buying pressure. The peak of the upward momentum came around 06:15 UTC, where PEPE touched intraday highs near $0.00000966. Following this, the price faced mild exhaustion and began pulling back slightly. From 06:30 to 07:30 UTC, the MACD flashed death crosses twice.
PEPE Trades Sideways Between $0.00000950–$0.00000958, Closes at $0.00000955
Between 07:45 and 10:30 UTC, the PEPE price returned to a stable trading range. It hovered between $0.00000950 and $0.00000958. Volume thinned during this phase, and both RSI and MACD showed neutral patterns. A golden cross appeared on the MACD near 08:30 UTC, but follow-through was limited. The RSI floated around 59–63 toward the end, suggesting a slight bullish bias without strong conviction. Overall, the PEPE breakout during the upward channel was the most notable event in the 24-hour cycle. However, the final hours have lacked continuity. The current price of $0.00000955 shows minimal change from the start, reflecting market indecision. As of now, indicators lean slightly bullish, but another decisive move is needed to confirm the next PEPE trend
PEPE Holds Ground After Midday Breakout
The PEPE price remained flat after a well-defined breakout in the mid-session. A rangebound and low volatility session remained indecisive until near the end of the session. After a short lived down trend from 02:15 UTC to 03:00 UTC, lower support at around $0.00000947 was tested but buyers quickly propped the price up. The PEPE breakout that had the sharpest move occurred from 03:45 UTC to 06:15 UTC as price climbed steeply and steadily in an upward channel towards $0.00000966 with supporting golden crosses on the MACD and repeated overbought signals on the RSI.
After that breakout, momentum faded and the rest of the session is where we start to unravel. By the time we hit 07:30 UTC the PEPE trend began to go sideways and we remained in a very narrow range up to close. The indicators remained mixed and confirm there is no real bias developing in PEPE late in the day, and although I feel the PEPE price is holding our support now, to confirm the trend and continue the move, we will need some consolidation pattern breaking us and our resistance of $0.00000966.


