

Are you looking to invest in Pi and have been closely watching the price charts? Then, you are in the right place. Let’s take a look at the latest Pi price action and see what technical indicators suggest about possible scenarios for Pi Network. The famous community-based coin has had a rocky journey so far. With massive token unlocks and Mainnet upgrades still to come, let’s take a detailed look at how the Pi Network progresses.
Pi Price Analysis for May 1, 2025
Pi has been host to severe fluctuations in the past 24 hours. Amidst range-bound consolidations, a 12.5% spike was observed on the chart yesterday. A correction did occur, but Pi could hold on to the gains, posting a 6% rise from its price 24 hours ago. This bullish movement has also boosted 24-H trading volume by 19% according to CoinMarketCap data. Although Pi Network faces constant scrutiny due to the massive token unlocks and mainnet issues, the action in the last 24 hours has shown immense promise for the coming days. The day started with gradual trend-based movements and has stabilized at a higher level.
Pi commenced the trading session at $0.5755, continuing the uptrend from the previous day. This uptrend led the price to $0.5899. The RSI also rose and seemed to stabilize near the overbought level. At 1:40 UTC, a death cross formed, and some correction was seen. The price dropped to $0.5805. The Pi price continued to display range-bound behavior yesterday until morning. At 7:00 UTC, the price stood at $0.5860. A bearish Pi trend formed, as a mild downturn ensued. Half an hour later, at 7:35 UTC, it was supported by a death cross on the MACD indicator. The price eventually touched $0.5746 before staging a reversal to $0.5833 by noon.

PI/USDT Chart, analyzed by raodevansh18, published on TradingView, May 1, 2025
Pi Experiences Massive Growth in the Second Half
At the stroke of noon, a sizable death cross emerged on the MACD, and a downturn occurred. This downtrend led the Pi price to $0.5600, marking its 24H low. Quite aptly, the RSI also dipped into the oversold region at this point, prompting a quick Pi trend reversal. This reversal led the price up to $0.5770 by 15:45 UTC. A death cross followed later, but Pi resisted the downtrend with an elaborate trading range. The trading range continued till 19:40.
At 19:40, a wide golden cross formed on the MACD, and a momentous 12.5% spike followed. This spike took the price to $0.6485 from $0.5775. With the RSI rightly overbought, a sharp correction followed for Pi. This retracement led to Pi finding support at $.6040. The bearish pressure seemed to be cooling off, and Pi started ascending again. But another death cross at 22:25 UTC sealed a pullback as Pi settled at $0.6140.
PI Coin Tests Major Support Level at $0.6040
Today began with some bullish action for Pi, thanks to the early golden cross. The Pi price scaled to $0.6380, but a stiff ceiling was found at $0.6385. The RSI also soared into near-overbought levels, calling for a strong reversal. The 1:50 golden cross spawned a downtrend, taking Pi to $0.6070. It is worth noting that Pi has not touched the support level yet. It has found some consolidation. At the time of writing, it trades near the $0.6100 mark.
What Are the Possible Scenarios for Pi Coin?
Pi has been able to retain its gains in the past 24 hours. Even after the massive spike, Pi stabilized soon and trades higher. The RSI has been effective in identifying key price movements. However, this morning, it is tipping towards the bearish side. This can also be deduced from the fact that a golden cross at 6:20 UTC has done just enough to avoid downturns, failing to push the Pi price up. A test of the $0.604 support may be imminent. If the support holds, the bulls may try to enter the market and vie for a resistance test. If the bearish pressure persists, a support breach is quite probable.
Pi Price Analysis for May 5, 2025
Pi has been showing heavily range-bound behavior. Some early bullish movements were seen in the last 24 hours, but appropriate, timely corrections have ensured that the bullish phase was short-lived. The Pi price stood at $0.5830 as the trading session commenced. Thanks to the golden cross right at midnight, an early bullish trend formed, and Pi was seen climbing confidently. By 2:00 UTC, the price touched $0.5880. The golden cross seemed to be heading towards a bearish convergence when it widened again, causing a spike in the Pi price.
The ensuing Pi breakout led the price to $0.5987 within 5 minutes. This bullish spike faced a strong correction as Pi returned to $0.5882. However, the RSI continued to trend above the midline, leading to more upticks for Pi Coin. Although fluctuations were seen, by 4:15 UTC, the Pi price made its way to $0.5961. At this point, another massive golden cross formed, leading to another upward Pi breakout. The spike that followed led Pi to $0.6104 in the following half an hour. The RSI too soared into the overbought zone with the abrupt rise in prices.

Chart : PI/USDT M-5 Chart, analyzed by raodevansh18, published on TradingView, May 5, 2025
Strong Downturns Follow Pi Price Spikes
A strong bullish crossover on the MACD confirmed the corrective phase as the price retraced slowly at first to $0.6028 by 05:45 UTC. However, the downtrend became more dramatic as the gap between the EMAs widened and Pi coin slumped to $0.5952 by 6:00 UTC. Some respite was seen as the downtrend slowed down, but it persisted to take the price as low as $0.5882, very close to the initial level. The RSI also dipped to near-oversold levels at this point, sparking hopes of an uptrend. However, the uptrend found a strong ceiling at $0.5946. Soon, it returned to $0.5892 by noon.
Pi coin attempted another bullish trend, but could only go as far as $0.5953. Soon, a trading range followed, as the price consolidated around the $0.595 mark. A downward Pi breakout followed, as the bears took the price down to $0.5860, marking the lowest in the last 24 hours. The price soon returned to $0.5940, but failed to scale further. It tested the $0.5940 resistance repeatedly in the hours that followed. At 20:00 UTC, Pi tested the resistance for the last time and slowly retraced to $0.5890 by midnight.
Pi Trends Upward to Test Resistance Today
A modest uptrend had formed late on the previous day, and the Pi price continued on it to test the $0.5940 resistance again. The initial test failed, and Pi Coin soon retraced to the support level again. Since then, Pi has been on a slow and stable uptrend, veering closer to the $0.5940 resistance. As of now, the RSI is working just above the midline. However, the slow uptrend points to low buying volume as of now, even though the trend is bullish.
Technical Indicators Suggest More Consolidation, Upward Breakout Unlikely
The RSI is well within the 30-70 range as of now. The MACD indicator also suggests slight bullish pressure with a narrow golden cross. The lack of trading volume from both bulls and bears shows market indecision as Pi fluctuates between these two stiff boundaries. A decisive Pi breakout combined with strong buying volume could lead to Pi consolidating at higher levels, perhaps a bit closer to $0.605. However, if the support is breached from here, further downsides may follow quickly.
Pi Network (Pi) Price Analysis for May 9, 2025
Pi Coin has experienced a confident, slow rise in the past 24 hours. The coin has gradually ascended without facing any substantial resistance. Any bearish reversals have lacked strength, and modest uptrends have formed, leading to remarkable gains for Pi. The Pi price stood at $0.5825 at the beginning of the trading session. Right after midnight, a strong bullish trend was seen with the golden cross on the MACD indicator. The price started ascending, going to $0.6189 by 2:00 UTC. Some stabilization was seen, but the price rose to $0.6482 by 3:50 UTC.

PI/USDT, M-5 Chart, analyzed by raodevansh18, published on TradingView, May 9, 2025
The first meaningful reversal of the day came at this point, corroborated by the RSI’s extended foray into the overbought region. A death cross formed on the MACD, and the Pi price retraced to $0.6197 by 4:40 UTC. As the EMAs moved towards convergence, a trading range formed as the Pi Coin avoided further downturns. A bullish trend ensued at 6:45 UTC, and an upward Pi breakout was forming. However, correction arrived again with a MACD death cross, and the price went on to test the $0.6160 support level by 11:10 UTC.
Pi Mounts Bullish Pressure, Rises Slightly by Midnight
At 11:20 UTC, the bullish pressure was reignited with a golden cross, and a modest uptrend followed. This uptrend, although slow and consolidatory at times, led the Pi price up to $0.6325 by 15:45. Another phase of range-behaviour followed till 18:40 UTC, when Pi mustered an upward breakout and veered up to face rejection at $0.6460. A slight reversal followed, but Pi tested the resistance again by 21:00 UTC. This test failed too, and the Pi price retraced to $0.6325. A slow uptrend followed, going into the midnight. By 00:00 UTC, Pi Coin traded at $0.6460, on the verge of breaking the resistance.
Pi Ascends Rapidly, Faces Correction on the Verge of $0.8
The golden cross from the previous day widened dramatically at midnight today. The price spiked up to $0.6580 within the first five minutes, and formed a sharp uptrend to $0.6996 by 1:30 UTC. The RSI reported heavily overbought conditions at this point, prompting a strong reversal. A death cross did form at 1:50 UTC, and investors expected a major downturn. However, the bears could only pull the price down to $0.6708. A trading range formed again, as neither the bears nor the bulls could push a decisive Pi breakout.
At 3:45 UTC, it seemed like a downward break was on the cards. However, Pi Coin found renewed bullish strength with the 4:15 UTC golden cross. The 12-day EMA outpaced the 26-day EMA considerably, and more rapid growth followed. The price breached $0.7800 by 7:25 UTC, registering a weeks-long high. However, this time the overbought conditions ignited a considerable bearish trend, with Pi retracing to $0.7192 in a downward channel. Since then, Pi has again found a bullish reversal, and as of the latest update, stands at $0.7541.
Price Rally May Continue for a While More, $0.8 Key Resistance
As of now, the Pi price looks to be riding on sustained bullish pressure again. However, it will take much more work from the bulls to record a breakout above the $0.78 level. That is a probable outcome for today. If $0.78 is conquered, Pi’s next target will be the $0.80 valuation. The bulls have thrived in the last 24 hours. The psychological resistance at $0.80 will be critical. If the bulls fail, the sellers may regain control and introduce strict corrections to the Pi Coin price. As of now, a decisive breakout above Pi will dictate the oncoming moves.
Pi Network (Pi) Price Analysis for May 13, 2025
Pi coin enjoyed heightened bullish pressure in the early hours of the last 24 hours. It tested the key resistance at $1.670. However, the bears regained control at this point, and the rejection led to an extended bearish trend forming. The Pi price soon fell to critical support levels and has been confined to a narrow range ever since. The price stood at $1.1085 as trading began yesterday. Early bullish pressure drove the price up to $1.3075. This uptrend was also validated by the 00:25 UTC golden cross. However, the price could not move further up, with the RSI also indicating overbought conditions. A death cross formed, but instead of declining, Pi Coin formed a trading session, avoiding any downturns.
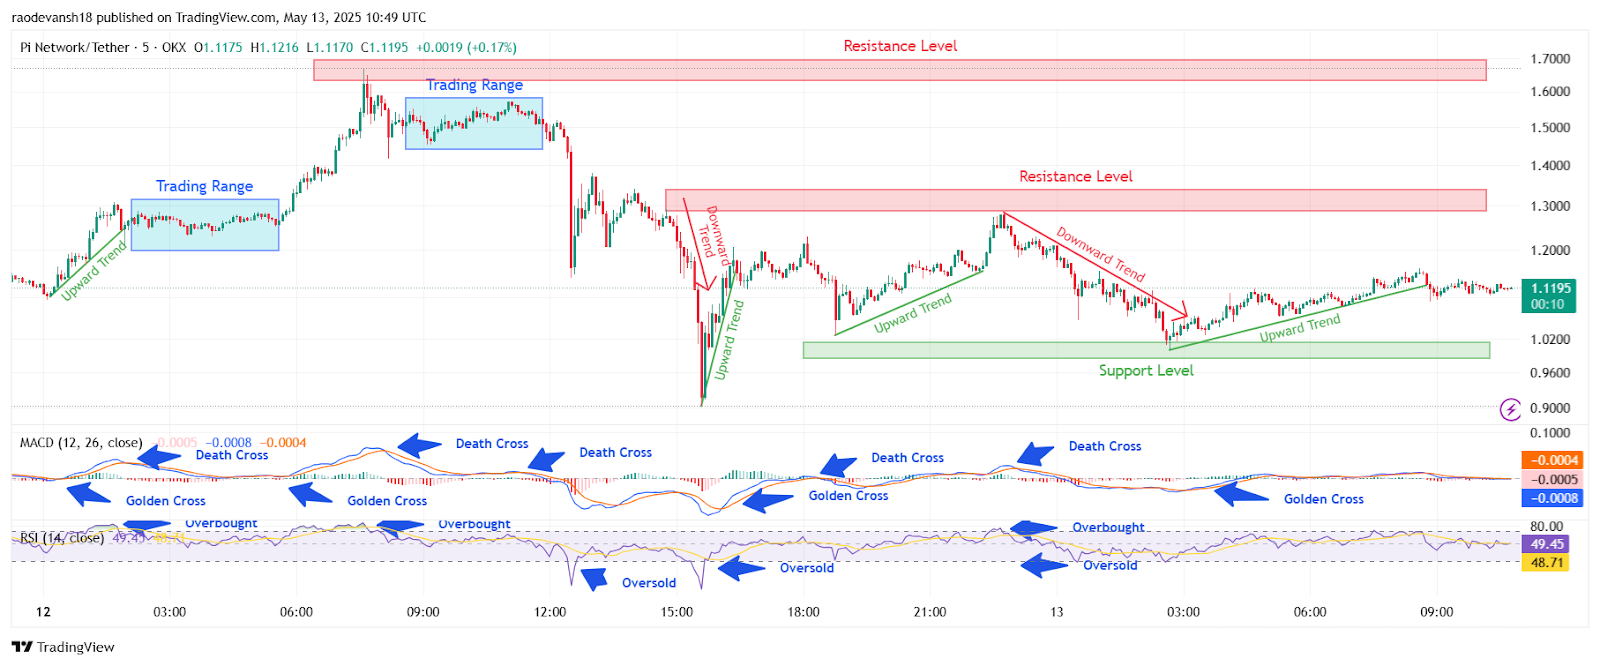
PI/USDT, analyzed by raodevansh18, published on TradingView, May 13, 2025
This trading range lasted till 05:35 UTC in the morning. At the same time, a golden cross emerged on the MACD indicator, and the price moved upward. An upward Pi breakout ensued, leading the price up rapidly. The price went up to $1.670. The RSI again signalled overbought conditions, and the price failed to rise further. A retracement came in with the death crosses at 08:05 UTC, and the price retraced to $1.4730. The bulls persevered as Pi Coin again avoided a serious downturn with a narrow trading range. However, the bullish pressure ran out soon. At 11:50 UTC, a death cross formed on the MACD. A few minutes later, the Pi Coin price plunged significantly, going down to $1.450. The RSI also dipped into the oversold area right after noon.
Pi Network Falls Above 30%, Struggles to Find Support
The RSI spiked into the oversold region, helping Pi rise slightly, going to $1.3740 by 13:05 UTC. But the bears continued to exert pressure on the coin, and another death cross formed at 15:00 UTC. The Pi price fell again, rapidly going to $0.9050 by 15:35 UTC. The RSI went deep into the oversold territory once again, prompting a strong reversal. A strong reversal followed, and Pi retraced to $1.2145 by 18:00 UTC. Another death cross emerged five minutes later, and the price fell to $1.0275. By 18:45 UTC, the EMAs started converging, and bullish pressure ensued again, pushing the price up confidently. The Pi price went on to $1.2900. However, a strong rejection was seen at this level, and Pi went into a downtrend.
Pi Coin Falls, Establishes Support at $1.0120
The bearish pressure from yesterday reigned on the Pi price charts. The price was at $1.1780 by midnight. The downtrend continued, leading the price all the way down to $1.0006. The RSI was almost oversold at this point, warranting a potent reversal. The reversal came in with the 3:05 UTC golden cross. Riding on the slight bullish pressure, Pi Network formed a slow but stable uptrend, taking it to $1.1580. A slight correction was seen, but since Pi has been consolidating around the $1.200 level.
Can Pi Test the Resistance at $1.300 Soon?
As of now, Pi is stabilizing near the $1.200 level. The EMAs are also coinciding, suggesting market indecision. Given that, investors will wait for a confirmed Pi breakout above or below this level to decide their action plan. The market sentiment is also cautiously bearish, which means it will be easier for the bears to pull the Pi price down to test the support. If the buyers can muster some voluminous bullish strength, a successful resistance may ensue, although highly unlikely.
Pi Price Analysis for May 17, 2025
Pi Network has entered a turbulent consolidation phase as price volatility continues to impact short-term trading trends. The Pi price began the day at $0.8875, relatively unchanged from the previous session. While the broader pattern showed clear signs of a bearish continuation, recent indicators suggest a potential but cautious recovery.
Early on in the session, the Pi price fell to $0.8400. A wide-ranging trading range was seen right after, where Pi Network fluctuated between the $0.8400 support and the $0.8740 resistance zones with no clear directional push. However, at 10:45 UTC on the 16th, a notable upward Pi breakout out of the tight range was seen, pushing the Pi price toward the resistance zone at $0.9650 at 14:25 UTC. This upward push was met with strong resistance, and a sharp downward trend followed.
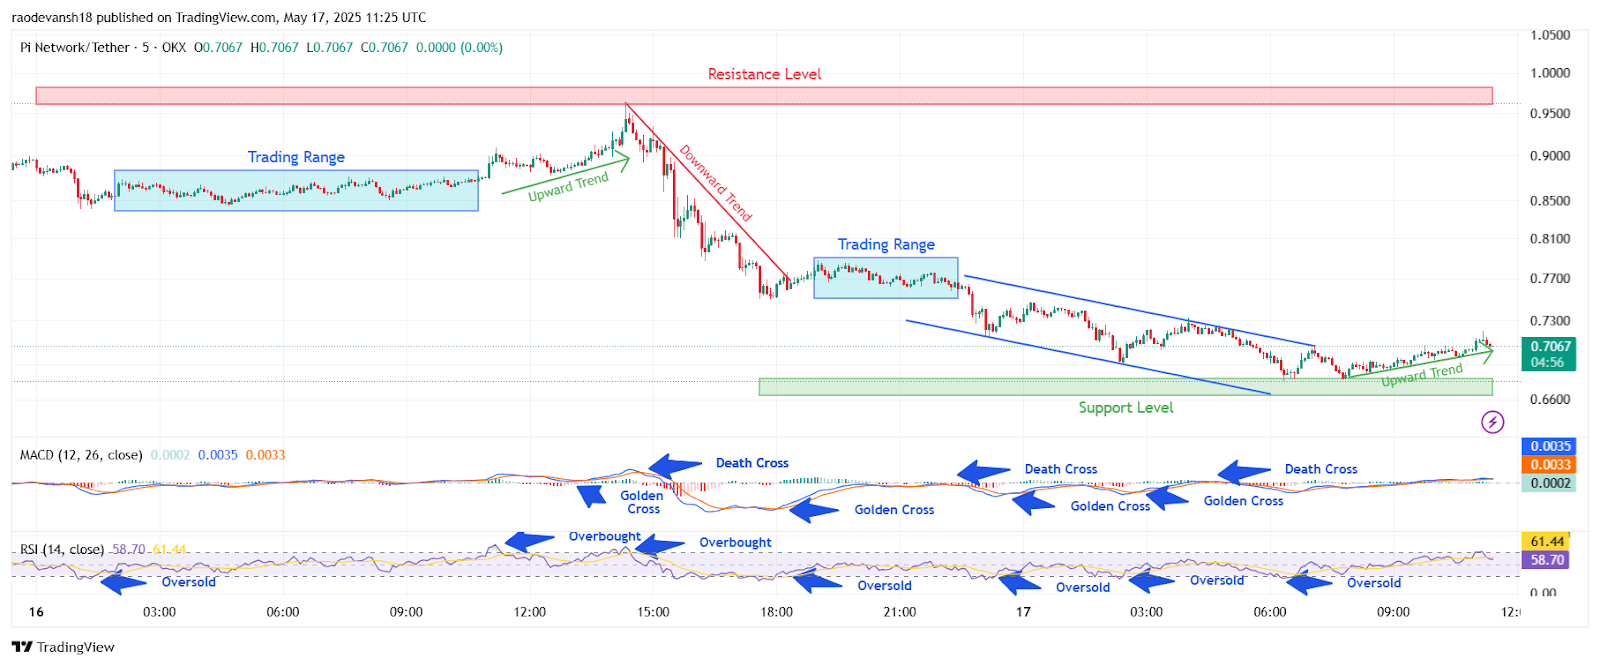
The selloff that ensued was fast and decisive, pulling the Pi price down sharply to $0.7510 by 18:00 UTC. MACD indicators confirmed the bearish momentum with a clear death cross, while RSI readings moved out of the overbought zone and began descending steadily. By 19:00 UTC, Pi Network found itself within a new trading range, fluctuating between $0.7510 and $0.7900. However, this range didn’t last long as continued bearish momentum led to another Pi breakout at 22:25 UTC, this time to the downside. By 00:00 UTC on May 17, the price reached $0.7292.
Strong Support Cushions Falling Pi Price
The downward channel from the previous day continued to push Pi Network down. The Pi price touched the support level marked around $0.6770 by 6:35 UTC on May 17. This level proved significant, acting as a bottom against further downside pressure. The RSI indicated multiple oversold readings, hinting at buyer interest in this range. Simultaneously, MACD lines began narrowing and eventually formed a golden cross, suggesting weakening bearish momentum.
This golden cross triggered a modest Pi breakout to the upside from the descending channel. The price trended upward from the $0.677 zone, supported by low but steady buying pressure. By 11:10 UTC, the Pi price had recovered to the $0.7160 region, signaling the beginning of a slow recovery phase.
However, it’s important to note that the recovery has yet to bring volume confirmations. The RSI currently hovers near the neutral 60 zone, while MACD continues to tread the line between bullish and bearish territory. This suggests that although bullish attempts are ongoing, they remain fragile and susceptible to reversal unless reinforced by volume spikes or strong macro indicators.
Technical Indicators Remain Mixed for Pi Network
The MACD currently shows a slight bullish edge with a minor golden cross, but the histogram bars remain nearly flat, reflecting indecision. RSI values are no longer oversold, resting above the midline, indicating neutral to mildly bullish sentiment.
While the Pi Network is recovering from recent lows, the price action still lacks decisive bullish conviction. Traders must closely monitor if the Pi price can break above the near-term resistance at $0.7300 to signal a stronger uptrend. A rejection at this level could send the price back toward the support band.
Currently, the Pi Network continues to trade in a cautious upward movement. A clearer trend direction will emerge only if the Pi price breaks key resistance or support zones with volume-backed momentum. Until then, the market is likely to remain range-bound with short-lived trends dominating the landscape.


