

Are you curious about the recent Peanut the Squirrel token (PNUT) price trend? This analysis breaks down the latest price swings and momentum shifts to help you understand what’s really going on. PNUT saw an impressive move up to $0.42 before sellers pushed it right back near a crucial support. If you’re thinking of trading or just want a clear view of the current trend, you’ll find everything you need here, from support levels to MACD and RSI signals.
PNUT Price Analysis of 10th May, 2025
The PNUT price action over the last 24 hours shows a continuation of bullish momentum early on, following the prior day’s uptrend. From 09:00 to 12:00 UTC, the price moved sideways around $0.2880, forming a narrow consolidation just above the support zone. MACD remained flat, while RSI hovered around mid-levels. A PNUT breakout occurred at 13:35 UTC, pushing price firmly above the $0.2880 support level. This initial surge was not driven by a major RSI spike or MACD signal, implying a price-led move. However, price remained supported in a tight sideways path through 15:00 UTC as traders awaited further momentum confirmation.
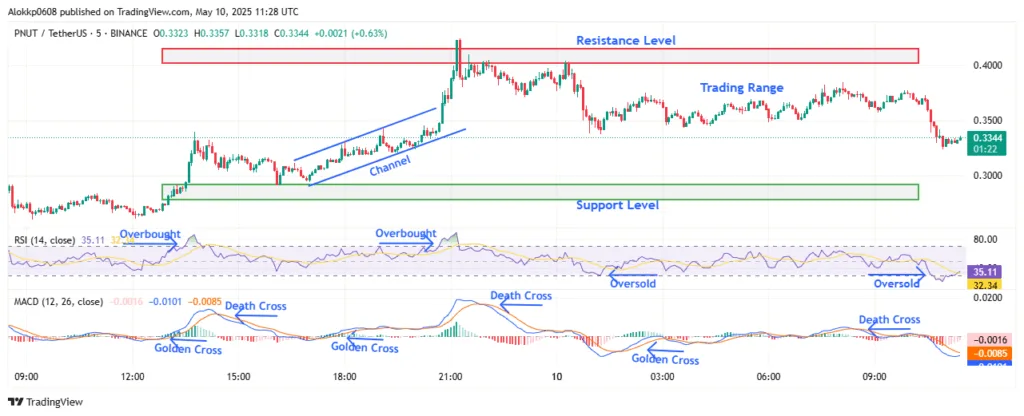
Chart 1- PNUT/USDT M5 Chart, Analyzed by Alokkp0608, published on May 10th, 2025.
From 15:00 to 18:00 UTC, PNUT entered a gradual uptrend channel and built momentum. The MACD showed a golden cross around 16:45 UTC, confirming bullish intent, while RSI climbed steadily, nearing overbought levels. This helped lift the PNUT price from $0.3060 to around $0.3450. The uptrend intensified heading into 18:00–21:00 UTC. By 20:45 UTC, a strong surge broke past the $0.3800 barrier, and RSI entered overbought territory, peaking around 76. MACD also rose strongly above the signal line, reinforcing the breakout conviction. The price spiked to a high of $0.4246 before facing rejection near the $0.4050 resistance level.
Failed PNUT Breakout Above Resistance, Shift into Sideways Movement
Between 21:00 UTC and 00:00 UTC, Peanut the Squirrel token struggled to sustain gains above the $0.4050 resistance. After briefly consolidating above this level, sellers regained control. The RSI sharply dropped out of the overbought zone, signaling exhaustion. Meanwhile, MACD showed a death cross around 23:00 UTC, confirming weakening momentum. Price fell to $0.3650 before stabilizing in a sideways range between $0.3600 and $0.3850. This range-trading phase marked a neutral shift after an intense rally and suggested short-term indecision among market participants awaiting clearer signals.
During the next session from 00:00 to 03:00 UTC, the Peanut the Squirrel token broke down from the prior range. A rapid decline pulled it to $0.3382 by 01:15 UTC, followed by mild support forming near $0.3400. RSI briefly dipped into oversold territory before recovering, indicating possible early bargain buying. MACD printed a golden cross again around 02:30 UTC, hinting at a possible short-term rebound. However, follow-through buying was weak, and price remained capped under $0.3500. This period showed a fading bounce attempt without enough strength to re-enter the earlier trading range.
Persistent Weakness Near Support as Sellers Return
From 03:00 to 06:00 UTC and again from 06:00 to 09:00 UTC, the PNUT price largely moved sideways between $0.3396 and $0.3470. Attempts to reclaim momentum failed as MACD crossed bearishly once more near 08:45 UTC. RSI stayed in the lower neutral zone, not showing recovery strength. Weak consolidation continued into the last visible 3-hour window ending around 11:30 UTC, where the price hovered near $0.3344. This marks a nearly full retracement of the earlier rally, placing PNUT back near its former breakout zone around $0.3300, with signs of seller dominance returning.
PNUT Price Bearish Reversal Puts Pressure Back Near Key Support
PNUT price appears to have completed a full bullish cycle followed by a breakdown and reversion toward support. The short-term trend has turned bearish, with fading momentum after the failed breakout above $0.4050. RSI has dropped from overbought to near oversold zones, currently showing weak recovery. MACD’s repeated bearish cross confirms sellers are gaining control. If price falls below $0.3300, the next support lies near $0.3100. On the upside, recovery must first clear $0.3500, followed by $0.3840 to rebuild bullish momentum. Overall outlook is tilted bearish unless key support holds and MACD regains a bullish crossover.
Peanut the Squirrel (PNUT) Price Analysis of May 28, 2025
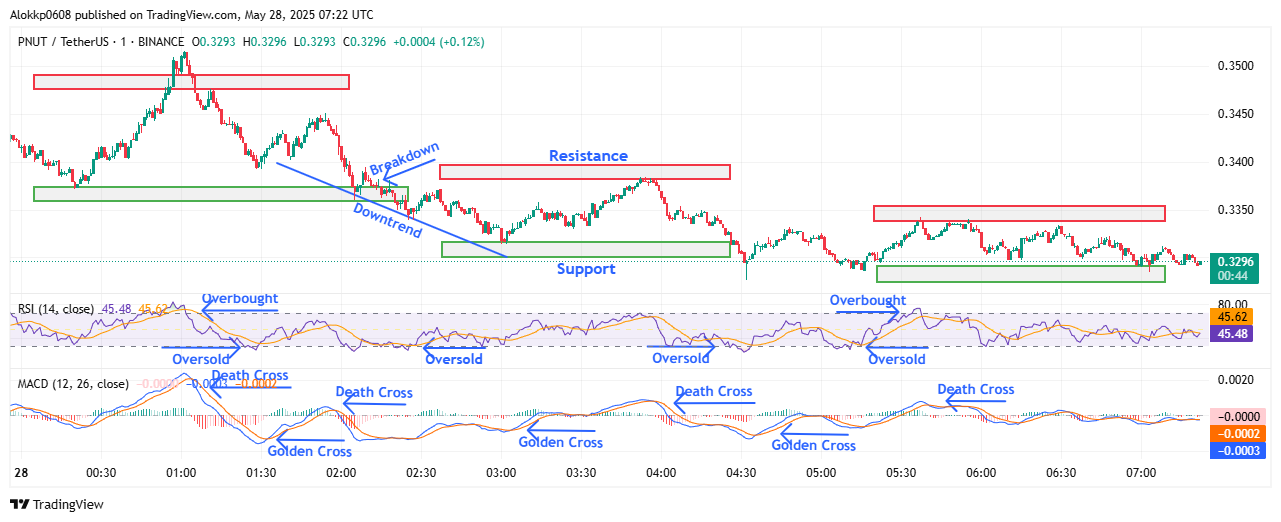
The PNUT price action today shows sharp shifts in structure and momentum. Price began near $0.3375, pushing into a short-lived uptrend that peaked at $0.3515 by 01:01 UTC, forming a Higher High (HH). This up-move aligned with a Golden Cross on the MACD and a brief RSI overbought signal. However, the rally lost steam quickly. A Lower High (LH) formed by 01:28 UTC near $0.3393, leading into a broader downtrend. From 01:04 to 02:15 UTC, a steep decline occurred, confirmed by a Death Cross on MACD and a return of RSI to neutral from overbought.
PNUT/USDT M-1 Chart, Analyzed by Alokkp0608, published on May 28th, 2025.
The breakdown intensified between 01:57 and 03:00 UTC, with price slicing through the initial support at $0.3375. A new Support Level emerged at $0.3315, marking a Lower Low (LL) by 03:00 UTC. MACD confirmed the bearish pressure with another Death Cross at 01:57 UTC. Though the RSI touched oversold territory twice in this span, buyers failed to generate a sustainable lift. A minor bounce near 03:03 UTC triggered a short rally into a newly defined Resistance Level at $0.3383. Yet, this proved short-lived, as the price hovered beneath the RL without a breakout.
Tight Range Holds as Bears Block Recovery
From 03:03 to 04:30 UTC, PNUT price moved within a tight uptrend channel, bounded by $0.3315 support and $0.3383 resistance. A Golden Cross on MACD at 03:03 UTC gave bulls some momentum, and RSI hovered near neutral, occasionally flirting with oversold. Price reached the RL again around 03:53 UTC but failed to produce a Higher High. A sharp rejection followed by 03:58 UTC, which lined up with another Death Cross on MACD. This cemented $0.3383 as a firm resistance level. The next slide drove price to a fresh SL of $0.3290 by 05:00 UTC, another Lower Low that shifted the broader structure into bearish continuation.
By 05:15 UTC, a fresh uptrend began as Peanut the Squirrel token rebounded from $0.3290. A Golden Cross on MACD supported this recovery, and RSI spiked toward overbought near 05:45 UTC. Still, the rally was capped by a new RL at $0.3340. The chart from 05:15 to 06:45 UTC shows Higher Lows (HLs) forming inside a narrow uptrend channel. However, there was no HH, signaling weakening bullish strength. The MACD rolled over again with a Death Cross at 05:41 UTC, confirming the shift. Price stayed pinned between $0.3290 and $0.3340, repeatedly testing both levels but without conviction. RSI swung from oversold to neutral, never gaining bullish momentum.
Fade Toward Lows as Momentum Drains
From 06:45 UTC to the close at 07:20 UTC, PNUT price faded slightly, with the price stalling near $0.3296. No Higher Highs or Lows formed, instead, the structure went flat inside a sideways path. The SL of $0.3290 held firm despite repeated tests. Resistance at $0.3340 remained untouched. MACD flattened, with the signal line and MACD line hugging closely, suggesting low momentum and no directional edge. RSI stabilized just under the midline, confirming the lack of breakout energy. Traders now face a tightening wedge of uncertainty with narrowing volatility and low conviction in either direction.
PNUT Price Stalls Near $0.3290 as Bulls Lose Grip
PNUT price is now stuck beneath layered resistance zones, with fading bullish effort. The short-term momentum is neutral-to-bearish, given the repeated failure to reclaim $0.3340 or print new highs. Key levels to watch are the Support Zone at $0.3290 and the Resistance Zone between $0.3340–$0.3383. The MACD shows flat-line behavior after a Death Cross, and RSI holds in the 45–50 range, both hinting at consolidation or further weakness. If the $0.3290 SL breaks down, PNUT could revisit deeper lows. Only a clear move above $0.3340 with volume and a MACD crossover would suggest momentum is returning.


