

Are you tracking POL price movements today? The Polygon token showed clear strength on May 22, 2025, starting with a bullish surge early in the session. After opening near $0.2465, the price climbed steadily, supported by strong momentum indicators like the MACD golden cross and RSI entering overbought territory. Mid-day consolidation formed a healthy trading range before a decisive breakout above $0.2505 pushed POL to a high of $0.2537. This price action highlights active buyer interest and suggests potential further upside if key support holds.
Polygon (POL) Price Analysis For May 22, 2025
The POL Price analysis shows a clear structure today with a strong start, mid-day consolidation, and a confirmed breakout followed by a steady upside. The trading day opened with bullish energy. The price climbed inside an upward channel from $0.2465 to $0.2500 by 01:15 UTC, supported by a golden cross on the MACD. RSI moved into the overbought zone, confirming strong momentum. This rally extended into a second push until 01:45 UTC, pushing the Polygon token to a local high near $0.2512 before cooling off.
By 02:00 UTC, the price entered a slower upward channel, between $0.2485 and $0.2510. MACD signaled another golden cross, while RSI hovered in neutral territory. The market soon shifted into a clear trading range from 02:30 to 06:45 UTC. During this time, the price fluctuated between $0.2465 and $0.2505.

Chart 1- POL/USDT M1 Chart, Analysed By Anushri Varshney, Published on TradingView, May 22, 2025
During the mid-session, smaller trend shifts emerged as the market looked for direction. At 03:30 UTC, confirmed by a death cross on MACD and RSI dipping below 40. However, bulls quickly returned around 04:00 UTC, and a sharp uptrend formed as the price bounced back. MACD flashed a golden cross again, but RSI remained below 60, showing limited momentum. Between 05:00 and 06:30 UTC, price action stayed sideways with no strong direction. Multiple golden and death crosses occurred on the MACD, while RSI moved in a tight band, indicating uncertainty.
POL Breakout Clears $0.2505 Resistance, Hits $0.2537 High
Finally, at 06:45 UTC, the market witnessed a strong POL breakout above the $0.2505 range top. This breakout was backed by strong volume, a golden cross, and RSI entering overbought levels again. From 07:00 to 08:00 UTC, the Polygon Token moved inside another upward channel, rallying to $0.2537.
After the peak, the price consolidated slightly but held above the $0.2505 breakout level. RSI pulled back from overbought, and MACD momentum slowed. During the final leg of the session, from 08:30 to 09:30 UTC, POL moved sideways between $0.2508 and $0.2520. MACD signaled a minor death cross, while RSI closed near 47, showing a pause in bullish momentum. From 08:00 to 09:30 UTC, POL hovered between 0.2508 and 0.2520 with decreasing volume. While momentum slowed, there was no major sell-off. This signaled that traders were holding positions rather than exiting aggressively.
POL Price After Breakout and Intraday Rally
The POL Price closed the day with a firm structure and bullish control. Early strength formed two upward channels, while the mid-session trading range between $0.2465 and $0.2505 suggested healthy consolidation. The key move came at 06:45 UTC when the POL breakout above $0.2505 triggered fresh momentum. The price rallied to a high of $0.2537 by 08:00 UTC, confirming bullish sentiment backed by a golden cross and RSI entering overbought. After the peak, the Polygon Token held above key support with minimal downside pressure, showing buyers were still active. RSI cooled without diving into weakness, and the MACD death cross near the end showed only a pause, not a reversal.
If the POL Price continues to hold above $0.2500, further upside toward $0.2545 remains possible. However, a drop below $0.2490 could shift the tone. For now, trend structure, breakout levels, and indicator alignment all suggest the bulls are still in control going into the next session.
Polygon (POL) Price Analysis For May 25, 2025
The POL Price analysis shows a clear shift in structure, led by sharp volatility and key intraday reversals. Price opened near $0.2325 and remained inside a tight trading range during the first 20 minutes. This sideways phase suggested indecision from both buyers and sellers. However, by 00:22 UTC, a clean POL breakout to the downside occurred, pushing the price rapidly toward $0.2275.
After the breakdown, the Polygon token entered a fresh trading range between $0.2268 and $0.2285. This range lasted until 01:00 UTC. MACD showed a death cross, and RSI dipped below 30, confirming an oversold condition. A golden cross followed, allowing bulls to lift the price slightly. By 01:10 UTC, the POL Price started climbing out of the range.
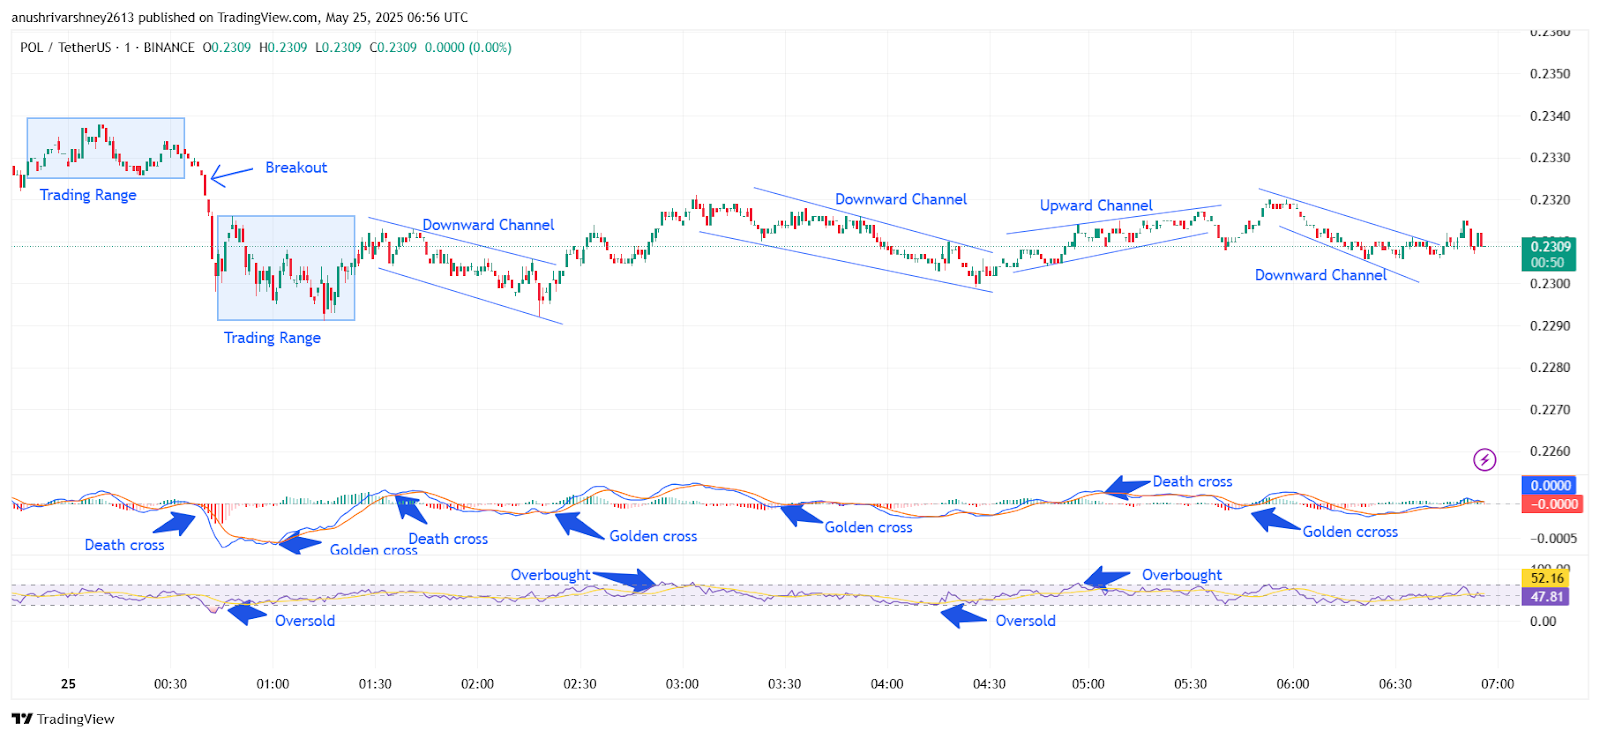
Chart 2- POL/USDT M1 Chart, Analysed By Anushri Varshney, Published on TradingView, May 25, 2025
Between 01:15 and 02:10 UTC, the price moved inside a downward channel, slowly declining toward $0.2275 again. A breakout came at 02:15 UTC, followed by a strong bullish push to $0.2312. The MACD flipped bullish with a golden cross, and RSI approached the 60 level, showing stronger momentum.
POL Price Rebounds from $0.2286 to $0.2328 Before Settling at $0.2309
From 02:30 to 03:40 UTC, a new downward channel formed again, dragging the price from $0.2310 back toward $0.2286. However, the selling pressure weakened near support. At 03:45 UTC, buyers stepped in again. A quick reversal took place, and POL Price entered an upward channel phase that lasted till 04:45 UTC. RSI touched the overbought zone, indicating a possible cooldown.
The high near $0.2328 around 04:50 UTC triggered another drop. The price slipped into a third downward channel, pulling back gradually toward $0.2295 by 05:30 UTC. MACD confirmed the weakness with another death cross, while RSI stayed near 50, signaling neutral sentiment. After 05:45 UTC, the price found stability and ranged between $0.2300 and $0.2310. A final golden cross on MACD occurred close to 06:15 UTC, giving the bulls a slight edge. By 07:00 UTC, the Polygon token was trading at $0.2309, holding steady after a day of range shifts and channel patterns.
POL Price Outlook Remains Neutral with Cautious Momentum
The POL Price closed the session near $0.2309 after a full day of mixed movement. The sharp POL breakout in the early hours set off a series of channel patterns and sideways ranges. While buyers did step in during key support zones, they struggled to break above $0.2328. Momentum indicators like the MACD showed repeated golden and death crosses, reflecting short bursts of trend shifts. RSI also moved between oversold and overbought, confirming buying and selling pressure. The Polygon token held steady above $0.2300 in the final hours, signaling a wait-and-watch approach from the market.
For now, $0.2328 remains a key level to watch on the upside, while $0.2270 acts as solid support below. Until a clear breakout or breakdown occurs, POL is likely to stay range-bound. Traders should keep an eye on volume and RSI signals for the next possible move.
Polygon (POL) Price Analysis For May 26, 2025
The POL Price analysis shows a clear sequence of sideways consolidation, channel breakdown, and a strong recovery phase into an upward trend. The price of the Polygon token opened the session at $0.2376 and remained flat inside a narrow trading range until around 00:20 UTC. Buyers slowly gained control, triggering the first upward channel. Between 00:20 and 01:00 UTC, the price climbed from $0.2362 to $0.2380. A MACD golden cross confirmed the start of the move, while RSI entered the overbought zone, showing strong momentum. After the rise, the price stalled and moved sideways inside a fresh trading range from 01:00 to 01:30 UTC. Price held between $0.2373 and $0.2380 with reduced volume.
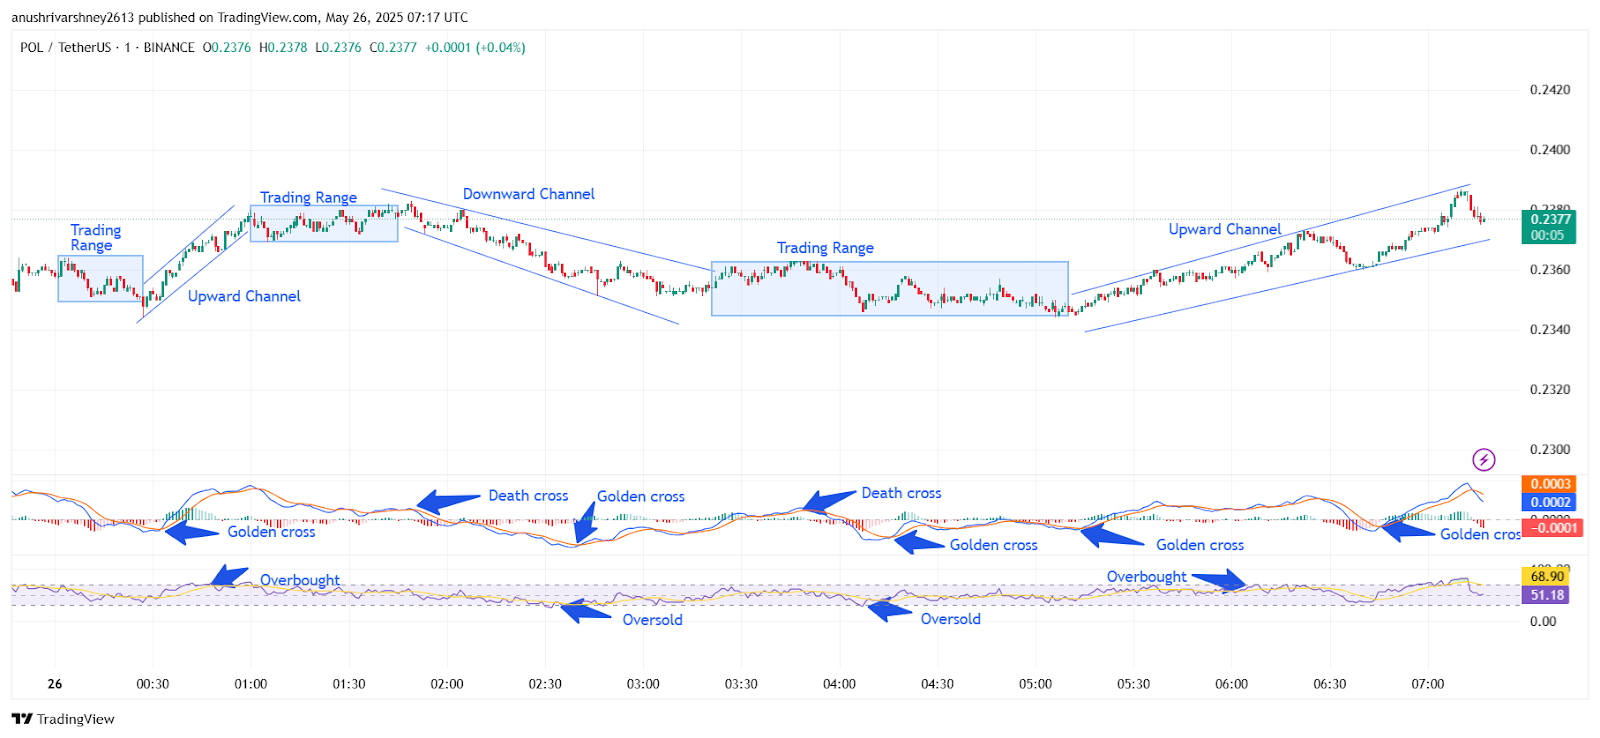
Chart 3- POL/USDT M1 Chart, Analysed By Anushri Varshney, Published on TradingView, May 26, 2025
By 01:30 UTC, selling pressure increases. A rejection from resistance pushed the price into a downward channel until 03:15 UTC. POL dropped from $0.2378 to a low of $0.2345. MACD flipped into a death cross near 02:00 UTC, while RSI hit oversold levels around 02:30 UTC. This confirmed weakness as sellers dominated.
POL Breakout Emerges as Price Rises from $0.2352 to $0.2389
From 03:15 UTC to around 05:00 UTC, the Polygon token shifted into another sideways phase. This quiet consolidation phase helped absorb earlier selling pressure and set the stage for the upward breakout after 05:00 UTC. This trading range held firm between $0.2345 and $0.2360. MACD signals remained mixed, with short-lived crosses showing indecision, while RSI held steady in neutral territory. RSI stayed neutral, bouncing slightly after the earlier oversold reading.
Momentum returned after 05:00 UTC, starting a clean upward channel. This was the key POL breakout event of the session. The price moved steadily from $0.2352 to $0.2389 by 07:00 UTC. The move was supported by multiple golden crosses on the MACD and another overbought signal on the RSI. This confirmed bullish control. The price pulled back slightly as the session closed, but remained inside the rising channel. The final candle at 07:17 UTC showed a print at $0.2377, holding above mid-range support.
POL Price Holds Channel Support After Breakout Recovery
The POL price closed the session with strength after reclaiming key levels during a steady upward channel. Following a clean POL breakout above $0.2350, the Polygon token regained short-term bullish momentum, supported by consistent golden crosses and overbought RSI signals. The upward channel remains intact, and the price is still holding above mid-range support at $0.2360. This suggests that buyers are still in control. The MACD continues to show positive divergence, while RSI is cooling down from overbought territory.
As long as the price stays above the $0.2345–$0.2360 zone, a retest of $0.2390 remains likely. A breakout above that resistance could open a path toward new highs. However, if the price fails to hold the channel support, a pullback toward $0.2340 may follow. For now, the POL price maintains a bullish bias, and traders should watch for volume spikes and RSI trends to confirm the next direction.
Polygon (POL) Price Analysis For May 31, 2025
The POL Price analysis shows a strong recovery after an early dip, forming a clean upward structure with signs of a steady POL breakout. The day began with sharp selling pressure, as the POL price dropped from around $0.2070 into a downward channel that bottomed near $0.1980 around 00:45 UTC. This drop triggered a brief oversold RSI reading below 30, hinting that sellers had overextended. Soon after, the price stabilized, and POL entered a sideways trading range between $0.1985 and $0.2010, lasting until roughly 01:50 UTC.
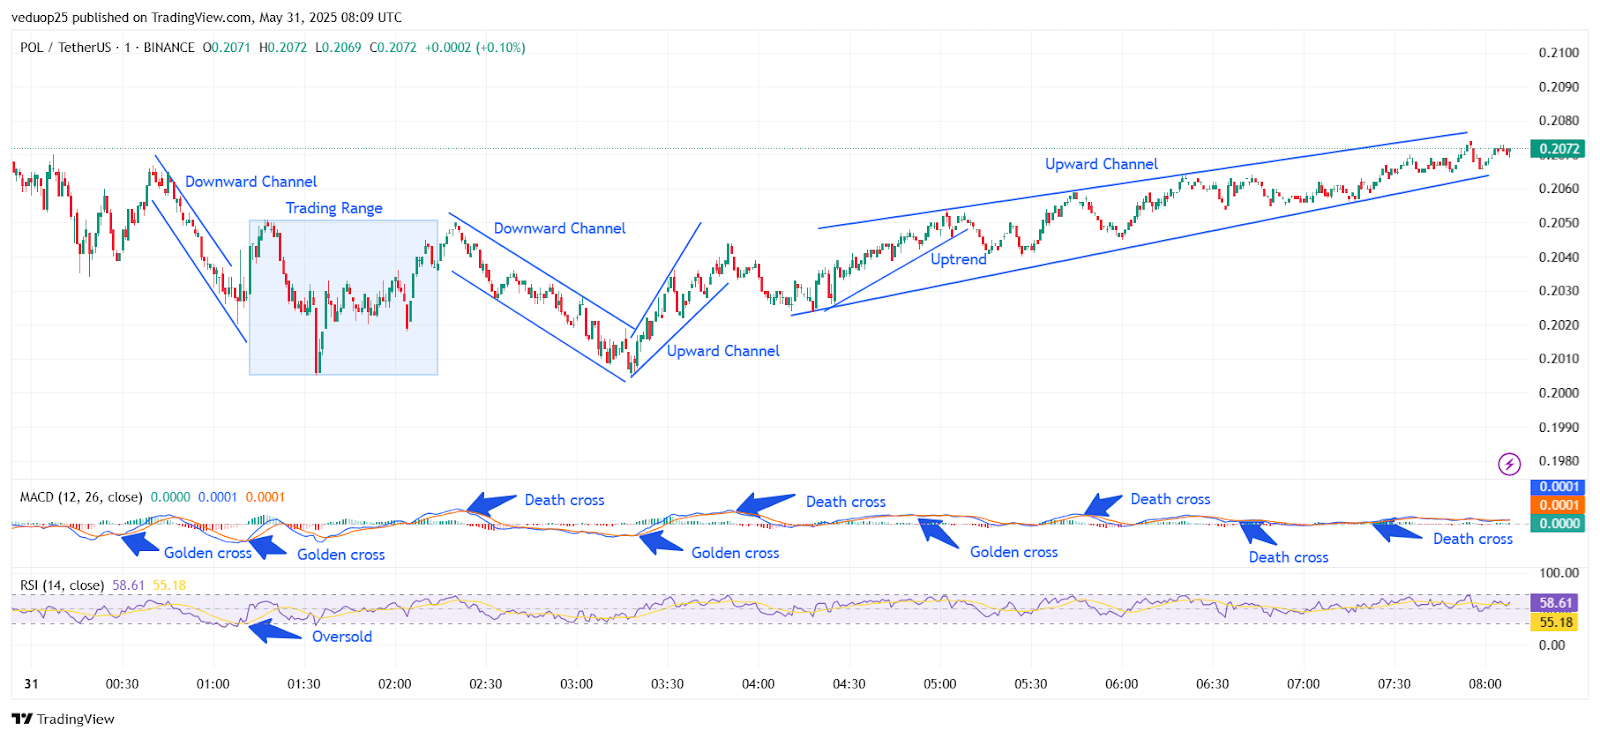
Chart 4- POL/USDT M1 Chart, Analysed By Anushri Varshney, Published on TradingView, May 31, 2025
During this consolidation, the MACD flashed two golden crosses, giving early signs of a shift in momentum. Around 02:00 UTC, the Polygon token began pushing upward again but was met with another brief downward channel that lasted until about 03:00 UTC, testing the $0.1980 support once more.
POL Breaks Out and Climbs Toward $0.2075
By 03:15 UTC, POL price broke out of the downtrend and entered an upward channel, reclaiming $0.2020. The MACD crossed bullishly again, and the RSI climbed above 50 for the first time in hours, confirming building strength behind the POL breakout. Between 04:00 and 05:00 UTC, POL formed a tighter uptrend pattern, steadily printing higher highs and higher lows. The price ranged from $0.2030 to $0.2055 during this leg, with RSI holding firm, showing healthy bullish momentum without entering overbought zones.
From 05:30 UTC onward, the price began moving within a broader upward channel, grinding higher toward the $0.2075 region. While the MACD gave mixed signals with repeated golden and death crosses, there was no major shift in direction.
POL Price Eyes Breakout as Bullish Channel Holds Above $0.2055
The overall price action for POL shows a clear transition from bearish pressure to a steadily building uptrend, with the Polygon token gaining ground throughout the day. After reclaiming support near $0.1980 and forming a clean upward channel, the POL price now trades confidently above $0.2070.
As long as POL holds above the $0.2055 channel support, the bullish structure remains intact. A confirmed breakout above $0.2080 could open the door for higher levels, potentially extending toward $0.2100 in the near term. On the downside, failure to hold the channel base may trigger a pullback toward $0.2030. Overall, the trend favors bulls, and the market will be watching closely to see if the POL breakout confirms in the next sessions.
Polygon (POL) Price Analysis For June 8, 2025
The POL price analysis shows a clean and structured trend marked by three downward channels and a short-lived uptrend. The price moved with defined momentum shifts confirmed by RSI and MACD throughout the day. The session opened near $0.2108 and followed a sequence of bearish waves with intraday recoveries.
By 01:30 UTC, POL moved inside a tight downward channel. The price dropped from $0.2108 to $0.2094. During this time, RSI dipped below 30, signaling an oversold condition. MACD also formed a golden cross around 01:15 UTC; soon after, a small recovery began.
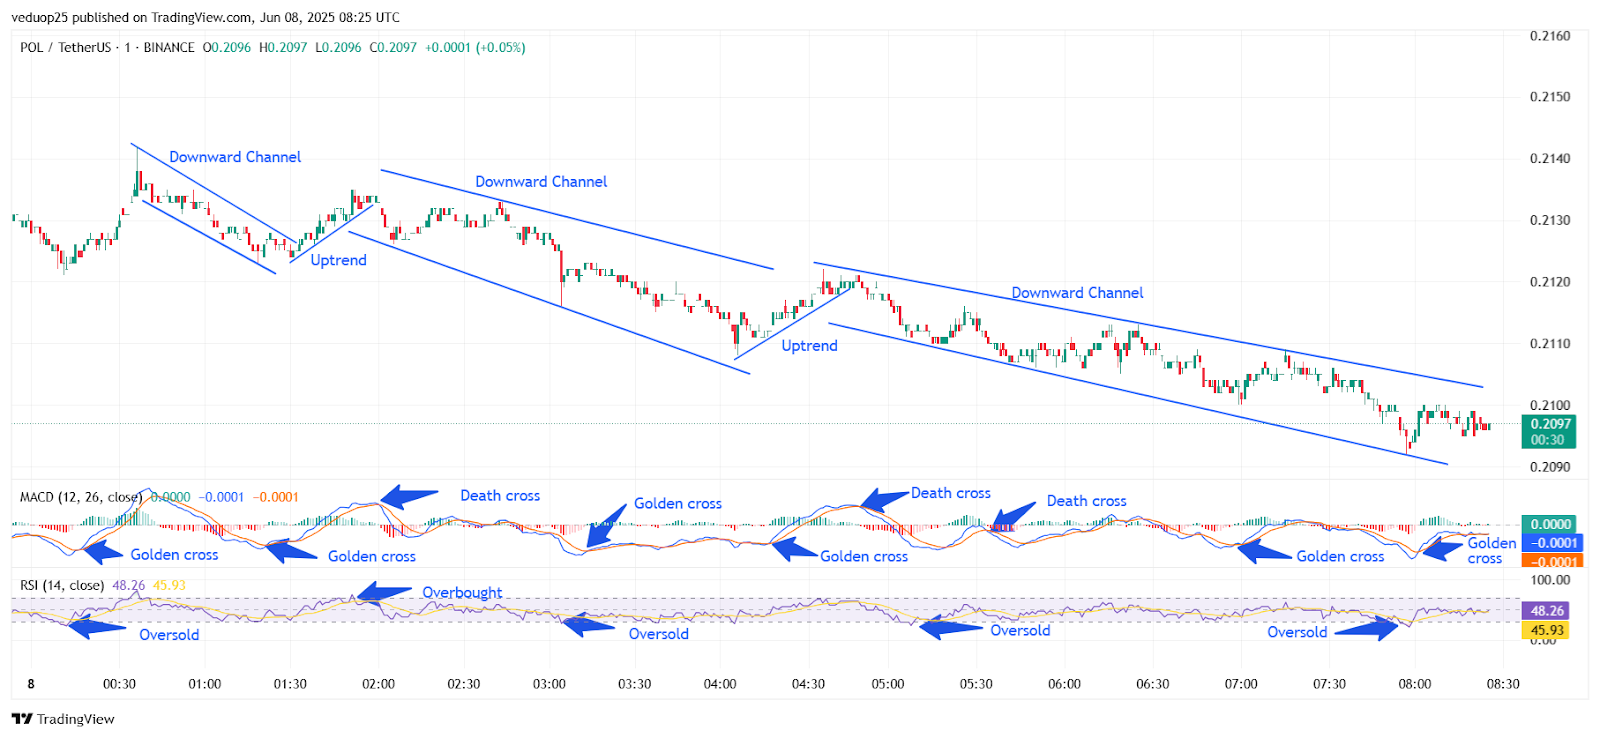
Chart 5- POL/USDT M1 Chart, Analysed By Anushri Varshney, Published on TradingView, June 8, 2025
Between 01:30 and 02:30 UTC, the first POL breakout happened. The price climbed back to $0.2106, riding a quick uptrend. RSI crossed above 50, while MACD confirmed momentum with another golden cross. However, this strength didn’t hold. From 02:30 to 03:30 UTC, POL entered a second downward channel. Price slid back to $0.2092. A death cross formed on the MACD, and RSI hovered below the neutral line, showing weakening strength. Just after 03:30 UTC, the Polygon token regained ground with another short uptrend, lifting the price to $0.2114 by 04:30 UTC.
Bearish Drift Followed by Sideways Pause Below $0.2106
From 04:30 to 06:30 UTC, the trend reversed again. A wide downward channel pulled the price lower, from $0.2114 to $0.2100. RSI briefly touched the oversold zone near 06:00 UTC, and MACD printed two death crosses during this stretch. A mild recovery came between 06:30 and 07:30 UTC, with POL price bouncing slightly to $0.2106.
RSI returned to 50, and MACD showed a small golden cross. The final downward channel began after 07:30 UTC and lasted until 08:30 UTC, bringing the price back to $0.2097. From 08:30 to 23:59 UTC, POL traded sideways inside a narrowing range between $0.2095 and $0.2100. MACD stayed flat with minor golden and death crosses. RSI hovered around 45, suggesting a neutral sentiment for the rest of the session.
Cautious Outlook as POL Price Stays Range-Bound
The POL price closed the day slightly lower, showing consistent weakness despite three short-term recoveries. Each POL breakout lifted the price briefly, but none held above resistance. MACD signals, especially the golden and death crosses, matched each turn closely, while RSI repeatedly dipped into the oversold zone, confirming pressure on the Polygon token. The overall trend stayed inside a bearish structure, with the price respecting downward channel boundaries across all key phases. Resistance near $0.2114 remained untouched after multiple retests, while $0.2090 was a reliable support line.
Currently, the indicators suggest indecision, with the MACD flat and the RSInear neutral. For a clear reversal, the POL price needs to break above its short-term downtrend and sustain above $0.2115 with volume. Until then, buyers should remain cautious. Sideways action or another dip is possible if sentiment weakens. Watch key support levels closely in the coming sessions.
Polygon (POL) Price Analysis of June 11, 2025
The POL price analysis reveals a combination of volatility and structure, characterized by two major downtrends, followed by a strong POL breakout and consolidation near key resistance levels. The Polygon token opened the session trading around $0.2260 before entering a steep downtrend from 00:15 UTC. Price steadily fell inside a clear downward channel, making lower highs and lower lows until 01:45 UTC. During this phase, RSI dipped into oversold territory near 30, and MACD printed a golden cross shortly after 01:00 UTC, an early signal of a potential shift.
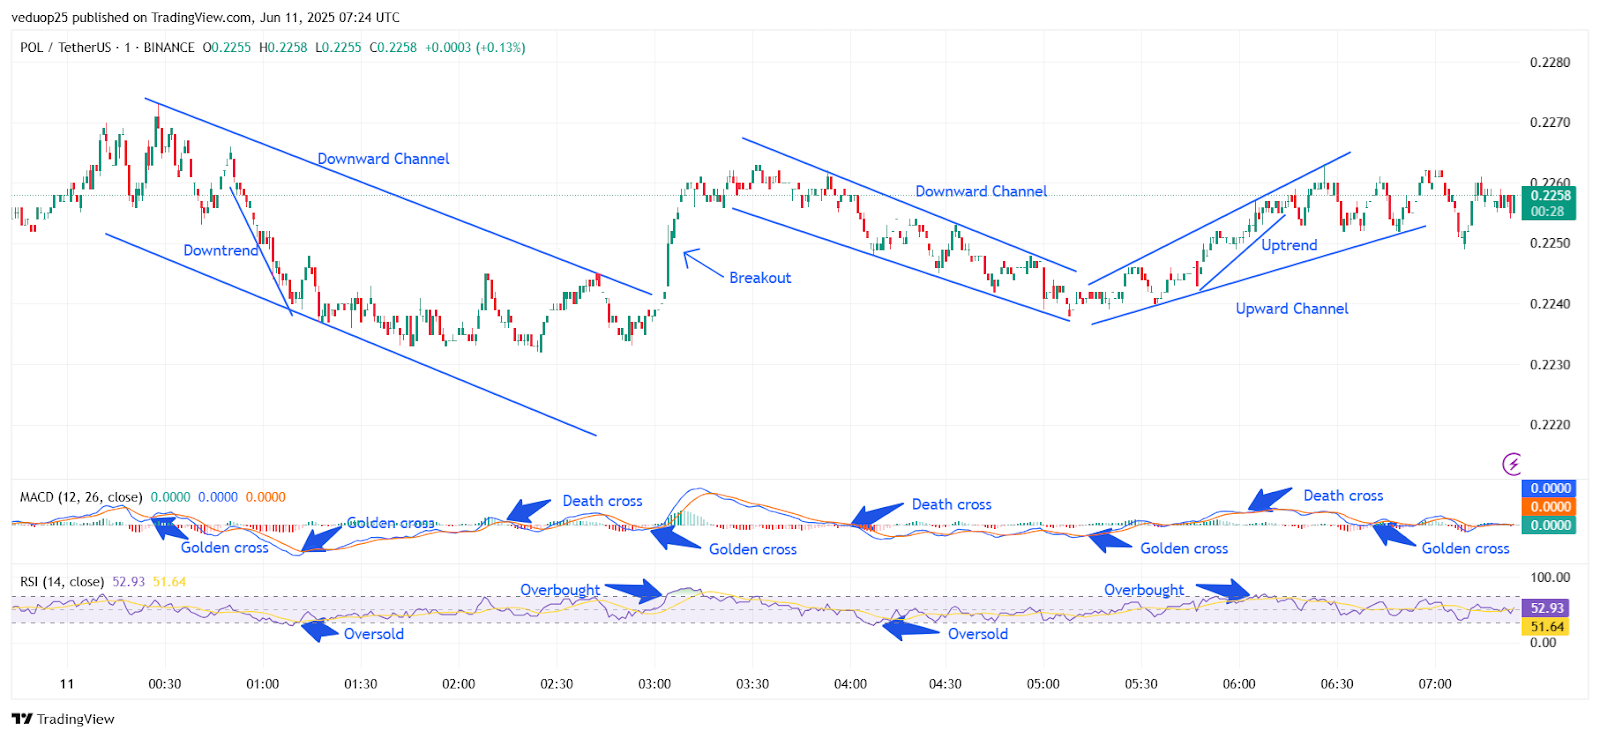
Chart 6- POL/USDT M1 Chart, Analysed By Anushri Varshney, Published on TradingView, June 11, 2025
From 01:45 to 03:15 UTC, the POL price stayed inside the channel but began stabilizing. A MACD death cross appeared near 02:45 UTC, showing fading momentum. Despite that, a second golden cross formed just before 03:00 UTC, setting the stage for a breakout. At exactly 03:20 UTC, a POL breakout occurred with a sharp green candle piercing above the upper trendline of the channel. This move was supported by rising RSI, which spiked above 70, marking a temporary overbought zone. The price quickly rallied toward $0.2268 before facing short-term resistance.
POL Price Rebounds From $0.2240 Low, Consolidates Below $0.2265
Between 03:30 and 04:45 UTC, the Polygon token entered another downward channel as traders took profits. MACD flipped again with a death cross near 04:00 UTC, while RSI cooled back to the 45–50 range. Price touched a low near $0.2240 around 04:30 UTC. From 05:00 UTC onward, bulls stepped in again, and POL formed a new uptrend inside an upward channel. Price moved steadily from $0.2245 to $0.2260 by 06:00 UTC. The final stretch from 06:00 to 07:00 UTC saw consolidation within the upward channel. RSI briefly hit overbought again near 70 before flattening to neutral. MACD flipped multiple times, showing indecision as POL price held between $0.2250 and $0.2260.
POL Breakout Holds as Bulls Defend Short-Term Trendline
The POL price closed the 24-hour session on a stable note after reclaiming momentum through a clean breakout and steady uptrend. Despite two downward channels earlier in the day, the Polygon token managed to reverse losses with a sharp breakout near 03:20 UTC, which was supported by a golden cross on the MACD and an RSI spike above 70. While minor pullbacks followed, the uptrend structure remained intact with buyers stepping in around $0.2240. MACD printed multiple golden crosses through the recovery phase, while RSI stayed mostly above 50, confirming buyer interest.
Currently, POL price trades near $0.2258, consolidating just under resistance at $0.2265. A successful breakout above this level could lead to a short-term rally toward $0.2280 or higher. However, if the uptrend breaks, the key support at $0.2240 could be revisited. Momentum indicators now suggest a neutral-to-bullish bias heading into the next session.
Polygon (POL) Price Analysis For June 18, 2025
The POL Price showed clear intraday swings, starting with early pressure before a sharp breakout and eventual cooldown. The Polygon token moved through a full cycle of breakouts and corrections, with momentum flipping multiple times across the session. Between 00:00 and 00:30 UTC, POL Price showed a minor uptrend but stayed range-bound. By 00:45 UTC, a downward channel formed. The price gradually declined inside this setup until 02:45 UTC. RSI touched oversold early near 01:00 UTC, while MACD gave two golden crosses during this time, but buyers failed to gain control.
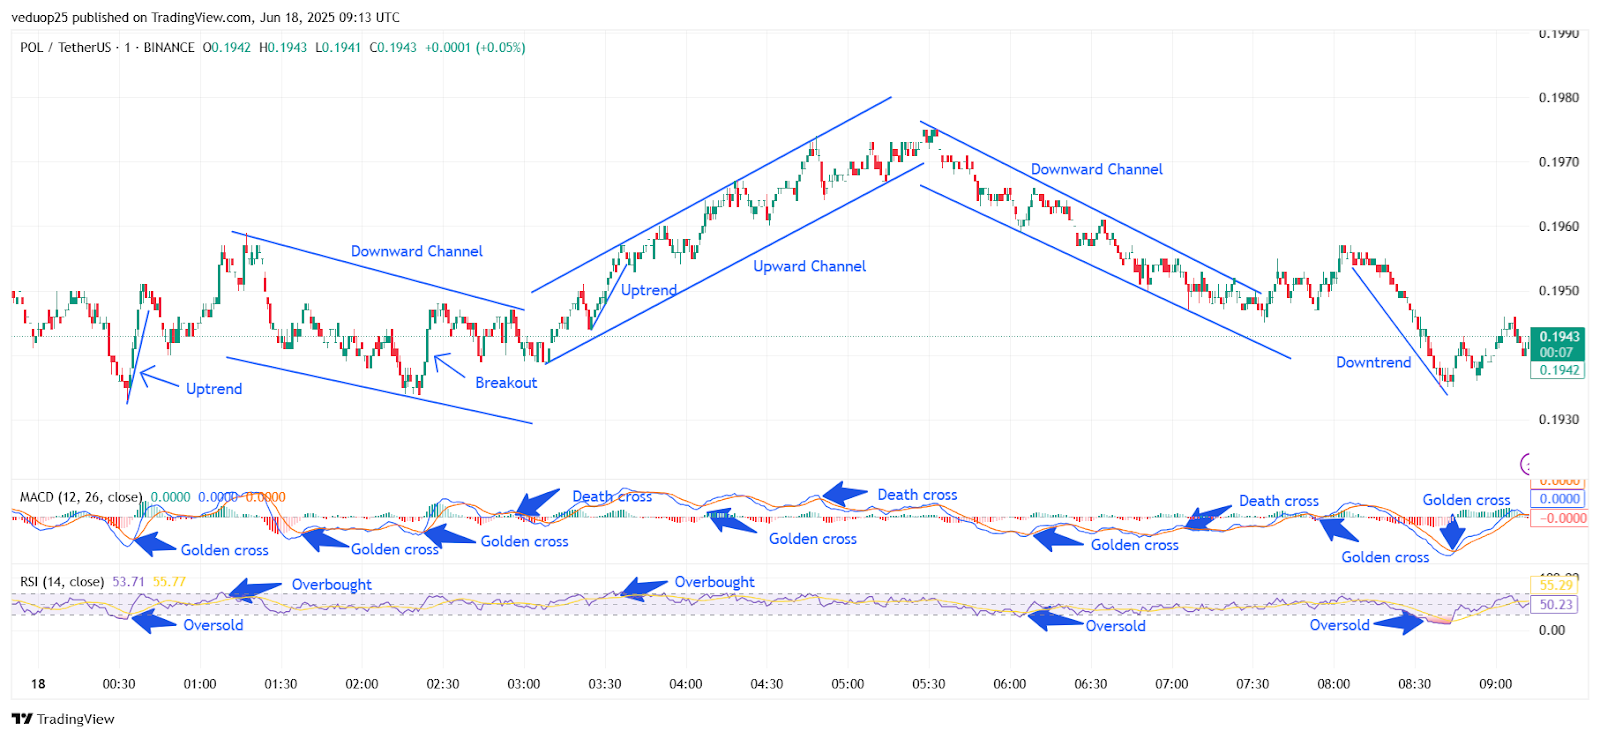
Chart 7- POL/USDT M1 Chart, Analysed By Anushri Varshney, Published on TradingView, June 18, 2025
At 02:45 UTC, a clean POL breakout occurred. Price shot up, breaking out of the downward channel. This move triggered a sharp uptrend that lasted until 04:45 UTC. The Polygon token climbed steadily inside an upward channel. RSI crossed into overbought around 03:30 and 04:15 UTC. MACD printed strong golden crosses at each breakout stage, confirming buyer strength. This was the most bullish phase of the session.
POL Price Faces Pressure After Early Breakout and Heavy Swings
A shift began at 05:00 UTC. Between 05:00 and 06:30 UTC, a new downward channel took over. RSI stayed neutral, but MACD gave a clear death cross by 05:30 UTC, showing selling pressure. POL price gradually declined through this period, giving back earlier gains. Between 06:30 and 07:15 UTC, a short bounce lifted the token slightly, but it failed to break resistance. Another drop followed.
A death cross on MACD at 07:15 UTC marked renewed bearish strength. The price moved lower between 07:30 and 08:30 UTC, and RSI dipped into oversold again. At 08:30 UTC, a recovery attempt began. A golden cross on MACD and a bounce on RSI around 08:45 UTC triggered a mild push upward. By 09:00 UTC, POL Price held just above support, showing signs of cooling down. If momentum holds, another breakout may follow soon. If not, the price may test lower support levels again.
POL Price Awaits Next Move After Volatile Swings
The POL price showed a full rotation of trends today, with early weakness, a strong breakout, and a steady cooldown into the close. The clean POL breakout between 02:45 and 04:45 UTC was the strongest move, supported by bullish RSI and MACD signals. However, the momentum didn’t last. Sellers returned quickly, driving the Polygon token into a downward channel for several hours. Multiple golden and death crosses throughout the day confirmed the changing sentiment.
Oversold RSI zones created bounce opportunities, but no breakout followed in the second half. With the price now holding near $0.1942 and a golden cross appearing, POL may see a short-term breakout if momentum builds. The next POL breakout could retest the $0.1960 resistance if volume picks up. If sellers return, $0.1930 may be tested again. For now, the trend remains neutral.
Polygon (POL) Price Analysis For June 21, 2025
The POL price analysis highlights a clean mix of trend formations, momentum shifts, and consolidation phases, as bulls and bears battled across key zones. The session began around 00:00 UTC with POL trading inside an upward channel, pushing slowly from $0.1835 to nearly $0.1860 by 02:15 UTC. MACD printed back-to-back golden crosses, confirming bullish momentum early on. RSI moved above 60 during this stretch and briefly touched overbought, showing strong interest from buyers.
From 02:15 to 05:00 UTC, the POL price entered a sideways trading range between $0.1855 and $0.1865. During this phase, momentum started fading. The RSI hovered around the 50 mark, and MACD flipped twice, with a minor death cross around 04:00 UTC. At 04:30 UTC, RSI flashed overbought again but couldn’t trigger a breakout, and POL dipped to retest $0.1850 by 05:00 UTC.
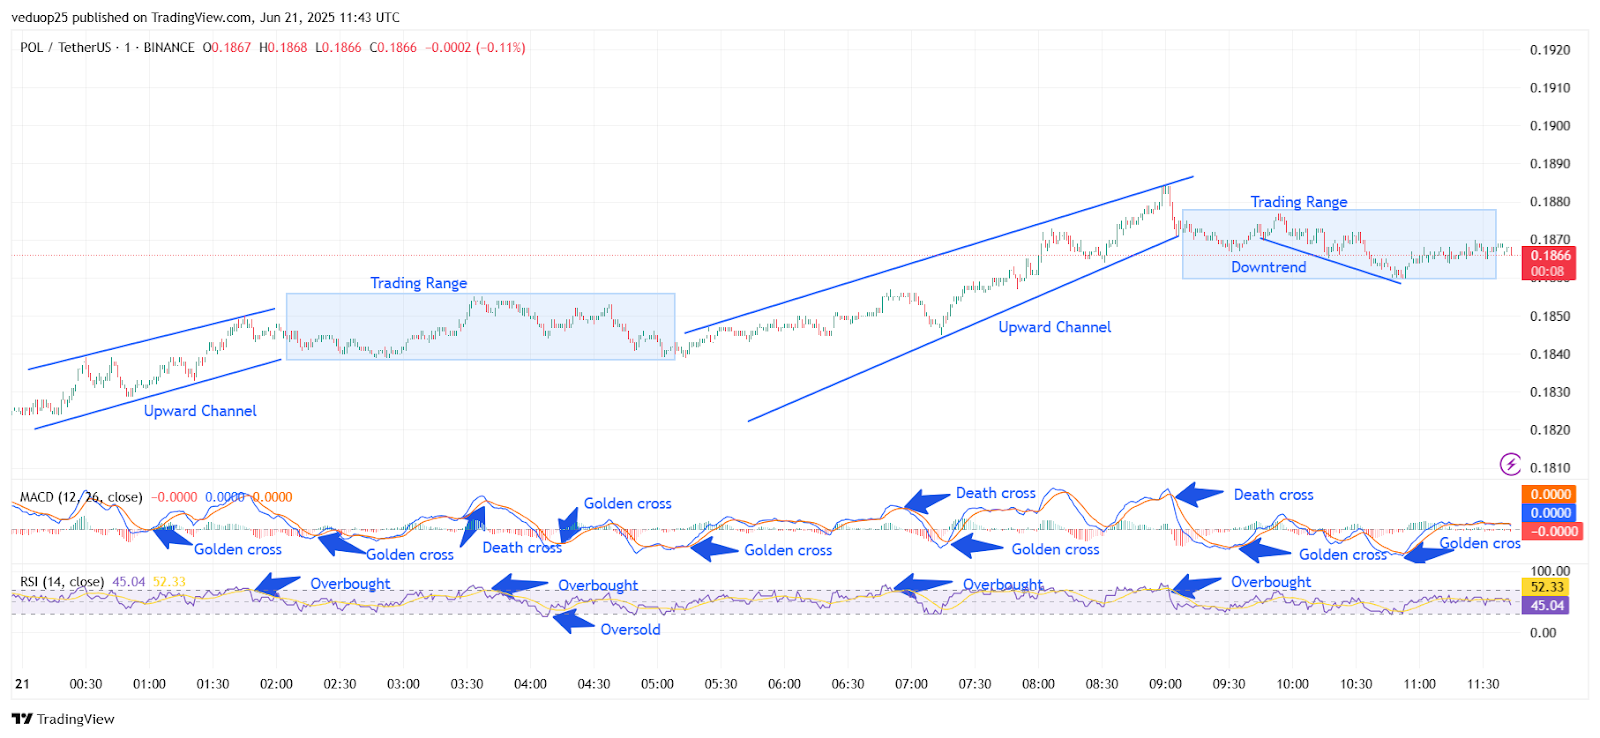
Chart 8- POL/USDT M1 Chart, Analysed By Anushri Varshney, Published on TradingView, June 21, 2025
By 05:15 UTC, another upward channel started forming. The POL coin rallied steadily from $0.1850 to $0.1890, peaking at 08:45 UTC. This move was supported by multiple golden crosses on the MACD and a strong RSI climb that hit overbought twice, at 07:15 and again around 08:30 UTC. This marked the strongest POL breakout of the session.
POL Price Reverses From $0.1890 Peak, Holds Steady Near $0.1866
By 08:45 UTC, the uptrend lost steam. A sharp MACD death cross near 09:00 UTC triggered a fast reversal. The price fell from $0.1890 to $0.1855 by 09:30 UTC, forming a quick downtrend inside the broader range. RSI cooled off from 70+ levels to near 45, and MACD stayed bearish. From 09:30 UTC until the end of the session, POL/USDT traded inside a narrow range between $0.1855 and $0.1870.
RSI hovered between 50–55, and MACD saw minor bullish flips but lacked follow-through. This consolidation phase suggested the market was cooling off after the earlier volatility. At the time of writing, POL price sits at $0.1866, with RSI neutral at 52.33 and MACD flat. Immediate support is seen at $0.1850, while resistance remains near $0.1890, which capped the earlier breakout.
POL Awaits Clear Direction After Volatile Session
The POL price action shows a market caught between bullish enthusiasm and short-term exhaustion. After two strong upward channels and repeated golden crosses, buyers failed to hold momentum above $0.1890, leading to a sharp correction and a shift into consolidation. MACD signals alternated frequently, and RSI bounced between overbought and neutral zones, confirming choppy sentiment.
Bulls need to break above the $0.1890 resistance for any meaningful upside, while bears could gain ground if $0.1850 support gives way. The current sideways range reflects uncertainty, and without a strong catalyst, the price may stay range-bound. For now, the POL trend remains neutral with a slight bullish bias, but the next breakout — up or down will likely define the direction for the upcoming sessions. Traders should stay alert for clear volume and MACD confirmation.
POL Price Analysis For June 25, 2025
The POL price analysis highlights a volatile session with sharp moves, clear trend shifts, and repeated momentum flips. The Polygon token started the day under pressure, falling sharply in a downward channel from 00:00 to 00:45 UTC. Price dropped from $0.1838 to $0.1815 before settling into a sideways range.
From 00:45 to 02:30 UTC, POL Price traded within a tight range between $0.1816 and $0.1826. MACD showed a golden cross near 01:00 UTC, and RSI moved out of oversold territory, but the price failed to break out. The lack of volume kept the Polygon token stuck in this zone.
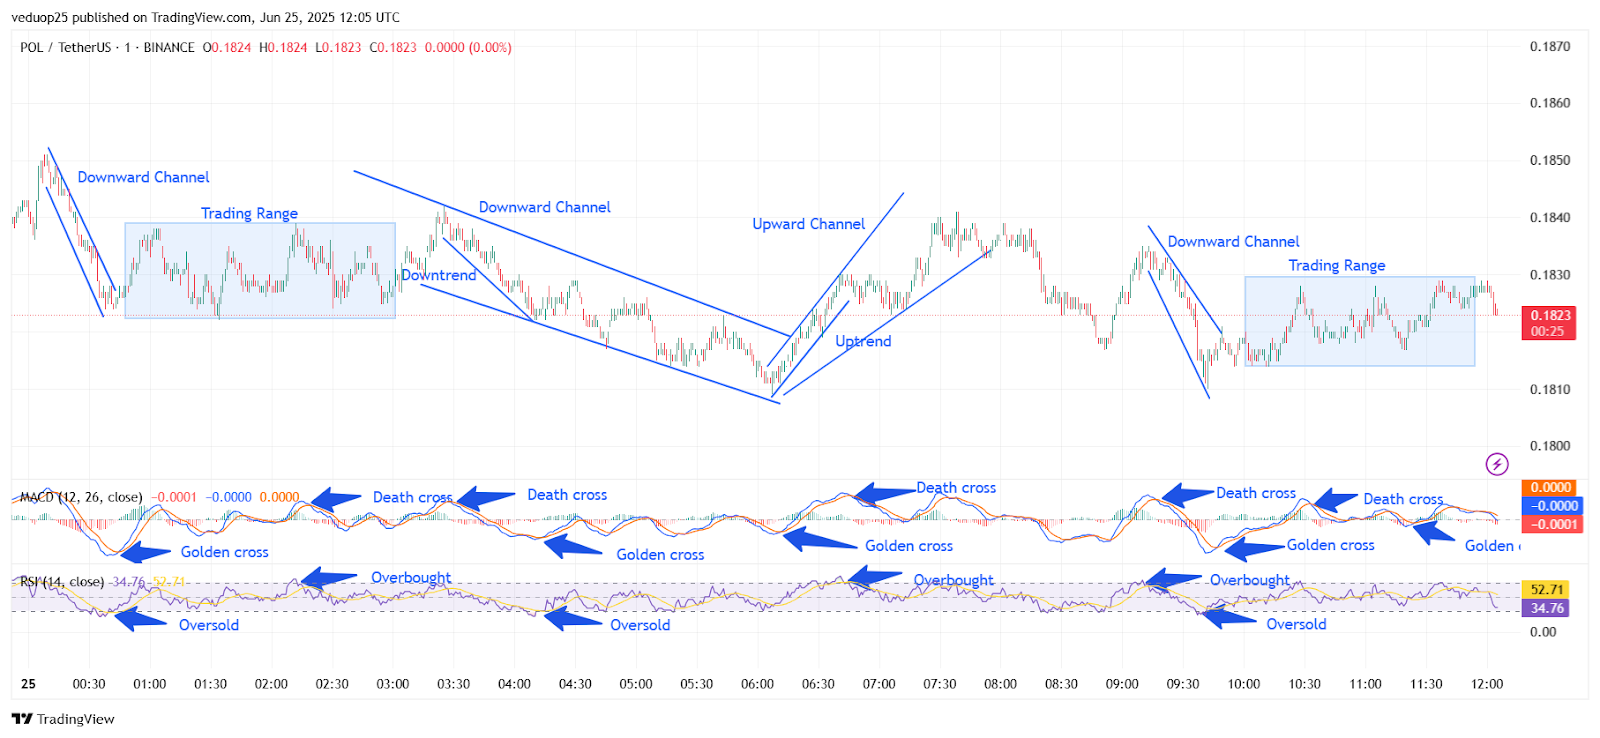
Chart 9- POL/USDT M1 Chart, Analysed By Anushri Varshney, Published on TradingView, June 25, 2025
At 02:45 UTC, the price moved lower again, forming a slight downtrend that transitioned into a fresh downward channel from 03:30 to 05:45 UTC. During this period, the MACD printed two death crosses, and the RSI stayed below 50. Sellers had control, and the POL Price stayed weak, touching new intraday lows near $0.1812.
POL Breakout Fizzles as Momentum Fades Into Range
The biggest POL breakout of the day came between 06:00 and 07:30 UTC. A golden cross appeared on MACD, and RSI flashed oversold before the rally started. The Polygon token surged in a clean upward channel, from $0.1812 to $0.1842. This was the most convincing bullish move of the session, backed by momentum and structure. However, this strength faded quickly. From 08:00 to 09:15 UTC, POL Price reversed sharply in a new downward channel. RSI moved out of the overbought zone, and a death cross hit the MACD. The price dropped below $0.1825 before bouncing slightly.
By 09:30 UTC, another minor recovery attempt started as the price formed support near $0.1816. MACD printed a golden cross, and RSI came out of oversold again. But the move lacked strength. From 10:00 to 11:45 UTC, POL Price entered a narrow trading range, bouncing between $0.1818 and $0.1832. As of noon UTC, the price trades at $0.1823, showing indecisive momentum and weak volume. MACD and RSI both remain neutral.
POL Price Stalls After Early Breakout Surge
The POL price action on June 25 delivered a strong early breakout, but momentum faded quickly into sideways movement. The most notable move came between 06:00 and 07:30 UTC when the Polygon token rallied sharply from $0.1812 to $0.1842, backed by a golden cross and an RSI recovery from oversold levels. However, this POL breakout failed to hold. Sellers stepped in by mid-session, pulling the price back into a downward channel and eventually into a tight range.
MACD flipped multiple times throughout the day, and RSI remained neutral after midday, highlighting indecision. From 10:00 UTC onward, the Polygon token stayed locked in a narrow range without any clear trend direction. Despite short-term support holding near $0.1816, buyers showed little strength to push higher. Going forward, a decisive move above $0.1845 or below $0.1810 will be key for the next breakout. Until then, the POL Price remains rangebound and cautious.
Polygon (POL) Price Analysis For June 30, 2025
The POL price analysis shows repeated trends, short-term breakouts, and key support reactions. The day began with the POL price trading near $0.1830. Between 00:00 and 01:30 UTC, it moved inside a sharp downward channel, as selling pressure built up. The MACD gave a bearish signal early, while the RSI dipped into the oversold zone, confirming strong downside momentum. Around 01:45 UTC, a golden cross on the MACD hinted at a possible reversal, and price action shifted into a trading range between 01:30 and 03:00 UTC.
From 03:00 to 03:45 UTC, POL turned slightly bearish again with a death cross and a short downtrend inside the range. The RSI touched 70, signaling a short overbought condition that triggered fresh selling. The Polygon token then stayed inside a horizontal channel from 03:45 to 06:00 UTC, as the price lacked momentum and volume remained low.
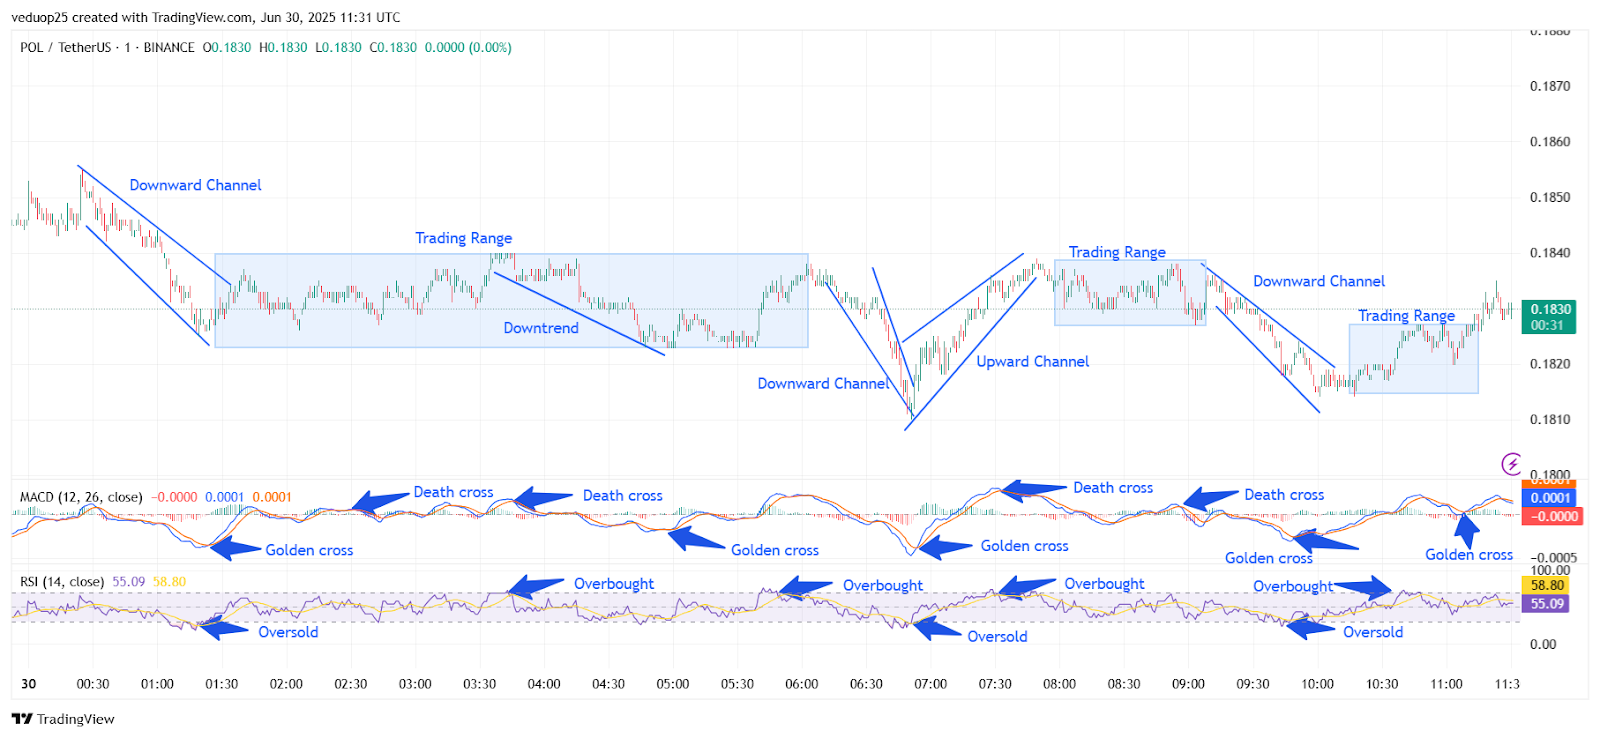
Chart 10- POL/USDT M1 Chart, Analysed By Anushri Varshney, Published on TradingView, June 30, 2025
At 06:00 UTC, the pair broke down into another downward channel, leading to a deeper sell-off until 06:30 UTC. The RSI dipped below 30 again, indicating oversold pressure. However, this zone acted as a bounce area, and a POL breakout followed right after a golden cross on the MACD. The price surged in an upward channel from 06:30 to 07:30 UTC, gaining back lost ground.
Short-Lived POL Breakout Fizzles as Price Returns to Range Near $0.1830
The upside was short-lived. At 07:30 UTC, the MACD flipped with a death cross, and the RSI entered overbought territory. This slowed momentum, and POL moved sideways in a trading range between 07:30 and 08:45 UTC. Buyers failed to push above the resistance.
A new downward channel formed from 08:45 to 10:00 UTC, causing another pullback. This was followed by yet another golden cross on the MACD at 10:15 UTC. Price bounced from the oversold region once more and traded in a tight range between 10:15 and 11:15 UTC. By 11:30 UTC, the POL price hovered near $0.1830, where it started the day. RSI stood neutral around 55, and the MACD lines were flat, suggesting indecision.
Range Holds as Momentum Fades for Polygon Token
The POL price stayed between tight support and resistance levels all day. It made a few breakout attempts, but none held strong. RSI kept dipping into oversold zones, helping short rallies. But those moves faded fast. MACD flipped often, showing no strong trend. The strongest POL breakout came early in the morning. But overbought signals and weak volume pulled it back. Right now, the Polygon token is still moving sideways. Buyers need to break above $0.1840 with solid momentum. Until then, range-bound action will likely continue.
Polygon (POL) Price Analysis For July 1, 2025
The POL price analysis shows a clear mix of bearish and bullish phases, guided by channels, ranges, and key indicator signals. Price began near $0.1831 at 00:00 UTC. Early selling pressure drove the pair into a sharp downward channel. By 03:00 UTC, the Polygon token fell to $0.1812, marking lower highs and lower lows as bears held control.
At 01:00 UTC, the RSI dipped into oversold territory, and the MACD formed a golden cross near 01:30 UTC. This brief bullish signal led to a bounce toward the lower channel line. Yet by 02:30 UTC, a MACD death cross and another RSI oversold reading forced the price back down to the channel bottom around $0.1810, ending the early rebound attempt. From 03:00 to 06:00 UTC, price action flattened within the downward slope. A minor uptrend attempt at 04:00 UTC saw Polygon coin test the channel’s midline.
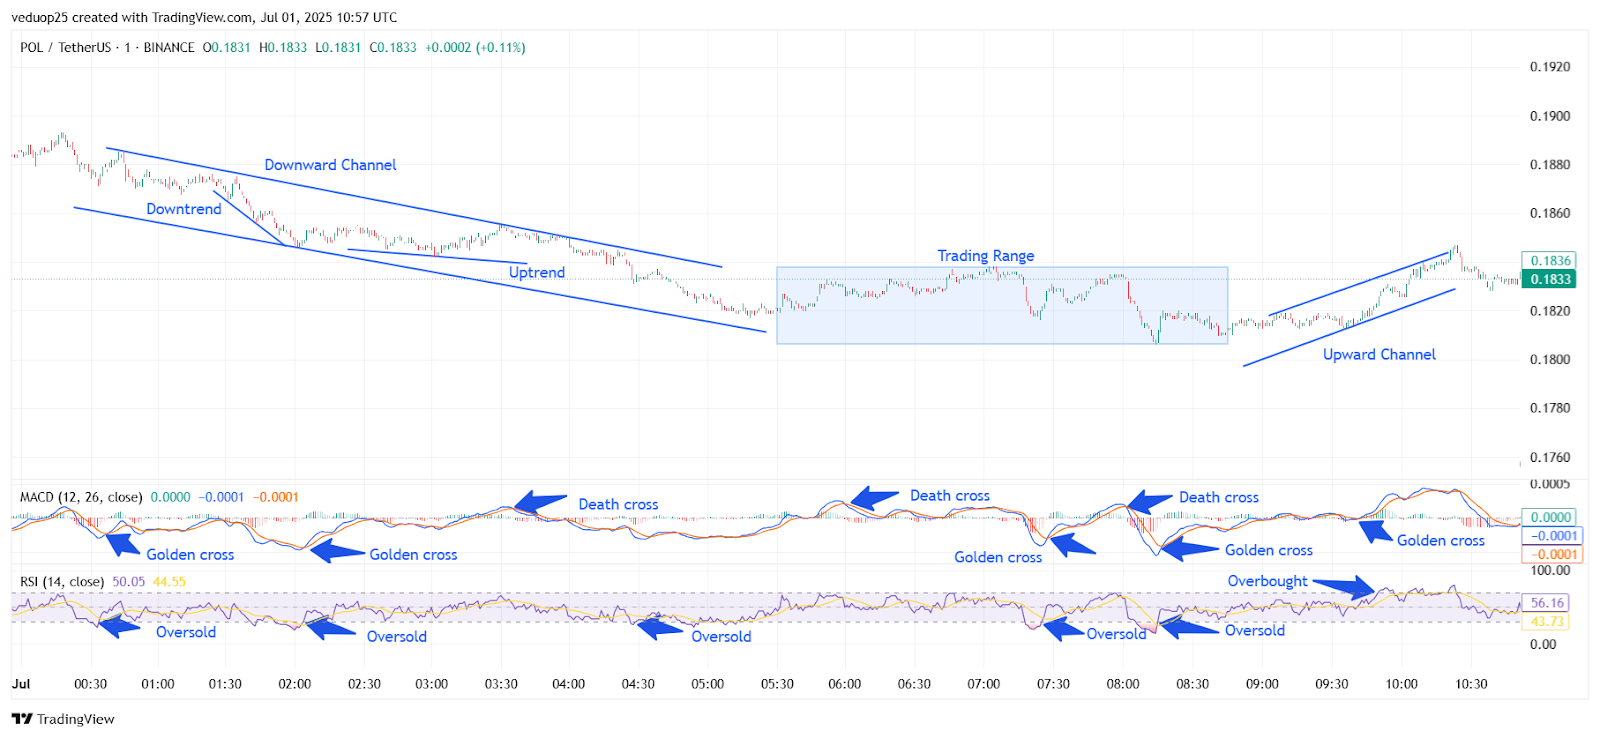
Chart 11- POL/USDT M1 Chart, Analysed By Anushri Varshney, Published on TradingView, July 1, 2025
The RSI recovered above 40, but a death cross on the MACD at 05:00 UTC halted gains. By 06:00 UTC, tokens traded near $0.1815, as bears retook momentum ahead of the midday session and set the stage for a narrow range. Between 06:00 and 09:00 UTC, the pair entered a trading range between $0.1810 and $0.1830. MACD crossovers alternated quickly, and RSI hovered near 50. Neither buyers nor sellers secured control. Intraday highs touched $0.1830 at 08:00 UTC, while lows dipped to $0.1810 at 07:15 UTC. The quiet range hinted at a potential POL Breakout in the hours ahead.
POL Breakout Clears $0.1830 as Bulls Regain Control
The POL breakout came at 09:00 UTC when buyers drove the Polygon token above $0.1830, clearing the range high. A golden cross on the MACD confirmed bullish momentum. RSI climbed above 55. Price moved inside an upward channel and hit $0.1840 by 11:00 UTC.
The pair consolidated within the channel upwards, from 12:00 to 18:00 UTC, trading from a low of $0.1835 to a high of $0.1845. The MACD lines tightened, but remained bullish, and the RSI climbed steadily above 50. Traders who viewed pullbacks to the bottom of the channel as opportunities to buy provided support at $0.1835 whilst allowing a rally to continue through the afternoon session.
The price dipped briefly to $0.1830 at 20:00 UTC, testing support when buyers entered and promptly bought the price back up to $0.1842 by 22:30 UTC. Slightly late, profit taking sent the price back down toward the previous close, $0.1836. The 24‐hour cycle is marked by a clear downtrend, range trading, and a late, bullish breakout. A close above $0.1840 on the daily candle would add credibility to upside continuation, whereas a drop into $0.1830 would add risk of renewed selling.
POL Price Holds Gains After Clear Breakout Shift
The POL price concluded with a decisive shift from bearish control to bullish strength. The token has seen some early weakness following drops into the downward channel, where it has traded since. The token has traded around this same level over multiple oversold RSI readings and short-term golden crosses without any momentum. The mid-session consolidation state was active in the $0.1810 to $0.1830 range.
Now that we are above the $0.1830 level with the market, the bulls are grabbing the wheel. If the market decides to drive below the $0.1830, short-term market sentiment could flip just as quickly as the early exuberance has found the road to price improvement. $0.1830 provides support through the upward channel, and the higher lows continue to show bullish directional control. As we hit near-close, POL price appeared to settle towards $0.1836, which shows significant demand at that lower price and possible incentive for another drive above. If the buyers can hold on to support at the $0.1830 level, we can see the next resistance around $0.1845 or so.
POL Price Analysis For July 5, 2025
The POL price analysis shows consistent range movement with sharp corrections but no major POL breakout, as buyers failed to hold momentum after early gains. The Polygon token moved in repeated cycles of short rallies and declines, with indicators flipping frequently across the session.
The day started at 00:00 UTC with an upward push. The POL price climbed steadily from $0.1790 to a peak of $0.1818 by 00:30 UTC, forming a clean upward channel. RSI briefly touched overbought conditions, while MACD stayed neutral. This breakout attempt didn’t hold, and sellers quickly stepped in.
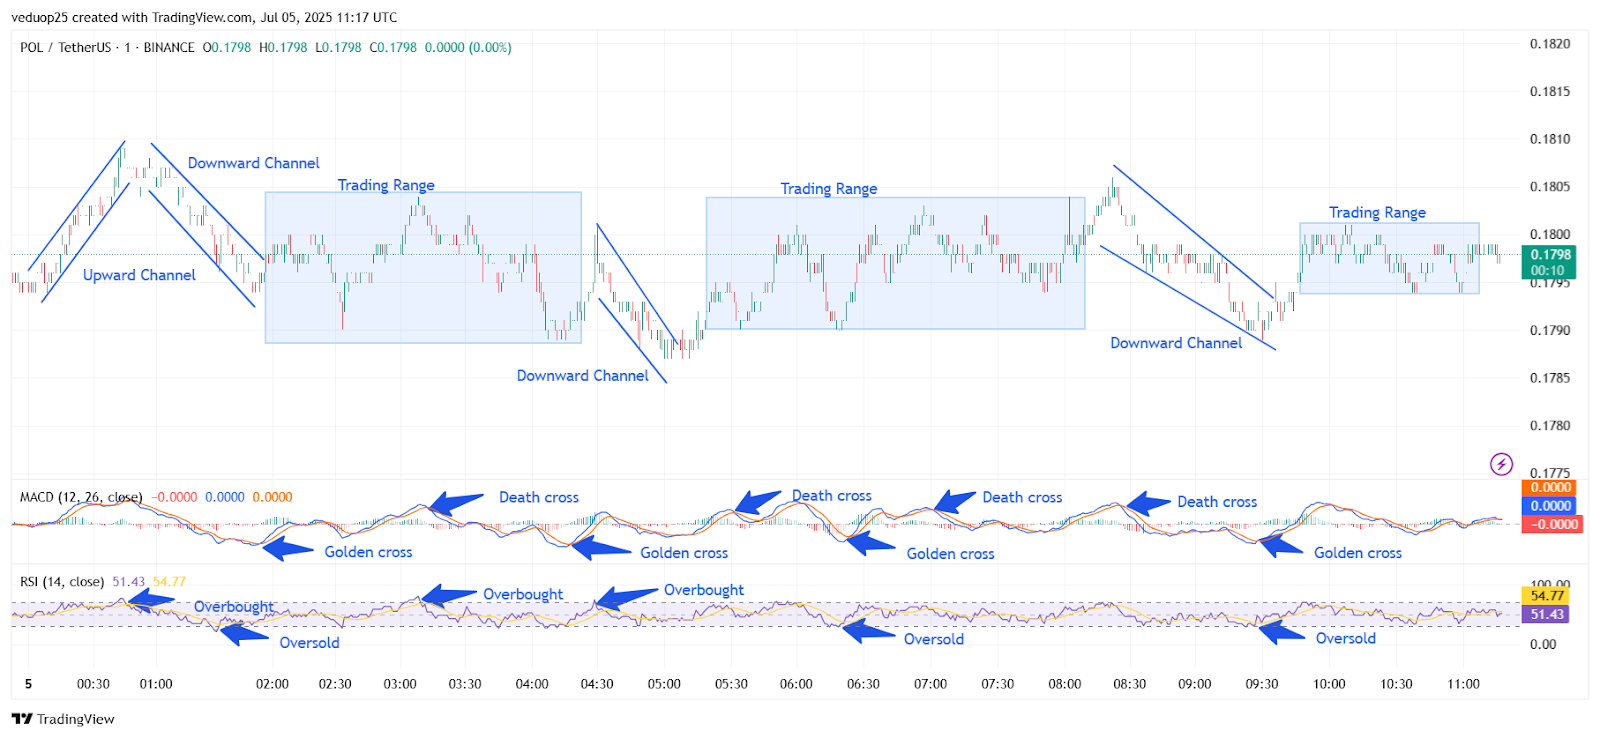
Chart 12- POL/USDT M1 Chart, Analysed By Anushri Varshney, Published on TradingView, July 5, 2025
From 00:30 to 01:30 UTC, the price reversed through a downward channel, pulling back to $0.1792. MACD flipped bearish, and RSI cooled down. At 01:30 UTC, POL stabilized into a sideways range between $0.1790 and $0.1805, which held steady until 04:00 UTC. RSI hovered near mid-levels, and MACD gave a golden cross around 02:00 UTC, but no follow-through came. A brief death cross occurred near 03:30 UTC, reflecting choppy sentiment.
POL Swings Between $0.1783–$0.1803
By 04:00 UTC, POL dipped sharply into another downward channel, touching a low of $0.1784 by 04:30 UTC. From 04:30 to 08:00 UTC, the Polygon token moved in a stable trading range. The price floated between $0.1785 and $0.1803. RSI entered mild overbought territory twice, near 05:30 and 06:15 UTC, but the price failed to break above the resistance. MACD issued two quick death crosses, showing weak bullish strength.
A fresh decline came between 08:00 and 09:00 UTC, with POL forming another downward channel to a session low of $0.1783. RSI hit oversold again, and MACD shifted bullish with a golden cross at 09:30 UTC. From 09:30 to 11:00 UTC, POL moved sideways again in a tight trading range between $0.1792 and $0.1800. Both RSI and MACD stayed flat. The price hovered around $0.1798 by the final candle.
POL Price Awaits Directional Clarity After Range-Bound Day
The POL price closed the last 24 hours with no confirmed breakout, staying stuck in multiple tight trading ranges despite early upward momentum. After peaking near $0.1818 during the first hour, the Polygon token slipped into a downward channel and remained sideways for most of the session. Multiple MACD crosses and repeated RSI overbought and oversold signals marked short-term reversals, but none led to a sustained trend.
Buyers failed to reclaim control after each recovery, and sellers couldn’t push below key support either. This kept the POL price fluctuating within a narrow band between $0.1783 and $0.1803 for most of the day. No strong volume backed any move, keeping sentiment neutral. As of the final candle, the price sits near $0.1798. A clear POL breakout will only be confirmed if the token moves above $0.1815 or below $0.1780 with momentum. Until then, the Polygon token remains in indecision.
POL Price Analysis For July 7, 2025
The POL price analysis exhibits alternating trends with clear breakout signals and range-bound consolidation. The session began with POL price trading in a mild uptrend. Around 00:30 UTC, it entered an upward channel, which was clearly defined with higher highs and higher lows. The momentum picked up shortly after with an MACD golden cross, along with an RSI value approaching 66, showing a stronger bullish move.
This move peaked near 02:15 UTC, as the Polygon token approached overbought RSI levels, followed by a death cross, confirming trend exhaustion. From 02:30 UTC to 05:00 UTC, the trend reversed into a downward channel, marking a controlled decline. Momentum shifted bearishly as another death cross appeared on MACD, and RSI dipped below 30 at 04:30 UTC—indicating oversold conditions.
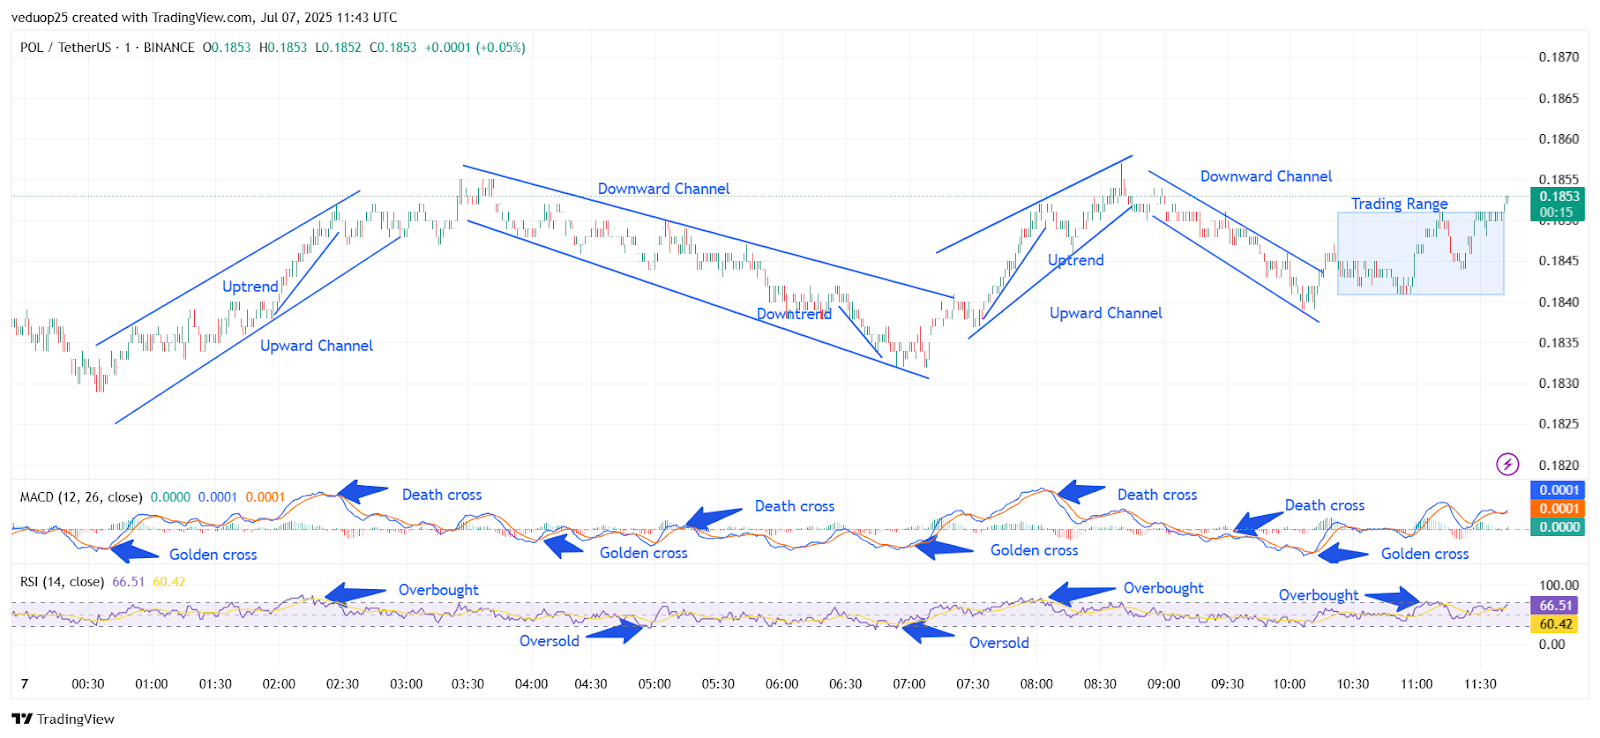
Chart 13- POL/USDT M1 Chart, Analysed By Anushri Varshney, Published on TradingView, July 7, 2025
The RSI oversold signal caused a short-term bounce that coincided with a golden cross at 05:00 UTC but did not last long. From 05:00 UTC until 06:45 UTC, the POL price continued to trend downwards in the channel and produced new lows. A second RSI reading that was oversold materialized around 06:30 UTC, which acted as a support area and showed a sharper reversal.
POL Breakout Fades as Price Stalls Below 01855 After Bullish Surge
At 07:00 UTC, the POL breakout started gaining momentum, initiating a fresh upward channel. A MACD golden cross and RSI rebound confirmed bullish sentiment. Between 07:15 and 08:15 UTC, POL surged sharply, eventually touching overbought territory once again. This uptrend lost strength after 08:30 UTC, with the price showing exhaustion signs near the top of the channel.
By 08:45 UTC, the Polygon token shifted back into a downward channel, pulling back slowly as RSI cooled down. The MACD confirmed the change with a death cross at 09:00 UTC. The trend remained mildly bearish with fading volume from 09:00 – 10:00 UTC. The trend flattened, and POL price entered a tight trading range of $0.1843-$0.1853. By 11:00 UTC, MACD and RSI were neutral, signalling indecision/lack of momentum. Despite multiple overbought spikes near the end, the token failed to break resistance.
POL Price Stalls After Volatile Channel Swings
The POL price displayed strong intraday volatility, swinging between rising and falling channels before entering a tight consolidation phase. Initial gains during the upward channel were confirmed by a MACD golden cross and overbought RSI, but the momentum faded quickly after a death cross. Bearish pressure took over from 02:30 UTC to 06:30 UTC, forming a downward channel with support emerging at RSI oversold levels. The Polygon token rebounded sharply around 07:00 UTC with another golden cross, but again failed to sustain above the upper range as RSI hit overbought territory.
After 09:00 UTC, POL cooled off with another move down before moving sideways and establishing a range between $0.1843 and $0.1853. Current indicators are neutral, suggesting that the market is waiting for a breakout move. A break above $0.1855 could provide more fuel for another push higher, and a break below support could extend the pullback. Traders should stay on the lookout for a POL breakout.
Polygon (POL) Price Analysis For July 11, 2025
The POL price analysis shows tight channel formations, breakout attempts, and range-bound volatility as the Polygon token struggled to sustain directional momentum. The session began with low volatility between 00:00 and 00:30 UTC. By 00:45 UTC, the POL Price entered an upward channel, gaining steady momentum.
A MACD golden cross formed near 01:00 UTC, supported by rising RSI, which hit overbought levels at 01:30 UTC. Price moved sharply to $0.2280 by 01:45 UTC, marking the day’s first POL breakout. However, it couldn’t hold and slipped into a sideways range. From 02:00 to 03:15 UTC, the price stayed flat inside a tight trading range. Despite another MACD golden cross near 02:45 UTC, the momentum didn’t push beyond $0.2285.
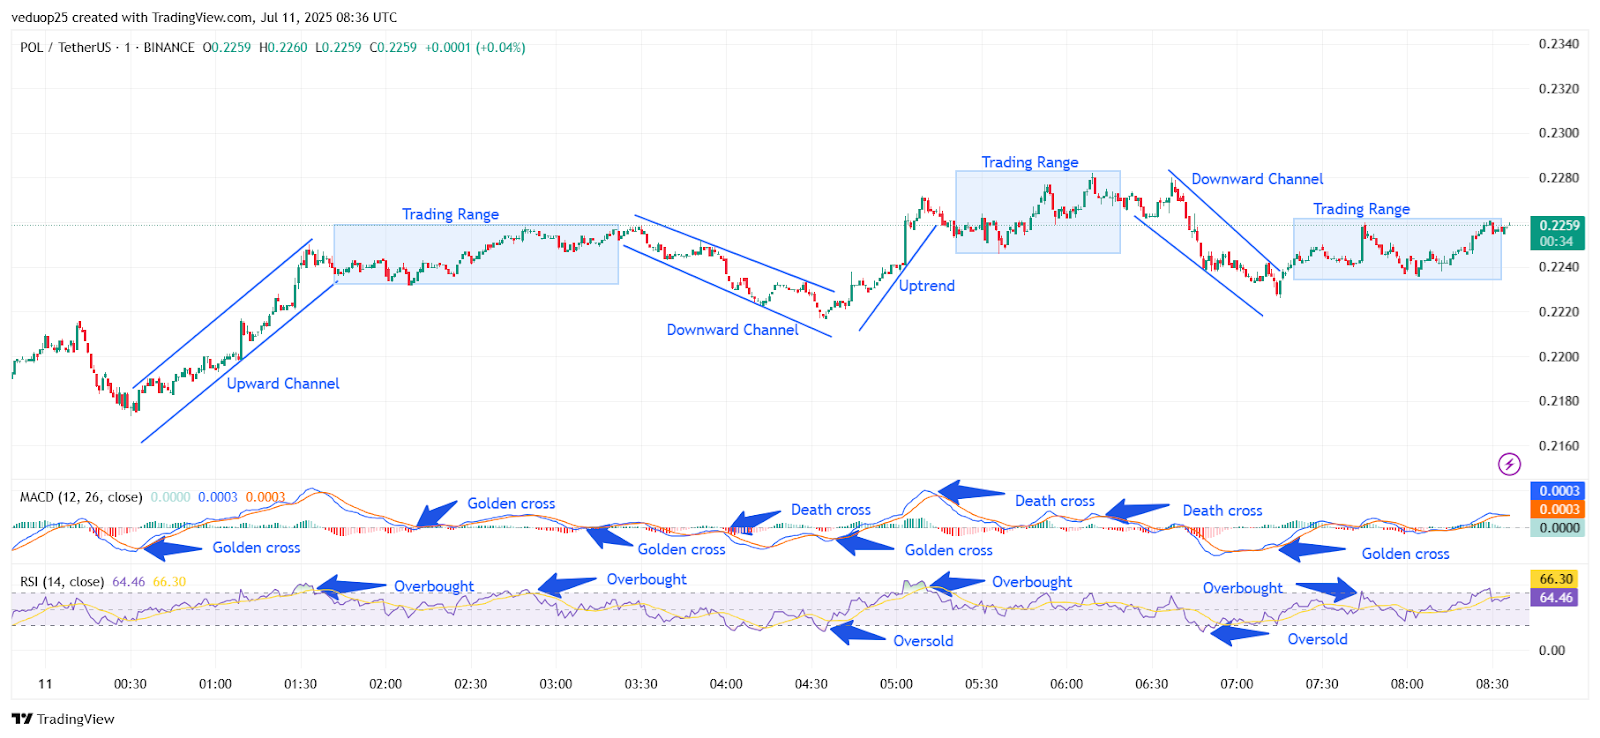
Chart 14- POL/USDT M1 Chart, Analysed By Anushri Varshney, Published on TradingView, July 11, 2025
The RSI also hovered near overbought but showed signs of fading strength. This led to the breakdown of the range. Between 03:30 and 04:30 UTC, POL entered a clean downward channel. A MACD death cross confirmed the shift, with RSI dropping gradually toward the oversold zone. The Polygon token retraced to $0.2225 before finding support.
POL Price Swings Between $0.2290 and $0.2215
At 04:45 UTC, a reversal began. A golden cross on the MACD and a recovery from the RSI oversold zone helped fuel an early morning uptrend. Price rose to $0.2290 by 05:15 UTC, registering the second POL breakout of the session. This breakout, however, also lacked strength. From 05:30 to 06:15 UTC, the POL Price moved inside a fresh trading range near $0.2275. A death cross on MACD at 06:00 UTC hinted at a bearish undertone. RSI fell again, showing sellers gaining short-term control.
Another downward channel followed between 06:30 and 07:00 UTC. MACD printed consecutive death crosses, and RSI entered oversold again. The price bottomed near $0.2215 before buyers stepped in. From 07:15 UTC onward, POL moved into a final trading range around $0.2240 to $0.2260. A mild recovery was noted after 08:00 UTC, with a MACD golden cross and RSI near 66, suggesting neutral-to-bullish sentiment into the close.
POL Price Remains Range-Bound Amid Repeated Breakouts
The POL Price action stayed largely range-bound despite several sharp but short-lived breakout attempts. Initial strength during the upward channel faded quickly as the Polygon token failed to sustain momentum above $0.2280. Downward channels formed twice, with death crosses on the MACD and RSI dropping to oversold, showing persistent selling pressure during corrections. Nevertheless, bulls defended support near $0.2215 and slightly regained control near the close of the day.
The final golden cross near 08:00 UTC suggested a possible shift longer term in the longer-term trend down, but we will need confirmation. Overall, the POL breakout attempts lacked conviction, keeping the trend neutral. For a stronger upside movement, the Polygon token must break above $0.2290 with volume. Until then, sideways movement within $0.2215–$0.2290 is likely to continue.


