

Polygon (POL) has the more mature technical characteristics of a Layer 2. With a blend of utility-backed steadiness dotted with excursions of intentional speculation. Add to that its established position in the ETH scaling landscape. POL price action likes to group around psychologically important figures — indicating that the figures were previous accumulation areas. The token exhibits controlled reactions to network upgrades, often establishing identifiable chart patterns prior to significant protocol advancements. Volume is especially pertinent, since POL price only exhibits real breakout potential when supported with persistent trading, not isolated bursts. Although still somewhat tied to general market trends. The token is exhibiting more independent momentum during periods of elevated Ethereum network activity. Traders tend to get dependable technical signals by pairing support/resistance analysis with tracking of staking flow dynamics and ecosystem adoption.
POL Price Analysis of September 28, 2025
POL price started the session consolidating in a range giving us the low for the day at $0.2203. A breakout to the upside at 12:50 IST, supported by a golden cross of MACD, fueled momentum and carried price into an expanding triangle. The triangle busted higher again at 8:35 IST with yet another golden cross, launching price upwards to a new range. Back-to-back bull breakouts at 10:00 IST and 12:20 IST pushed the rally further with POL recording the day’s high of $0.2262. Price now has to potential to either grind higher to $0.2300 provided momentum sustains or retrace to $0.2140 if the breakout does not hold.
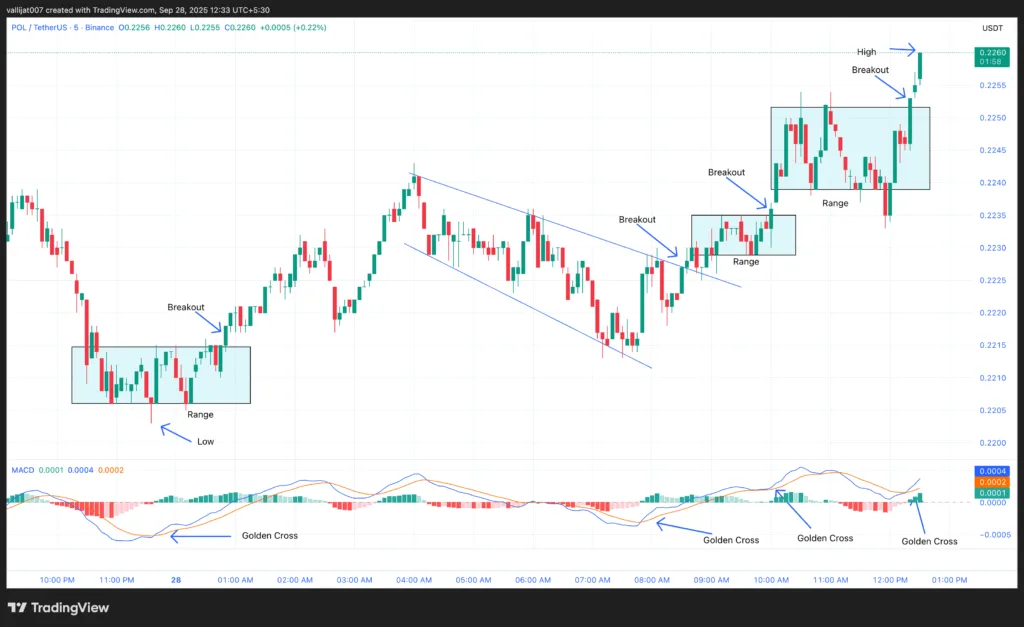
Chart 1: POL/USDT M5 Chart, Analysed by Vallijat007, published on TradingView, September 28, 2025
POL price established a range, signifying the day’s low at $0.2203. The range broke out to the upside at 12:50 IST backed by a golden cross of MACD, and price whipped to the upside, creating an expanding triangle. The expanding triangle pattern again broke out to the upside at 08:35 IST buoyed by a golden cross of MACD, with POL price surging higher and forming a trading range.
The range finally broke out to the upside at 10:00 IST on the strength of a golden cross of MACD, and another range emerged. This second range again broke out to the upside at 12:20 IST bolstered by a golden cross of MACD, with POL price shooting to the upside and recording the day’s high at $0.2262. If the breakout holds, then price could surge towards $0.2300. If the breakout fails, then POL price may fall to $0.2140.
Polygon’s Rio Upgrade And RWA Market Among Regulatory Risks
Polygon’s Rio upgrade mainnet launch in October 2025 targets 5,000 TPS and 1s finality It launches the Validator-Elected Block Producer model to end chain reorganizations and reduces node hardware cost by approximately 40% with stateless verification. These upgrades enable higher throughput, faster confirmation times and decentralized validation, positioning Polygon to be the infrastructure for high-frequency DeFi and global payment use cases.
In the RWA space, Polygon leads with $1.13B TVL, accounting for 62% of tokenized bonds worldwide. But Solana’s RWA slice has exploded in 2025, providing competitive pressure. Polygon’s robust 29% US Treasury Bill tokenization market share supports its bond market supremacy, where incremental TVL growth has traditionally been tied to POL token price growth. Institutional partnerships with the likes of QNB Bank also add fuel to Polygon’s fire.
SEC is intensifying its scrutiny of layer-2 tokens such as POL, which spells out regulatory risks. SEC’s enforcement, XRP selloff expose vulnerability to security designation, market uncertainty Polygon’s Dubai-based foundation could offer some buffer, however traders are still skittish ahead of the SEC’s November 2025 enforcement agenda. In sum, Polygon’s future is contingent on Rio’s successful deployment and sustaining its lead in the RWA market while managing regulatory risks.
Polygon’s Future Depends on the Rio Upgrade and Regulatory Transparency
Polygon’s Rio upgrade heralds revolutionary enhancements including 5,000 TPS capacity, one-second finality and reduced validator costs, fortifying its position as DeFi and payments underpinning. The network also leads in real-world asset tokenization with $1.13B TVL, dominating tokenized bonds and landing institutional partners such as QNB Bank. But competitive pressure from Solana’s RWA growth and intensifying SEC scrutiny on layer-2 tokens create headwinds. A lot of POL’s short-term path rides on Rio’s mainnet momentum and the fate of regulatory risks. If Polygon can maintain RWA leadership and provide technical innovations while managing compliance, POL might generate lasting momentum despite near-term volatility.
POL Price Analysis of August 31, 2025
On August 31, 2025, POL, the original token of Polygon, had a high technical posture, going between critical breakouts. The movement started in a range form, which ruptured to the upside at 03:50 IST based on a golden crossover of MACD. PO experienced a brief shallow spike, following which it entered an expanding triangle formation that propelled the price higher to test against $0.2620 resistance. The token rose further, busting through resistance at 08:50 IST with continued bullish action forming an upward-moving channel. Subsequently, the channel collapsed at 11:30 IST, although buyers recovered their strength, elevating POL to a high of $0.2818 per day until the impetus dwindled.
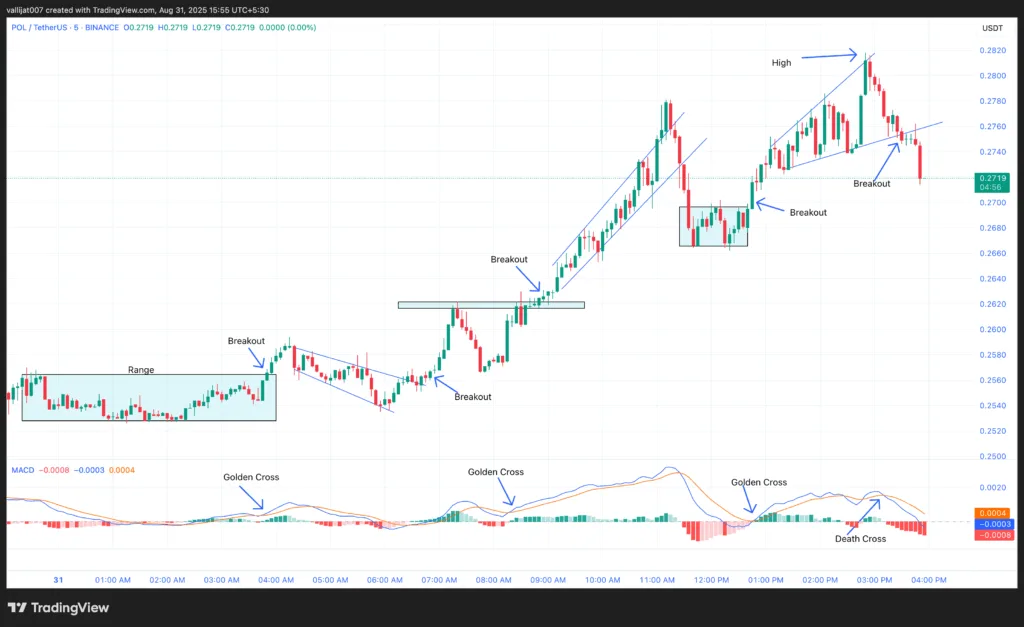
Chart 1: POL/USDT M5 Chart, Analysed by Vallijat007, published on TradingView, August 31, 2025
- The POL price formed a range. The range broke out to the upside at 03:50 IST, supported by a golden crossover of MACD. Price spiked to the upside, but the momentum was weak, and price formed a downward-moving expanding triangle pattern.
- The expanding triangle pattern broke out to the upside at 06:50 IST, supported by a golden crossover of MACD. Price spiked to the upside and formed a resistance area at the level of $0.2620.
- The resistance broke out to the upside at 08:50 IST, supported by a golden crossover of MACD, and the POL price formed a moving channel.
- The channel broke out to the downside at 11:30 IST, supported by a death crossover of MACD. POL price spiked to the downside and formed a range.
- The range broke out to the upside at 12:45 IST, supported by a golden crossover of MACD, and formed an expanding triangle pattern. The expanding triangle pattern marked the high for the day at $0.2818.
Polygon POL Surge: Network Growth Drives Momentum
The native token of Polygon, POL, has sparked serious attention after four hot coverage and migration reports. The largest milestone that has been achieved to date by the ecosystem is the Total Value Locked of $1.23 billion in August, which reflects an impressive year-to-year growth of institutional support and capital allocation across the decentralized finance structure of the infrastructure network.
The MATIC to POL migration has recorded remarkable completion rates, with nearly 97.83% of the holders effectively changed to the new token model. This migration minimizes the supply of legacy, thus forming POL as a central staking and governance structure to produce a mutual force of growing token values, achieving a balance between utility and circulating supply dynamics.
Stablecoin-based businesses have proven to be one of the most active spurs for acts of growth, and the volume of payments reached a high record of $2.56 billion in July. The launch of Tethered USDT0 and the gold-backed XAUt0 has enhanced the role of Polygon as a choice settlement layer to function as a digital assets initiative and implement liquidity transactions across chains.
Technically, POL has shown positive touches of the market by surpassing the area of resistance, which is $0.25, but the coin is critically tested at the level of 0.28 and 0.27-0.28, where the historical selling pressure has been strengthened. The alignment of sound network basics with historical patterns of technical breakout is also poised to see POL in an advantageous position, even though traders can keep close track of essential support levels as well as the further TVL expansion rate as indicators of sustained momentum.
Polygon POL Positioned for Sustained Growth Amid Network Expansion
Polygon booming towards its high point of $0.2818 is a sign of both a bullish technical set up and healthy network fundamentals. 97.83% of MATIC holders moving to POL leads to supply centralization and improved governance and stakeholders, and Total Value Locked at $1.23 billion underscores increasing institutional involvement. Growth is also supported by stablecoin activity, with $2.56 billion of the payment volumes in July in the indicators of rising cross-chain demand. Technically, POL needs to be above, plus, strong above a level of support of above 0.25 and above a level of resistance of 0.27-28 levels to prove continuity of the trend. Breaking out of these areas may encourage additional progressive up-movement and breaking down may draw back to some of the pre-established support areas.


