

Polkadot showed range-driven behavior with a bullish lean throughout the session. After marking the daily low, the price broke out of a range at 06:15 UTC, supported by a Golden Cross in MACD, and formed an expanding triangle. The expanding triangle lacked a clear breakout, instead evolving into successive ranges. Each range broke to the upside, leading to a series of bullish formations, culminating in a converging triangle and a breakout channel. RSI and MACD consistently hit extremes, confirming the session’s range-bound structure, driven by short but sharp upward movements. Let’s take a look at the DOT price analysis to see the pattern formation on the chart.
DOT Price Analysis for April 29, 2025
After marking the low for the day, the DOT price formed a range, which broke out to the upside at 06:15 UTC, supported by a Golden Cross of MACD. Price spiked to the upside and formed an expanding triangle pattern. In the meantime, at 06:45 UTC, RSI moved above 70, indicating overbought market conditions and suggesting a reversal or at least a pullback in the ongoing trend. As is often the case, there was no clear breakout from the expanding triangle seen in the price; most expanding triangle patterns behave the same. A small range appeared in the price, which broke out to the upside at 16:25 UTC.

Chart 1: Analysed by vallijat007, published on TradingView, April 29, 2025
The breakout from the previous range formed another range, which again broke out to the upside at 17:35 UTC, supported by a Golden Cross of MACD. Price spiked to the upside and formed a converging triangle pattern, which again broke out to the upside at 19:00 UTC. Price spiked again and formed an upward-moving channel, which again broke out to the upside at 21:50 UTC. DOT coin shows trading range behavior with a bullish bias, meaning it is usually in a trading range with some bullish momentum. RSI and MACD continuously hitting their extremes typically suggest a range-bound market.
What Are the Key Levels to Watch
In the early hours at 01:10 UTC, DOT coin marked the high for the day at $4.313 and formed a range. The range broke to the downside at 04:40 UTC, supported by a Death Cross of MACD. If the downside DOT breakout succeeds, then the price may drop to the level of $4.150. If the downside breakout fails and DOT coin breaks out from the range to the upside, then the DOT price may reach $4,400, which is currently acting as a resistance level. A lack of momentum in the price may lead the DOT price into a larger trading range. Traders and investors should be cautious before taking a breakout trade.
DOT Eyes Breakout, But Momentum Slows
The DOT price currently trades within a range after marking a session high near $4.313. A breakdown from the current structure, supported by a recent Death Cross in MACD, could push the price toward $4.150. However, if the downside breakout fails and the price reverses upward, the next resistance is $4.400. Given the choppy action and repeated reversals, traders should be cautious of false breakouts. DOT’s current structure favors range-bound movement with mild bullish undertones. The price may remain trapped in a consolidation without substantial volume or momentum. Confirmation is key before entering DOT breakout trades on either side.
Polkadot Price Analysis of May 1, 2025
An expanding triangle appeared in Polkadot, which broke out to the downside at 05:00 UTC, supported by a Death Cross of MACD. The Polkadot price spiked to the downside and formed another expanding triangle pattern. The second expanding triangle broke out to the upside at 09:15 UTC, supported by a Golden Cross of MACD. Price moved to the upside and formed a range, which again broke out to the upside at 10:35 UTC, also supported by a Golden Cross. Price continued pushing higher and formed another narrow range.
Meanwhile, at 07:45 UTC, RSI dropped below 30, indicating oversold market conditions and suggesting a reversal or pullback. The narrow range broke out to the downside at 12:00 UTC, supported by a Death Cross of MACD. The DOT price spiked to the downside and marked the low for the day at $4.025. At 12:35 UTC, RSI again dropped below 30, reinforcing the oversold signal and suggesting a potential reversal from the bearish momentum.

Chart 2: Analysed by vallijat007, published on TradingView, May 1, 2025
Polkadot formed a resistance area at $4.100, which acted as a strong barrier and pushed the price lower each time DOT coin tried to break it. On the fifth attempt, Polkadot broke the resistance at 20:10 UTC, supported by a Golden Cross, but the upside DOT breakout quickly faded, and the price dropped back into the range. At 20:25 UTC, RSI moved above 70, indicating overbought market conditions and again suggesting a pullback.
Polkadot’s Consolidation Phase Nears Breakout Decision
A range appeared in price, which broke out to the downside at 04:00 UTC, supported by a Death Cross of MACD. Price spiked to the downside but failed to form a strong trend, and instead, price moved back to the upside, creating a minimal range, which broke out to the upside at 07:20 UTC, supported by a Golden Cross of MACD.
Price spiked to the upside and formed an upward-moving channel, which marked the high for the day at $4.177. If this breakout succeeds, Polkadot could continue pushing higher and may reach the psychological level of $4.500. If the DOT breakout fails, Polkadot may drop back to $4.000. And mark the continuation of the consolidation phase of the DOT.
DOT mostly traded within a well-defined consolidation zone, between a high of around $4.200 and a low of $4.050. This marks a consolidation phase in Polkadot’s price. When such phases build up, they often lead to strong breakouts. Traders and investors should remain cautious before placing trades until Polkadot establishes a clear trend to either side. And the strong trend could only be established beyond the key support and resistance levels.
MACD Crossovers Signal DOT’s Volatility – Will $4.50 Be Next?
The DOT price moved through several key patterns, expanding triangles, ranges, and channels within a $4.050–$4.200 consolidation zone. Multiple MACD crossovers and RSI extremes signaled breakout and reversal points. Despite attempts to break resistance at $4.100 and $4.200, momentum faded. If sustained, the current DOT breakout from an upward-moving channel near $4.177 could push DOT coin toward $4.500. Otherwise, a return to $4.000 is likely. Traders should watch for a confirmed move beyond this range before entering new positions.
Polkadot (DOT) Price Analysis of May 25, 2025
The session opened with an upward moving trendline that had already marked the day’s high at $4.560, but that trend soon lost momentum. A breakdown occurred at 00:40 UTC, supported by a MACD death crossover, which led to a drop into a downward channel. As RSI entered oversold territory, a rebound was triggered, and Polkadot price began cycling through a series of patterns, including converging triangles, ranges, and channels. Despite several golden MACD crossovers fueling temporary spikes, most upward moves lacked sustained follow-through. The day’s low was set at $4.426 before another upside DOT breakout initiated a recovery and a new range formed.
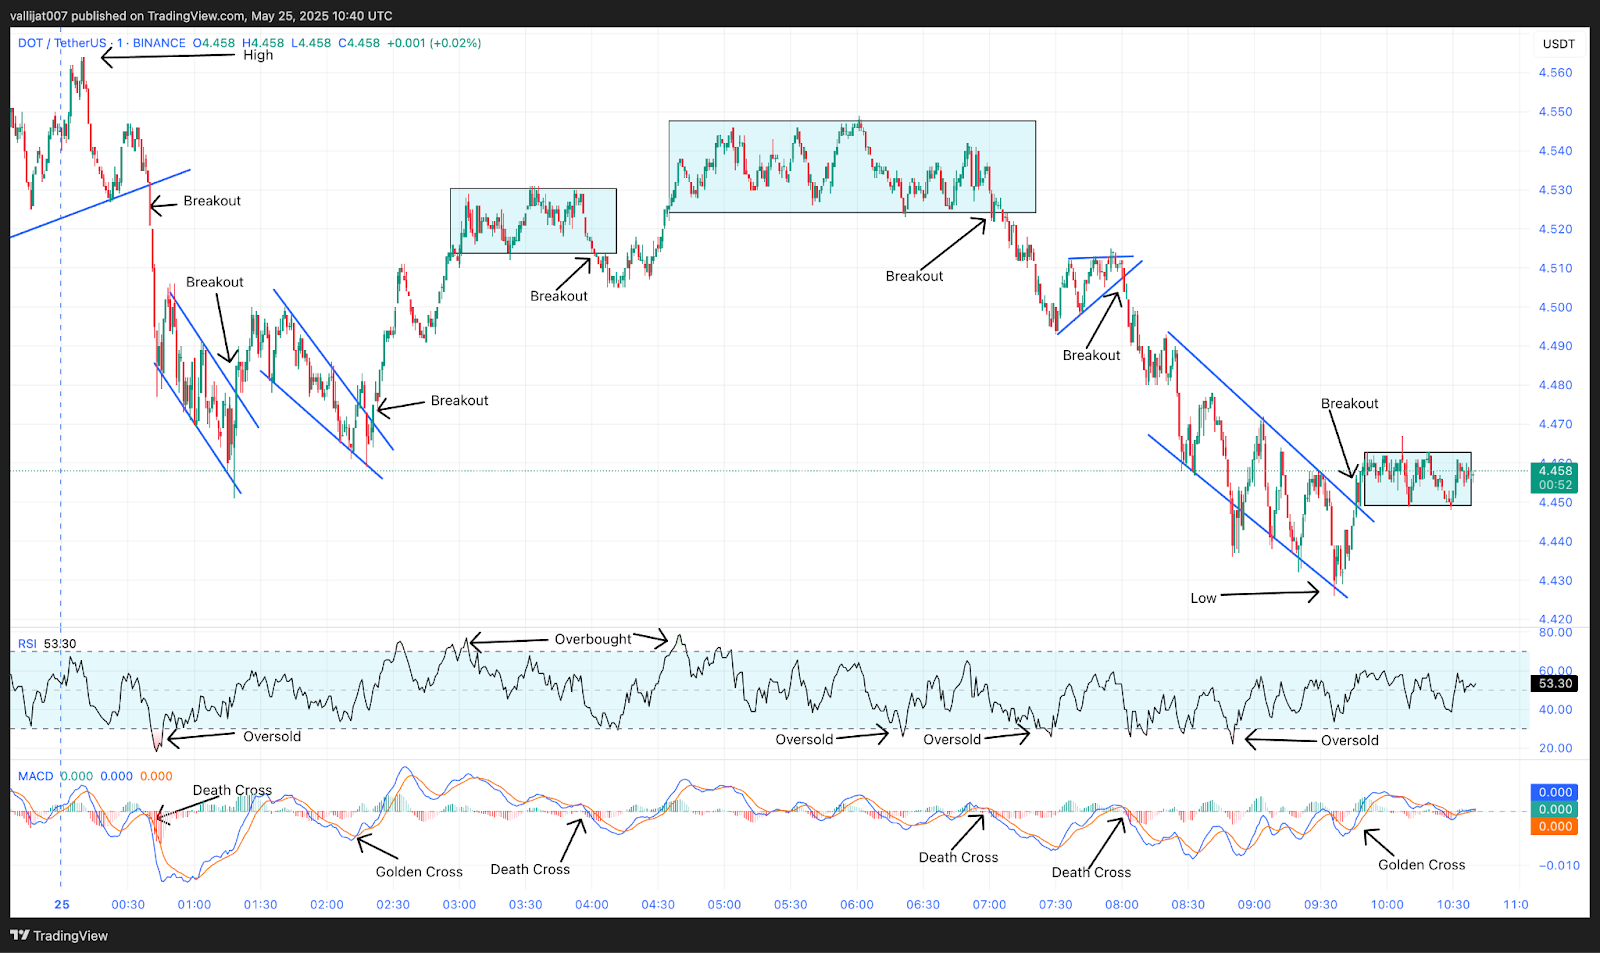
Chart 3: DOT/USDT M1 Chart, Analysed by vallijat007, published on TradingView, May 25, 2025
An upward-moving trendline appeared in the Polkadot price, which already marked the high for the day at $4.560. The upward-moving trendline broke out to the downside at 00:40 UTC, supported by a death crossover of MACD. DOT price moved to the downside and formed a downward-moving channel. In the meantime, at 00:45 UTC, RSI dropped below the level of 30, indicating an oversold market condition, suggesting a reversal or at least a pullback. The downward-moving channel broke out to the upside at 01:20 UTC, supported by a golden crossover of MACD. Price moved to the upside and formed a downward-moving converging triangle.
MACD Crossovers Signal Continued Volatility
The converging triangle broke out to the upside at 02:20 UTC, supported by a golden crossover of MACD. Price spiked to the upside and formed a range. The range broke out to the downside at 04:01 UTC, supported by a death crossover of MACD. Price spiked to the downside but failed to follow through. Instead, the price reversed to the upside and formed another range. In the meantime, at 04:40 UTC, RSI moved above the level of 70, indicating an overbought market condition, suggesting a reversal or at least a pullback. The range broke out to the downside at 07:00 UTC, supported by a death crossover of the MACD.
Polkadot price dropped to the downside and formed a converging triangle pattern. The converging triangle pattern broke out to the downside at 08:01 UTC, supported by a death crossover of MACD. Price moved to the downside and formed a downward-moving channel. The downward-moving channel marked the low for the day at $4.426. The downward-moving channel broke out to the upside at 09:46 UTC, supported by a golden crossover of MACD. Price spiked to the upside and formed a range. If the range breaks out to the upside, then the price may rise to the level of $4.6000. If the DOT breakout fails, the Polkadot price may drop to the level of $4.300.
Polkadot Price Coils Between Key Levels with Momentum Fading
After a series of alternating breakouts, the Polkadot price remains range-bound between support at $4.426 and resistance near $4.560. With the current range forming post-recovery, the next move hinges on follow-through strength. A successful breakout to the upside could push price toward $4.600, extending the recovery. However, another failed breakout or a rejection could drag price back down toward the $4.300 area. Given the repeated MACD crossovers and RSI extremes, the market is showing signs of exhaustion. Traders should stay cautious and await confirmation, as the DOT price may continue consolidating unless momentum returns with volume behind it.
Polkadot (DOT) Price Analysis of May 31
The Polkadot token started the session under pressure, initially marking a session low before recovering into an upward-moving channel. The early rebound was short-lived as the Polkadot price lost momentum and transitioned into a sequence of ranges and patterns without clear follow-through. Throughout the session, the MACD signaled multiple golden and death crossovers, but most DOT breakouts lacked sustainability. Repeated attempts at establishing a trend failed as DOT alternated between brief rallies and swift corrections, reflecting overall market indecision. Despite multiple structural shifts, including triangle patterns and channel breaks, volatility remained controlled, and no dominant trend emerged.
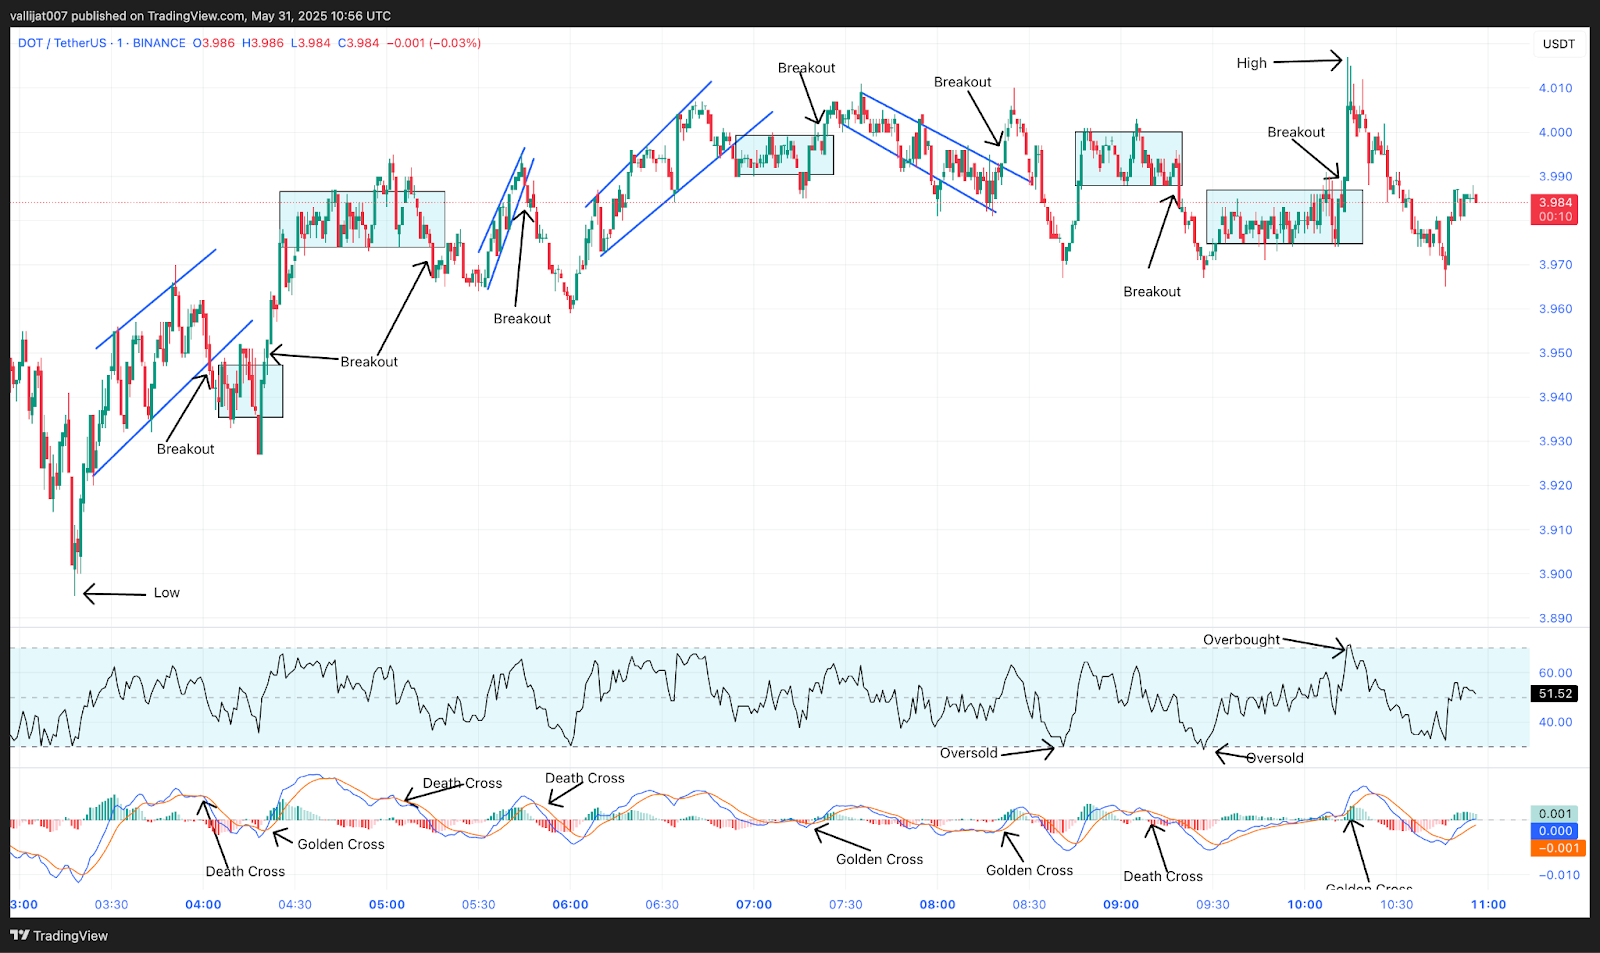
Chart 4: DOT/USDT M1 Chart, Analysed by vallijat007, published on TradingView, May 31, 2025
Polkadot price marked the low for the day at $3.895. After marking the low, the DOT price rose to the upside and formed an upward-moving channel. The channel broke out to the downside at 04:02 UTC, supported by a death crossover of MACD, and formed a range. The range broke out to the upside at 04:20 UTC, supported by a golden crossover of MACD, and formed another range. The second range broke out to the downside at 05:15 UTC, supported by a death crossover of MACD, but the downside DOT breakout did not sustain, and the price rose to the upside, forming a converging triangle pattern.
Golden Cross Breakout Rejected at $4.017 High
The converging triangle pattern broke out to the downside at 05:46 UTC, supported by a death crossover of MACD, but the breakout did not sustain, and the DOT price formed an upward-moving channel. The upward-moving channel broke out to the downside at 06:53 UTC, supported by a death crossover of MACD, and formed a range. The range broke out to the upside at 07:23 UTC, supported by a golden crossover of MACD, and formed a downward-moving channel.
Supported by a golden MACD crossover, the downward-moving channel broke out to the upside at 08:22 UTC, but the trend did not continue and the price fell to the downside, forming a range. Supported by a death cross of MACD, the range broke out to the downside at 09:19 UTC. RSI fell below the level of 30 at 09:27 UTC, pointing to oversold market conditions and therefore a reversal or at least a pullback.
The Polkadot price formed another range, which broke out to the upside at 10:13 UTC, supported by a golden crossover of MACD, marking the high for the day at $4.017. In the meantime, at 10:14 UTC, RSI moved above the level of 70, indicating overbought market conditions, suggesting a reversal or at least a pullback. Polkadot shows trading range behavior in which most breakouts fail to sustain and often reverse to the other side.
Polkadot Token Lacks Trend Conviction Amid Repeated False Breakouts
Polkadot price action continues to reflect uncertainty, with most breakouts quickly reversing direction. Although both RSI and MACD provided signals throughout the session, price failed to build on either bullish or bearish momentum for long. Oversold and overbought RSI conditions highlighted intraday extremes, but without significant follow-through. The fact that DOT keeps trading within a small range indicates it is consolidating. At this stage, traders are best advised to be mindful since the price is more expected to move within the bounds than break away. A major change in the market usually needs an important event to break through its previous uncertainty.
Polkadot (DOT) Price Analysis of June 11, 2025
Polkadot price opened the day by forming an expanding triangle pattern, which triggered overbought signals as RSI moved above 70, suggesting limited upside momentum. The pattern broke to the downside at 03:00 UTC, confirmed by a death crossover of MACD, and the price began to decline. Another expanding triangle followed, but failed to break out, with RSI dropping below 30 at 05:30 UTC, highlighting oversold conditions. The price marked the low of the day at $4.097 and later climbed, eventually reaching the high of the day at $4.317. DOT then moved into a consolidation phase near $4.300 as traders awaited a breakout confirmation. Currently, Polkadot price is trading at $4.300.
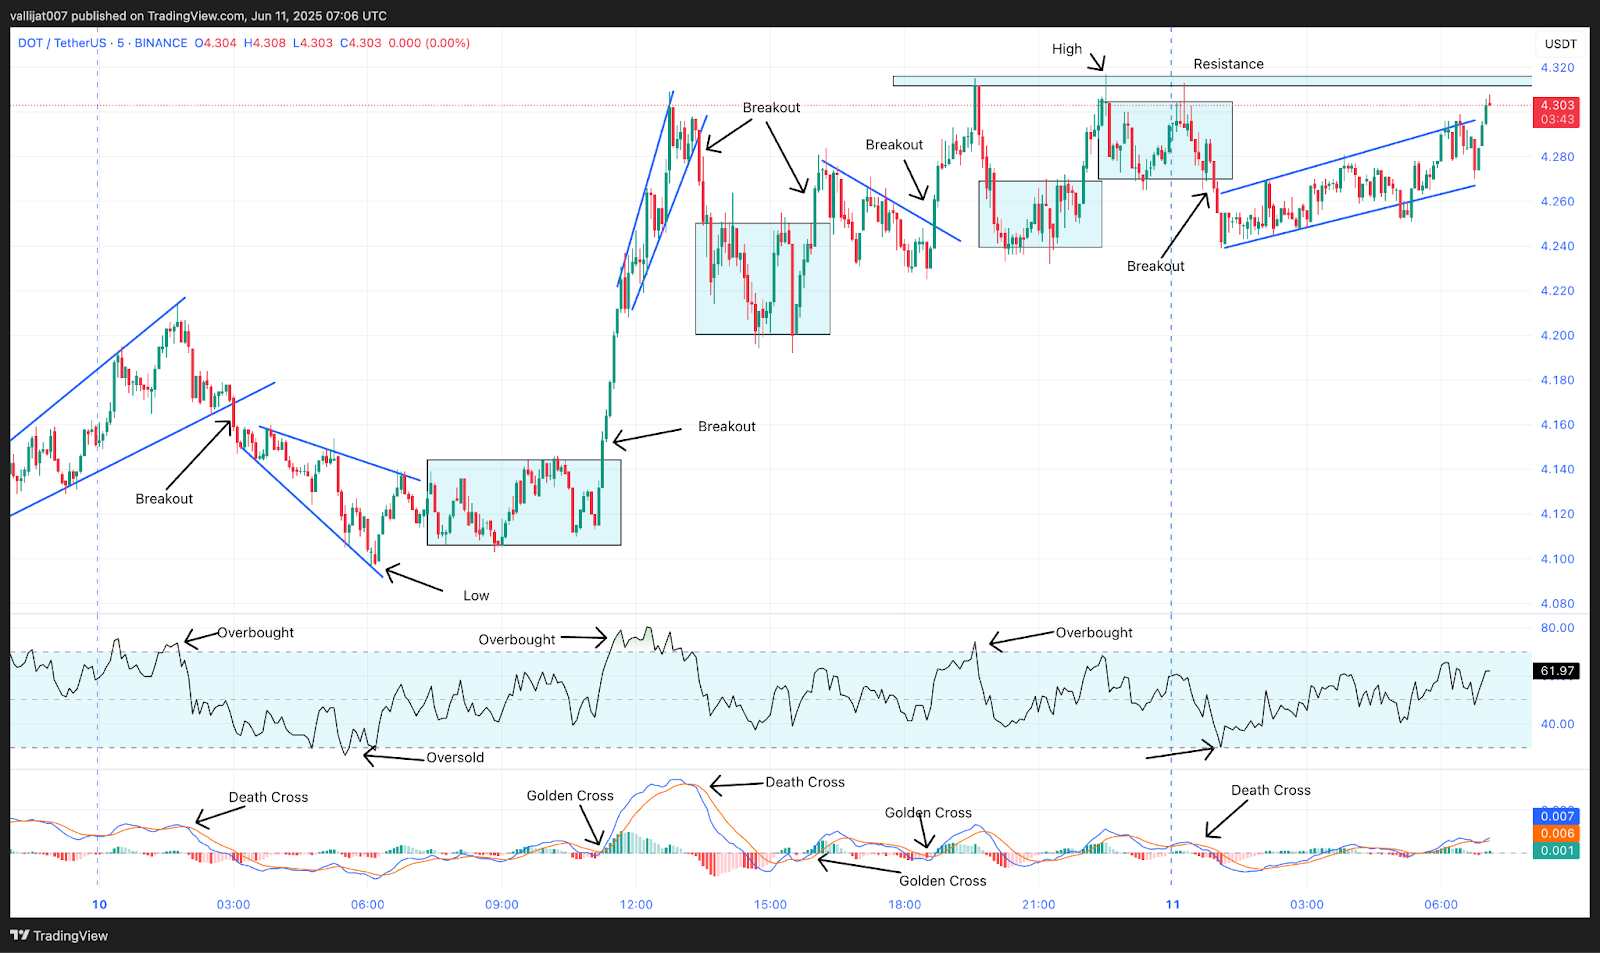
Chart 5: DOT/USDT M1 Chart, Analysed by vallijat007, published on TradingView, June 11, 2025
Polkadot price formed an expanding triangle pattern, which pushed RSI above the level of 70 at 01:35 UTC, suggesting a reversal or at least a pullback. The expanding triangle pattern broke to the downside at 03:00 UTC, supported by a death crossover of the MACD. Polkadot price moved downward and formed another expanding triangle pattern, which marked the low for the day at $4.097. At 05:30 UTC, RSI dropped below the level of 30, indicating overall market conditions suggesting a reversal or at least a pullback. The second expanding triangle pattern failed to break out to either side, and a range formed.
Range Formation Continues Amid Conflicting MACD Signals
The range broke out to the upside at 11:15 UTC, supported by a golden crossover of MACD. Price moved up and formed an upward-moving channel. At 12:00 UTC, RSI moved above the level of 70, indicating overbought market conditions. The upward-moving channel broke to the downside at 13:25 UTC, supported by a death crossover of MACD, and a range formed. The range broke out to the upside at 16:00 UTC, supported by a golden crossover of MACD, and a downward-moving trendline appeared.
Failed Breakdowns: Bearish Momentum Fades at Support
The downward-moving trendline broke to the upside at 18:40 UTC, supported by a golden crossover of MACD, and Polkadot price developed a resistance area at the level of $4.310. A new range formed, which broke out to the upside at 22:00 UTC, marking the high for the day at $4.317. As the DOT trend was unable to successfully break the resistance area, it developed another range.
The second range broke to the downside at 00:55 UTC on June 11, 2025, supported by a death crossover of MACD, but the downside Polkadot breakout quickly faded as price formed an upward-moving channel. If the channel breaks to the upside, the first resistance area it faces is $4.310. If the price successfully breaks this level, it may rise to $4.500. If the channel breaks to the downside, the Polkadot price may drop to $4.000.
$4.317 High Faces Resistance as Polkadot Stalls
DOT trend on June 11 showed a mix of volatility and indecision. Despite frequent MACD signals and RSI fluctuations, most breakouts lacked follow-through. The high for the day at $4.317 coincided with repeated failures to break above the $4.310 resistance zone, signaling that buyers lack conviction at higher levels. The session’s low near $4.000 remains a potential support zone if downside resumes. The recent upward-moving channel suggests a short-term bullish structure, but confirmation above resistance is essential for any sustained move. Traders should monitor Polkadot breakouts carefully, as current conditions favor quick reversals and consolidation over trend continuation.
Polkadot (DOT) Price Analysis of June 24, 2025
Polkadot price started on June 24, 2025, by forming a converging triangle pattern, with a failed downside breakout at 00:55 UTC that led to bullish momentum. A golden crossover of MACD at 05:10 UTC pushed the price into an upward-moving channel, followed by a range that registered the session’s first overbought RSI signal. The price later fluctuated between bullish and bearish structures, marked by multiple MACD crossovers and extreme RSI levels. Polkadot trend established the daily low at 15:25 UTC and eventually surged to a high of $3.474 by 05:15 UTC. Polkadot trend is currently trading at $3.450.
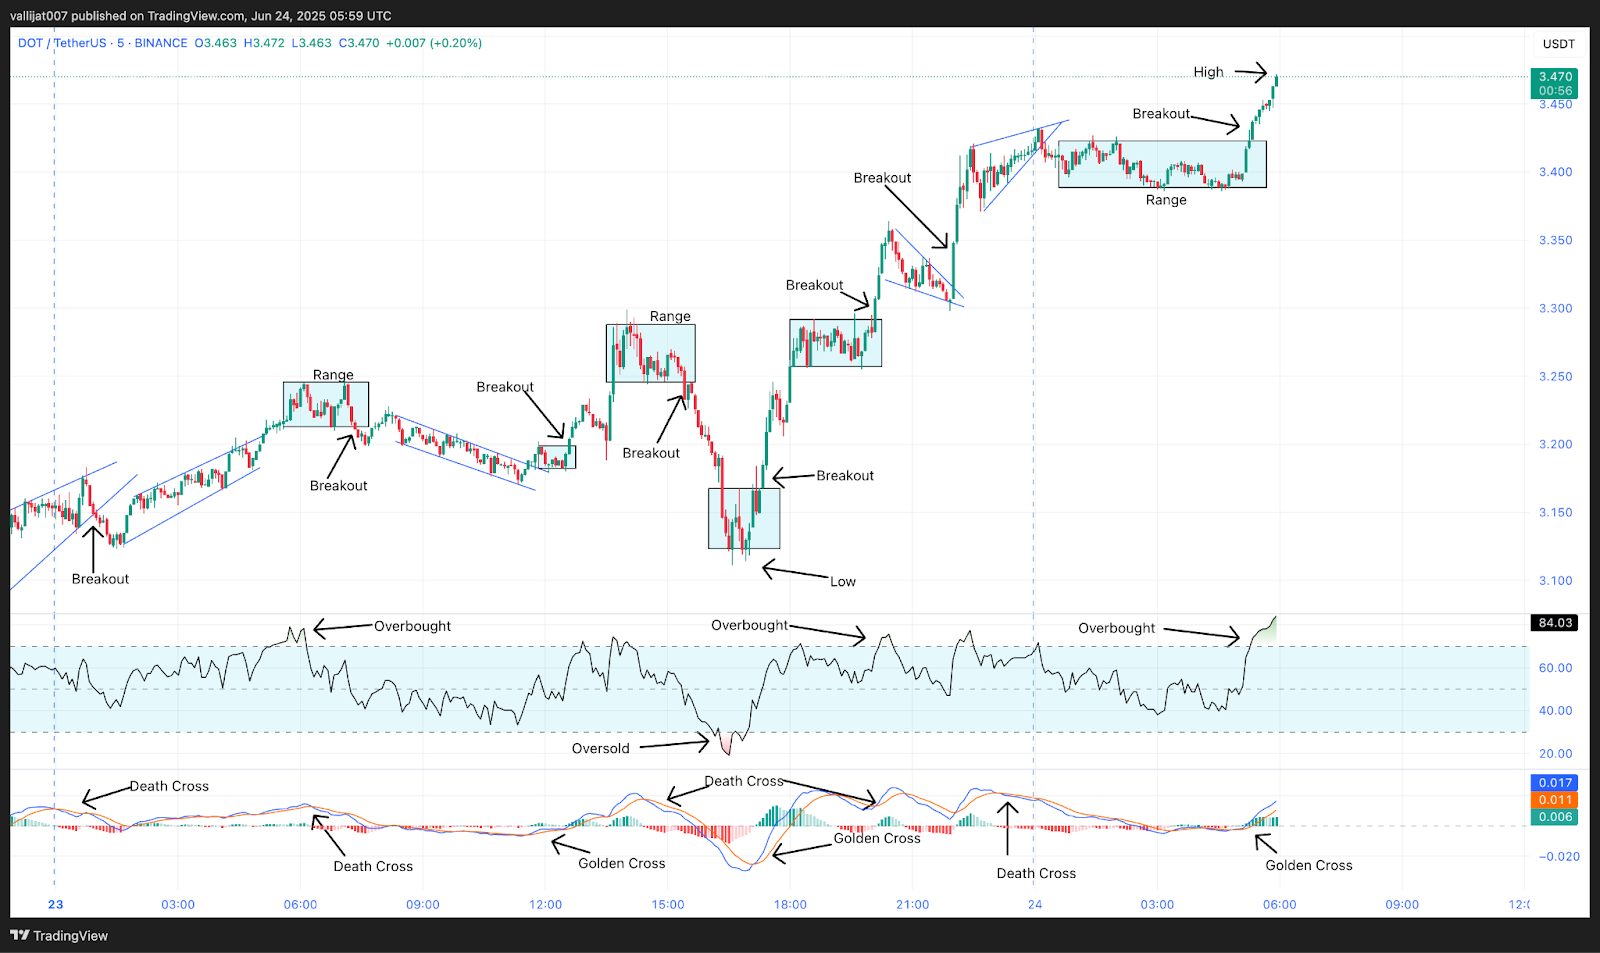
Chart 6: DOT/USDT M5 Chart, Analysed by vallijat007, published on TradingView, June 24, 2025
Polkadot price formed a converging triangle pattern. The converging triangle pattern broke out to the downside at 00:55 UTC, supported by a death crossover of MACD, but the downside breakout failed, and Polkadot trend formed an upward moving channel. The upward-moving channel broke out to the upside at 05:10 UTC, supported by a golden crossover of MACD, and formed a range. At 05:45 UTC, RSI moved above the level of 70, indicating overbought market conditions, suggesting at least a pullback.
Initial Range Breakdown at 07:20 UTC Forms Bearish Channel
The range broke out to the downside at 07:20 UTC, supported by a death crossover of MACD, and formed a downward-moving channel. The downward-moving channel broke out to the upside at 11:40 UTC, supported by a golden crossover of MACD, and formed a range. At 12:35 UTC, driven by a golden MACD crossover, the range broke upward and established another range. RSI crossed the 70 level at 13:40 UTC, pointing towards oversold market conditions and implying a comeback or at least a correction.
Daily Low Established Following Range Breakdown at 15:25 UTC
The range broke out to the downside at 15:25 UTC, supported by a death crossover of MACD, marking the low for the day. At 16:30 UTC, RSI dropped below the level of 30, indicating oversold market conditions, suggesting a reversal or at least a pullback. After marking the low for the day, the Polkadot token formed a range. The range broke out to the upside at 17:20 UTC, supported by a golden crossover of MACD, and formed another range. The range again broke out to the upside at 20:05 UTC, supported by a golden crossover of MACD, and formed a converging triangle pattern.
At 20:25 UTC, RSI moved above the level of 70, indicating overbought market conditions. The converging triangle pattern broke out to the upside at 22:00 UTC, supported by a golden crossover of MACD, and formed another converging triangle pattern. The second converging triangle pattern broke out to the downside at 00:10 UTC on 24 June 2025, supported by a death crossover of MACD, and formed a range. The range broke out to the upside at 05:15 UTC, supported by a golden crossover of MACD, marking the high for the day at $3.474.
Bullish Surge to $3.474 Faces Resistance After RSI Overheat
After marking a low in the afternoon session, Polkadot price regained bullish strength, supported by golden MACD crossovers and repeated range breakouts. Early June 24, with overbought RSI readings at 20:25 UTC, the rally topped $3.474. Although this breakout confirms strong intraday momentum, the recurring RSI extremes point to little upside potential unless new volume supports the move. If the present range concludes higher, DOT could approach the $3.550 mark. A breakdown, though, might cause the Polkadot token to fall back toward the $3.300 support level. Traders should watch MACD and RSI carefully for signals confirming trends or reversing.


