As the native token of Pump.fun, the viral platform democratizing meme coin creation. PUMP embodies the hyper-liquidity dynamics of its ecosystem. This analysis tracks PUMP price action through three unique lenses. Platform revenue burns, newly launched coin correlations, and the token’s distinctive “sawtooth” volatility patterns around major platform updates. We identify critical liquidity zones while analyzing the unusual 5-minute RSI behavior characteristic of its microcap peers. PUMP’s value is directly tied to meme coin mania cycles. This technical framework helps traders navigate its reflexive nature. Where platform activity fuels token demand, which in turn drives more activity.
PUMP Price Analysis of October 1, 2025
PUMP price action initiated a feeble down-side breakout from 03:25 IST, supported by a death cross of MACD that drew the day’s low $0.005837. Price regained momentum and broke up at 06:55 IST on a golden cross of MACD, forming an upward converging triangle. At 2 am IST, the triangle broke up again, driving PUMP to a high of $0.006965. Resistance has since formed near $0.006900. If this level is broken, PUMP could drive over $0.007000. If resistance holds, price risks dropping toward $0.005800 as buyers seek new entries.
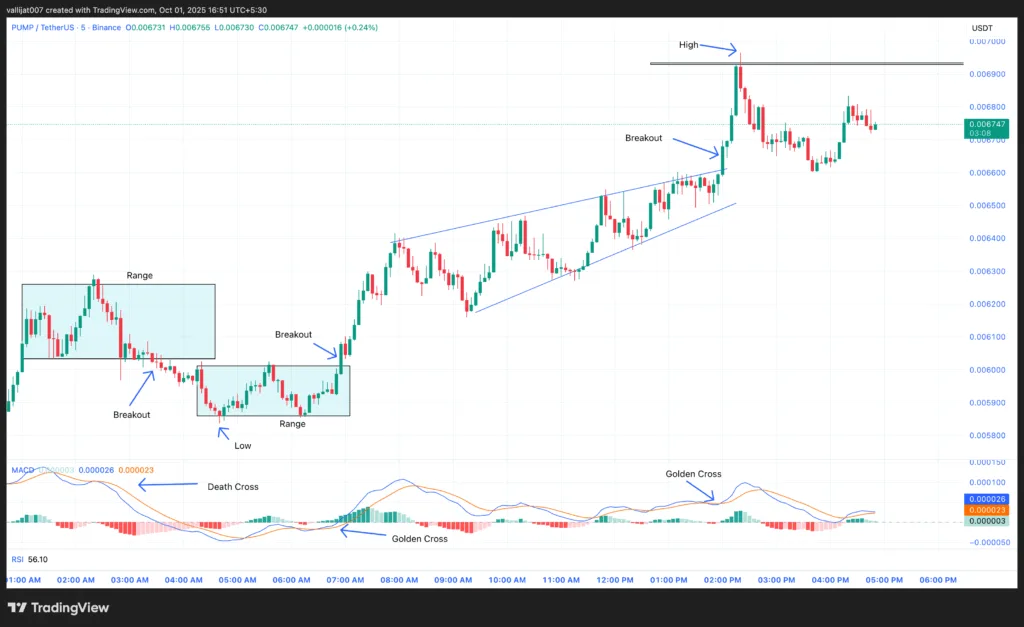
Chart 1: PUMP/USDT M5 Chart, Analysed by Vallijat007, published on TradingView, October 1, 2025
PUMP price has formed a range, which it broke out to the downside at 03:25 IST on the back of a death crossover of MACD. But momentum was weak and price stamped the day’s low at $0.005837. Post low, the PUMP price established another range, which broke out to the upside at 06:55 IST, on the back of a golden cross of MACD, and evolved into an upward-moving converging triangle pattern.
It was this converging triangle that broke out to the upside at 02:00 IST, supported by a golden cross of MACD, with PUMP price marking the high for the day at $0.006965. After tagging the high, the price pulled over to the downside, forming resistance at $0.006900.
If the PUMP price breaks the resistance area, then it could be another high and break above $0.007000.If the price doesn’t break the resistance, it can fall to $0.005800 to meet new buyers.
PUMP’s Bull Run Fueled by HTX Listing, Buybacks, and Market Rotation
PUMP token got listed on HTX (previously Huobi) on Oct 1, 2025, increasing its reach to 18+ million users & pushing its 24-hr volume up 57.5% to $809.8 million. HTX represented roughly 20% of this trading inflow, with its deep derivatives liquidity enhancing spot market momentum and forming a virtuous circle. Meanwhile, Pump.fun conducted a significant buyback on September 21, repurchasing 278.5 million PUMP tokens with 8,302.6 SOL (~$19.26 million), funded by recent platform fees hitting $9.65 million weekly.
This buyback pared the circulating supply of 354 billion tokens, exerting upward pressure on PUMP price, but a 72% revenue decline last week questions the buyback’s sustainability if platform activity decelerates. Market moves see traders rotating into high beta altcoins, BTC dominance 58.1% PUMP lept ahead on Solana’s memecoin infrastructure (with 24,000+ holders of PUMP 10K+ tokens) and the bounce in Solana TVL to $11.3BN. But competition from newer launchpads like BonkFun and a 52% month-on-month decline in new tokens minted on Pump.fun are risks. Big whale stack, along with 130m PUMP bought August 30, says PUMP is positioning for Q4. Overall, the rally mixes buying pressure, exchange liquidity, and sector rotation, but platform revenue weakening and memecoin fatigue remain downside risks if broader market sentiment softens.
PUMP’s value depends on HTX liquidity and sustainable buybacks
PUMP’s bullish momentum has been powered by its October HTX listing, which extended reach to millions of users and increased volume, as large buybacks constricted supply and strengthened sentiment. Together with Solana’s rebounding TVL and whale accumulation, these drivers underpin upside into Q4. But risks persist: a steep revenue decline tests buyback durability, while memecoin exhaustion and competition from competing launchpads may pressure demand. The $0.006900 resistance zone will be an important near-term test; a breakout can signal a continuation move above $0.007000, while rejection can cause a pullback toward $0.005800. Liquidity will sustain, and that will determine not only the strength of the trend.
PUMP Price Analysis of September 17, 2025
PUMP price hit its day high of $0.008407 before pulling back into consolidation. The first drop defined a range that broke to the downside at 02:30 IST, backed by a death crossover of MACD. A second range subsequently took place with a break lower at 04:25 IST and a daily low of $0.007607. From there, PUMP bounced, carving out a rising channel. But the channel broke to the downside at 0830 IST with another death cross, though the move couldn’t break the earlier low. With support at $0.007610 and resistance at $0.008400, PUMP remains locked in consolidation awaiting breakout.
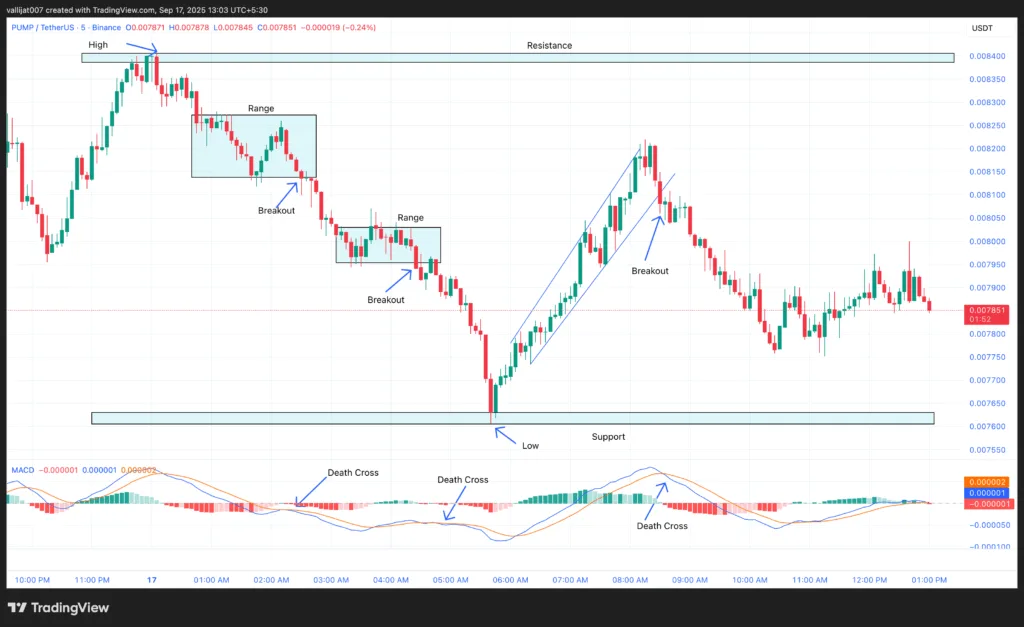
Chart 2: PUMP/USDT M5 Chart, Analysed by Vallijat007, published on TradingView, September 17, 2025
PUMP price hit the day’s high of $0.008407. After stalling at the high, price broke down and ranged. The range cracked to the downside at 2.30 IST, aided by a death crossover of MACD, with price thrusting lower and creating another range. The second range broke out to the downside at 04:25 IST, supported by a death crossover of MACD, with price spiking further to the downside and marking the low for the day at $0.007607.
When this low was marked, price rebounded to the upside and created a moving channel upward. The channel broke out to the downside at 08:30 IST, supported by a death crossover of MACD, however, the breakout could not break previous low, forming a support level at $0.007610. Price couldn’t break the high as well, forming a resistance zone at $0.008400. Once price breaks below or above these levels, it might continue to consolidate between $0.007610 and $0.008400.
PUMP Memecoin Takes Profit After All-Time High
PUMP memecoin exploded to its ATH of $0.00881 and a $3B market cap on September 14 on the back of a 70% weekly gain. But this parabolic rally probably also triggered big profit-taking from early buyers, a typical memecoin dynamic after vertical price moves. Its 24-hour trading volume fell 33.8% to $817M, indicating diminished buying appetite to maintain recent all-time highs. These sharp corrections tend to come after overheated rallies because traders rotate gains into new narratives, bolstering short-term bearish momentum. Technical indicators highlight overextension.
7-day RSI at 74.7, indicating an overbought condition with the price above the 23.6% fibo retracement level at $0.007368. These levels often serve as profit-taking areas. The MACD histogram, while still positive at +0.00039, reveals an ebbing momentum–the quintessential buy the rumor, sell the news phenomenon after PUMP’s recent press frenzy.
Platform competition is intensifying. LetsBONK.fun and other Solana memecoin platforms reclaimed 62% market share in August, pushing PUMP’s dominance. Although Pump.fun ranks first with $1.35M in daily revenue, competitive expansion may sour investor ardor. Platform token valuations typically depend on user activity, meaning ongoing market share declines may continue to weigh on PUMP. The dip is natural market mechanics post-rally, amplified by sector rotation and technical triggers. Traders will be watching to see if PUMP can hold the 23.6% Fib support to preserve its 30-day, 150% uptrend, or if profit-taking increases pace. Important statistics to follow are the 14-day RSI (74.3) and memecoin platform revenue splits this week.
PUMP Faces Pullback Risk Amid Overextension
PUMP’s big rally to new all-time highs has turned into a susceptible profit-taking/fading momentum pressure short-term outlook. Technicals verify overextension, with RSI above 74 warning of overbought areas and MACD momentum fading. Support at $0.007368 (23.6% fib) is now key battleground; failure to hold could quicken the downside to $0.007000. Meanwhile, increasing competition from Solana-based competitors like LetsBONK.fun threatens to undermine Pump.fun’s market share supremacy. Maintaining its 150% 30-day uptrend relies on retention as well as new purchases. Traders should watch for RSI cooling and platform revenue shifts this week to get a sense of directional bias.