

If you want to invest in or buy Quant and wonder what the right price to start accumulating Quant is, then you are at the right place. As we go through the analysis, we will determine different patterns and how Quant reacts to them. We will also see support and resistance, which is a good area for any instrument to buy or sell. Without any further delay, let’s dive into the Quant price analysis and explore different opportunities arising from it.
Quant Price Analysis of June 17, 2025
Quant price began with upward momentum, initially forming an expanding triangle pattern. A golden crossover of MACD at 01:50 UTC triggered a bullish Quant breakout, followed by a sequence of ranges and an upward channel. At 05:35 UTC, RSI rose above 70, signaling overbought conditions and warning of potential reversal. Despite this, the Quant price continued to climb, eventually reaching the daily high of $111.54 within a converging triangle pattern. However, sustained overbought signals and fading momentum led to a series of breakdowns later in the session. Currently, the QNT price is trading at $103.00.
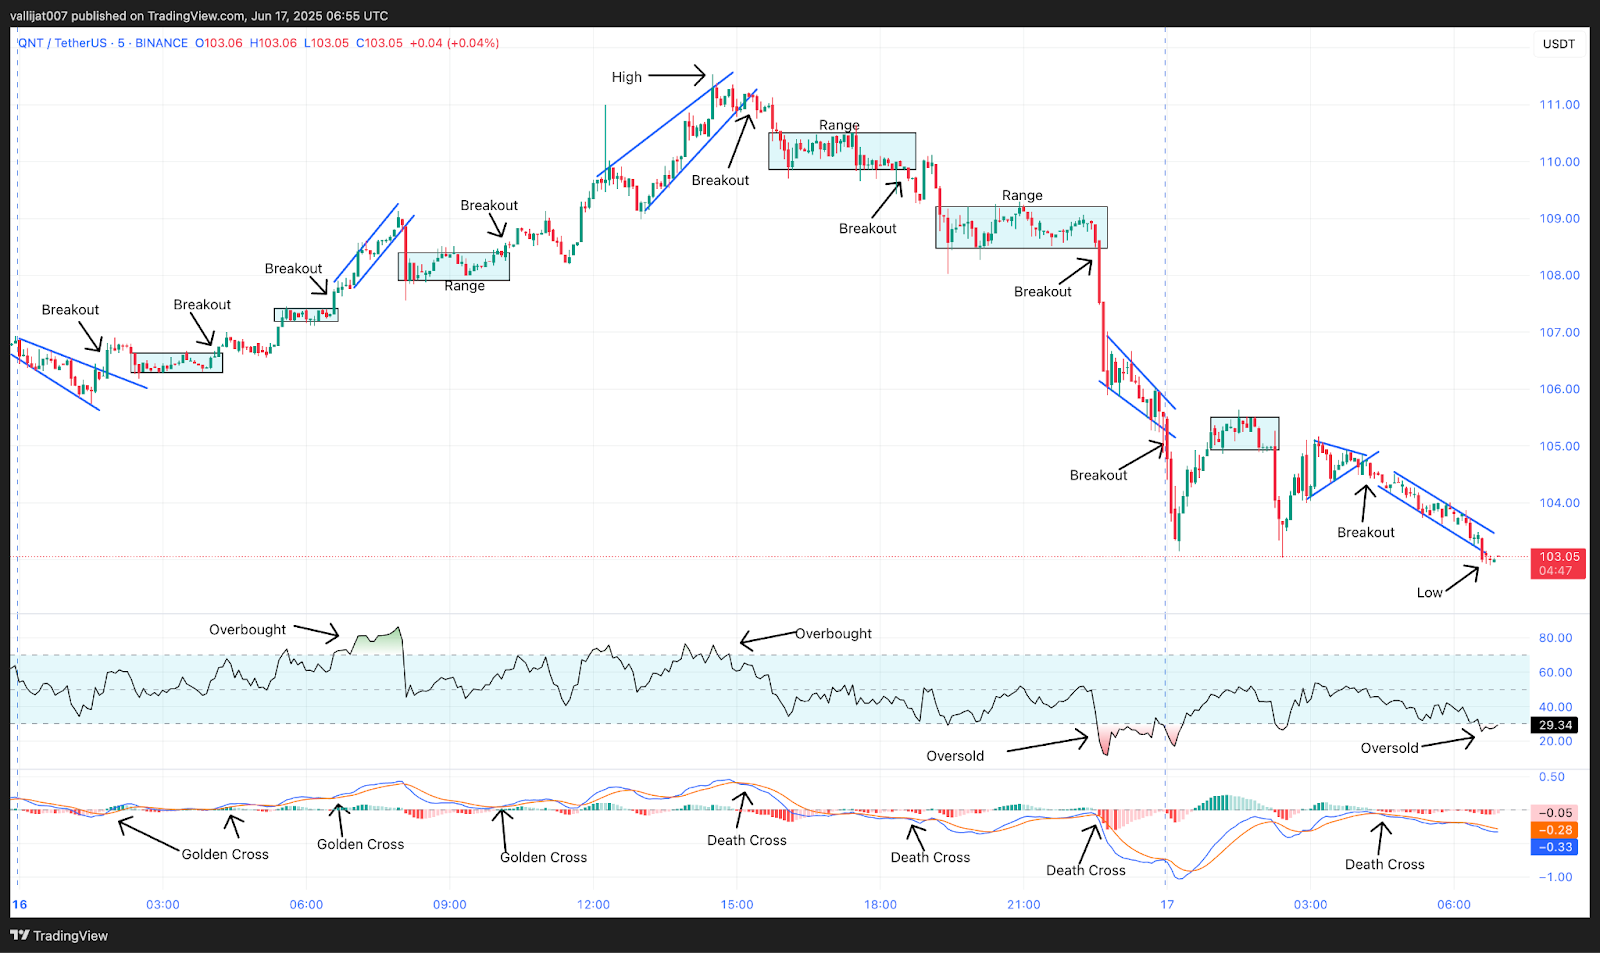
Chart 2: QNT/USDT M5 Chart, Analysed by vallijat007, published on TradingView, June 17, 2025
Quant price formed an expanding triangle pattern. The expanding triangle pattern broke out to the upside at 01:50 UTC, supported by a golden crossover of MACD, and a range followed. The range broke out to the upside at 04:10 UTC, supported by a golden crossover of MACD, and another range developed. At 05:35 UTC, RSI moved above the level of 70, indicating overbought market conditions, suggesting a reversal or at least a pullback.
Daily High Established at $111.54 Within Triangle Pattern
The range broke out to the upside at 06:35 UTC, supported by a golden crossover of MACD, and formed an upward-moving channel. That upward-moving channel broke out to the downside at 08:05 UTC, supported by a death crossover of MACD, and a range developed. The range broke out to the upside at 10:10 UTC, supported by a golden crossover of MACD, and formed a converging triangle pattern. The converging triangle pattern marked the high for the day at $111.54. At 14:30 UTC, RSI again moved above the level of 70, indicating overbought market conditions.
Oversold RSI Signal at 22:40 UTC Fails to Reverse Trend
The converging triangle pattern broke to the downside at 15:25 UTC, supported by a death crossover of MACD, and a range followed. The range broke out to the downside at 18:35 UTC, supported by a death crossover of MACD, and another range formed. The range again broke out to the downside at 22:35 UTC, supported by a death crossover of MACD, and formed a converging triangle pattern. At 22:40 UTC, RSI dropped below the level of 30, indicating oversold market conditions, suggesting a reversal or at least a pullback.
The converging triangle pattern broke out to the downside at 00:00 UTC on 17th June 2025, supported by a death crossover of MACD, and a range followed. The range broke out to the downside at 02:15 UTC, supported by a death crossover of MACD, and formed another converging triangle pattern. The converging triangle pattern again broke out to the downside at 04:15 UTC, supported by a death crossover of MACD, and formed a downward-moving channel. The downward-moving channel marked the low for the day at $102.96.
$102.96 Low Confirms Bearish Reversal from $111.54 High
The Quant price action displayed early strength but failed to maintain upward traction after peaking at $111.54. Multiple death crossovers of MACD and RSI dips below 30 indicated growing bearish pressure throughout the session. A breakdown from the final converging triangle pattern at 04:15 UTC led to a downward-moving channel, establishing the day’s low at $102.96. This shift from overbought to oversold conditions reflects a clear reversal. If the bearish momentum continues, QNT price could test the $100.00 support zone. Otherwise, a rebound may retarget resistance near $108.00–$110.00.


