

Raydium (RAY) exhibits volatile price action tied to Solana ecosystem activity, often amplifying SOL’s movements during DeFi surges. As a concentrated liquidity DEX token, RAY price shows heightened sensitivity to liquidity pool incentives and trading volume spikes. Key support/resistance levels typically form around psychological price points aligned with TVL milestones. The token displays hybrid behavior, combining governance token patterns with yield-farming volatility. Breakouts gain validity when confirmed by on-chain volume and new pool creations. Traders should watch SOL correlation while accounting for Raydium’s unique liquidity model, which can accelerate both rallies and corrections. Technical signals strengthen when paired with real-time monitoring of pool allocations and SOL pair dynamics.
RAY Price Analysis of August 27, 2025
On August 27, 2025, Raydium (RAY) opened with volatility, forming an upward-moving expanding triangle pattern that broke to the downside at 05:25 IST, supported by a death crossover of MACD. This move drove the price to the daily low at $3.378. From there, RAY rebounded, breaking through resistance at $3.460 at 09:15 IST with support from a golden crossover of MACD, triggering a strong upside move. The rally extended further as a converging triangle broke out at 01:30 IST, followed by a minor channel breakout at 02:25 IST, pushing the price to the daily high of $3.693. A fresh converging triangle breakout at 03:40 IST now puts $4 in play if momentum holds, though failure could send the token back toward $3.300.
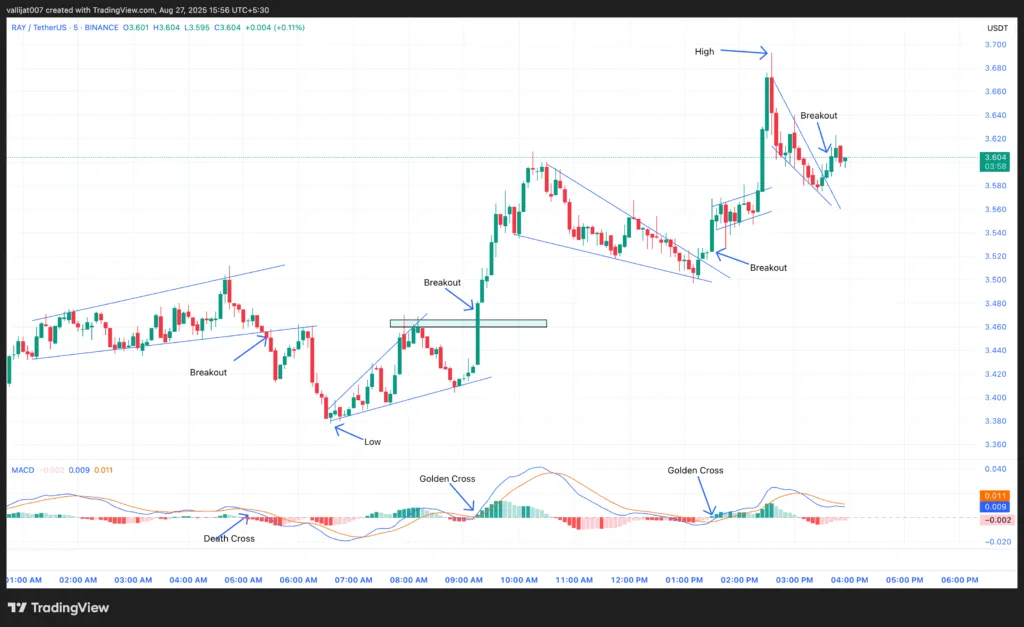
Chart 1: RAY/USDT M5 Chart, Analysed by Vallijat007, published on TradingView, August 27, 2025
- RAY price formed an upward-moving expanding triangle pattern, which broke out to the downside at 05:25 IST, supported by a death crossover of MACD. Price spiked to the downside, marking the low for the day at $3.378.
- After marking the low, the price formed another expanding triangle pattern, which created a resistance area at the level of $3.460. The resistance broke to the upside at 09:15 IST, supported by a golden crossover of MACD. The RAY price spiked to the upside and formed a converging triangle pattern.
- The converging triangle broke out to the upside at 01:30 IST, supported by a golden crossover of MACD. Price spiked to the upside and formed a minor channel. The channel broke out to the upside at 02:25 IST, supported by a golden crossover of MACD, with the RAY price spiking to the upside and marking the high for the day at $3.693.
Raydium Surges on Buybacks, Whale Moves, and Partnerships
Raydium (RAY) has significantly outpaced the broader crypto market with an over eight percent rally in the past day, driven by fundamental catalysts strengthening its DeFi footprint on Solana. A $200M buyback program has removed millions of tokens from circulation since July, creating notable deflationary pressure. With protocol fees consistently funding purchases, the reduction in supply is tightening liquidity and enhancing long-term value for token holders. Staking participation and compounding rewards further make RAY attractive to investors seeking a steady yield.
Whale activity has also underpinned this surge. Large holders have notably accumulated at critical support around $3.30, signaling confidence in technical recovery after recent dips. The token has reclaimed its thirty-day moving average, although momentum indicators suggest the need for stronger confirmation before a sustained upside continuation. Resistance levels near $3.70 remain key hurdles to watch for traders.
Beyond market dynamics, Raydium’s deeper integration with xStocks is expanding its utility. By dominating tokenized equity trading pairs such as NVDA and TSLA, the protocol is capturing the majority of Solana’s tokenized stock activity. Liquidity incentives and growing total value locked are positioning RAY as a central gateway to real-world asset exposure, with Solana’s Firedancer upgrade promising further scalability.
Raydium Balances Bullish Catalysts With Key Tests Ahead:
Raydium’s structure shows strong bullish undertones, with higher highs supported by golden crossovers and whale accumulation at $3.30 confirming investor conviction. The $3.70 zone remains immediate resistance, and a decisive break above could open the path toward $4.00. On the downside, $3.30 stands as the key support to defend. Fundamentally, buybacks and staking growth continue to create scarcity and yield incentives, while Raydium’s integration with tokenized equity markets expands real-world utility on Solana. With momentum riding on both technical and ecosystem drivers, RAY’s next move hinges on whether buyers can sustain pressure above the $3.70 resistance band.
RAY Price Analysis of August 10, 2025
RAY price marked the low for the day at $2.980. After marking the low, the price formed an upward-moving channel. The channel broke out to the downside at 03:00 IST, supported by a death crossover of MACD, pushing the RAY price to the downside, but with weak momentum. Price then developed a range.

Chart 1: RAY/USDT M5 Chart, Analysed by Vallijat007, published on TradingView, August 10, 2025
- The range broke out to the upside at 06:15 IST, supported by a golden crossover of MACD, using bullish momentum to mark the high for the day at $3.589.
- Price then formed an upward-moving trendline, which broke out to the downside at 09:40 IST, supported by a death crossover of MACD, pushing RAY price down and forming a downward-moving channel.
- The downward-moving channel attempted breakouts in both directions but failed, leading to another range. The range broke out to the upside at 15:15 IST, supported by a golden crossover of MACD.
- If the breakout succeeds, the RAY price may mark another high and reach $3.750. If the breakout fails, the price may drop to $3.100, which acts as support for RAY.
Raydium’s Triple Catalyst Surge: Buybacks, Institutional Demand & Technical Breakout
Raydium (RAY) is experiencing a transformative phase, driven by three powerful catalysts that could redefine its market position. The platform’s LaunchLab token launch platform has become a revenue powerhouse, generating $900k in daily fees, surpassing swap fees for the first time. With 12% of fees funding daily R$900k in buybacks (~$110k/day), this creates a 6% annualized yield at current prices, structurally supporting the token.
The partnership with xStocks introduces a groundbreaking use case, positioning Raydium as the primary DEX for tokenized equities like Tesla and S&P 500. While this attracts TradFi liquidity (xStocks processed $2B+ volume since June), regulatory exposure in restricted markets (27% of crypto cap) remains a watchpoint.
Technically, RAY has confirmed a bullish breakout, reclaiming its 200-day SMA ($2.99) and surging past $3.50 resistance with a 435% volume spike. With whale accumulation detected and the $3.82 Fib extension as the next target, momentum appears strong, though MACD warns of potential consolidation.
Critical question: Can Raydium sustain above $3.30 support to convert this trifecta of catalysts into lasting upside? The combination of organic buyback pressure, institutional-grade liquidity, and technical strength makes RAY one of Solana’s most compelling narratives.
Raydium Rides Triple Catalyst Wave Toward Key Resistance:
Raydium’s technical resilience is reinforced by three strong fundamentals: record LaunchLab revenues, daily token buybacks, and institutional traction through xStocks tokenized equities. With $900k in daily fees and 12% funneled to buybacks (~$110k/day), RAY enjoys structural support that could sustain bullish momentum. Breaking past $3.50 with a 435% volume spike and reclaiming its 200-day SMA signals technical strength, but consolidation risk remains if $3.30 support falters. Whale accumulation and a $3.82 Fibonacci target suggest upside potential, provided buyback pressure and institutional flows persist. The question now is whether RAY can turn these catalysts into a sustained breakout run beyond short-term resistance.


