

Have you been watching the Sandbox price charts and wondering if a significant move is coming? If yes, you are in the right place. The analysis of the SAND token performance during the previous day will focus on significant market developments. Throughout most of the day, prices stayed within a downward-sloping channel without finding a clear movement direction. A SAND Breakout above $0.300 introduced new market momentum.
Multiple golden crossovers on the MACD indicator indicated bullish momentum in the current market trend. The support area stood at $0.285 while the resistance remained at $0.315. SAND produced a lasting consolidation phase until it rose, drawing buying interest. This analysis begins by examining how the SAND price has recently performed and what possible movements are on the horizon.
SAND Price Analysis for April 28, 2025
The SAND Coin began trading yesterday at $0.3037. The Price established a downward pattern, maintaining successive lines of reduced peaks and depressed troughs. The MACD revealed a golden cross during the early hours, indicating an initial upward price movement at 01:00 UTC. The SAND price maintained its position between downward trending motions throughout the period. Multiple oversold conditions occurred on the RSI at 03:00 UTC and 06:00 UTC. However, these situations did not create enough upward force to break the trading boundaries.
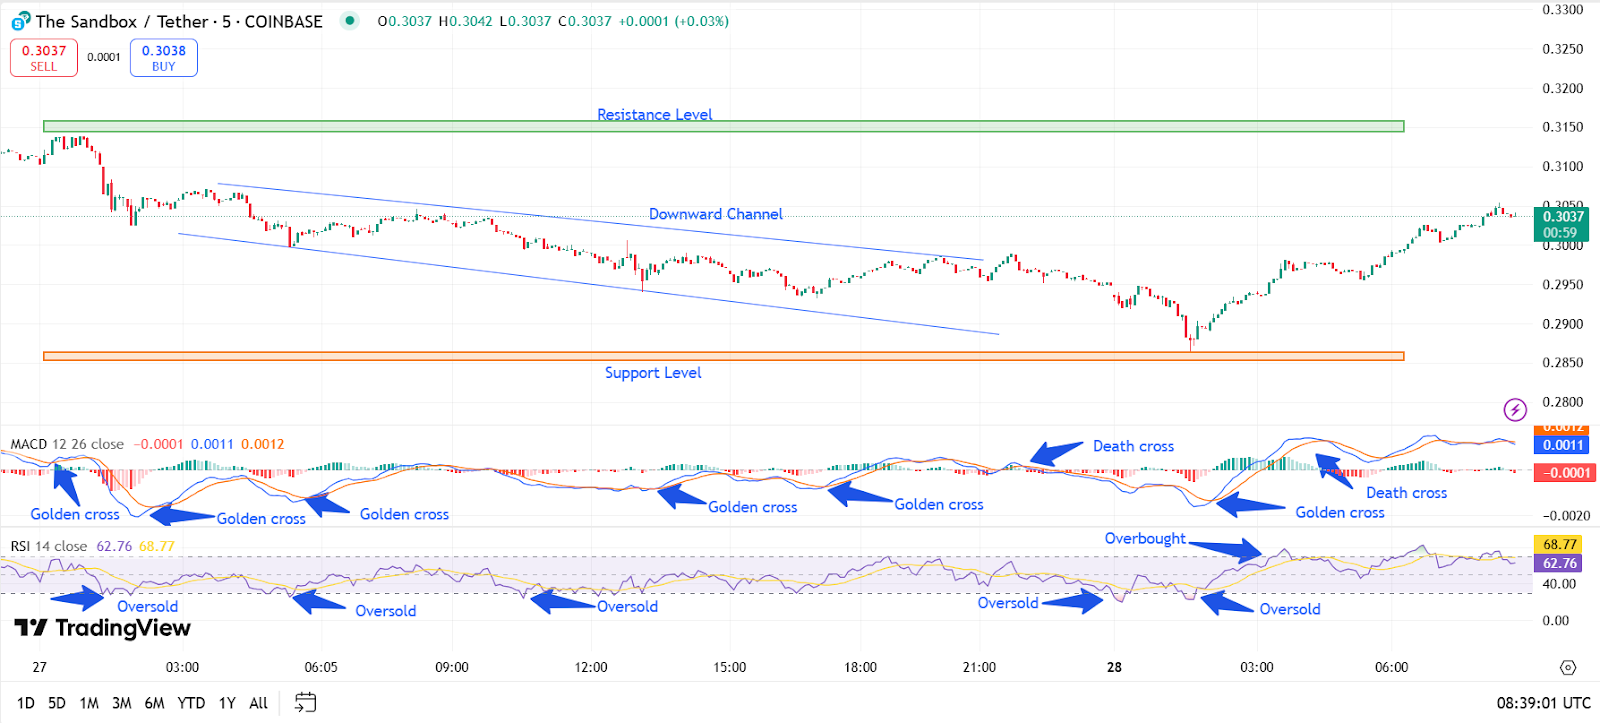
Chart 1, SAND/USDT M5 Chart, Analysed By Anushri Varshney, Published on TradingView, April 28, 2025
An emerging death cross at 18:00 UTC intensified the downward market trend. SAND Coin’s extended bear market run continued inside the channel before reaching powerful support at $0.2875, even with brief appearances of RSI oversold values and temporary MACD golden crosses.
The MACD displayed its largest golden cross near 02:30 UTC, followed by the RSI breaking through excess sell zones. The SAND Breakout began with remarkable strength at this time. The price of SAND Coin rose quickly, breaking through the downward trend channel. The MACD death cross briefly developed after the bullish price movement continued steadily. The market price of the SAND token maintained an upward progression, reaching $0.3038 when we published this article, while it remained above its past resistance.
SAND Breakout Propels Price Above $0.303?
Today, the SAND price traveled into a downward channel for a decisive breakout. SAND Coin found support to be near $0.285, and resistance to it was around $0.315. Multiple golden crosses on the MACD show that the momentum is bullish. Several RSI oversold signals confirmed a lot of buying pressure. After the breakout, the price steadily climbed above $0.303. The last golden cross on the MACD strengthened the bullish move at 05:45 UTC. RSI remained in overbought territory, reflecting a strong momentum. Though the SAND Breakout was crystal clear, buyers ended the session in green after reclaiming the support levels.
What Future Holds For SAND?
SAND Coin depicts an established downward channel within which price action has consistently given respect to the support zone near $0.287 and faces resistance around $0.315. Multiple MACD golden crosses indicate a short-term bullish momentum for the recurrent engagement of the price action with the resistance. Meanwhile, intermittent death crosses signal some selling pressure periods and some caution. The RSI often reaches the oversold territory, indicating solid buying interest and possibly a reversal point near the support.
Notably, just above the downward channel, the breakouts now indicate reconciled market sentiment and the potential for a slight reversal of trends. For a bullish continuation toward the $0.315 resistance, it is essential now to sustain above $0.300. A violation of this level would invite fresh testing of support. The technical indicators remain cautiously optimistic for the SAND token, where price action around the key levels will dictate the next directional move.
SAND Price Analysis of April 30th, 2025
SAND price maintained a stable trading pattern during yesterday’s initial hours as price movements stayed confined within $0.2879 to $0.3035. Price action showed no strong movements that could be classified as aggressive directional changes. The RSI indicator maintained a position close to 50, indicating unpredictable trends. A death cross appeared on the MACD around 01:50 UTC, but had minimal strength because the volume levels remained weak. At 06:30 UTC, SAND Coin experienced a brief upward move when its RSI touched oversold territory, thus driving the price within the consolidation area.
From 06:00 to 15:00 UTC, SAND tried multiple times to rise through the $0.3050 resistance but closed before it each time. A golden cross signal on the MACD at 11:05 UTC created fresh bullish momentum that pushed the price to $0.3045. RSI hit maximum levels at 70 on multiple occasions, triggering sudden selling pressure in the market. Trading reverted to touch the $0.2990 support after the price was reversed numerous times. The market evidenced several failed upward attempts at resistance around $0.3050, demonstrating seller dominance in that zone.
Sandbox Breakout Triggers Sharp Decline and Heightened Volatility
The Sandbox Breakout increased market volatility between 15:00 and 18:30. The price experienced a rapid decline around 17:50 UTC, dropping from $0.3005 in a distinct Sandbox Breakout. The MACD indicator formed a bearish trend and produced a death cross signal as the RSI entered the oversold region. The market initiated its bearish movement from the abrupt price decline as sell pressure reached the $0.2872 support zone. Market participants demonstrated reluctance, which led to an unsuccessful upward market recovery.
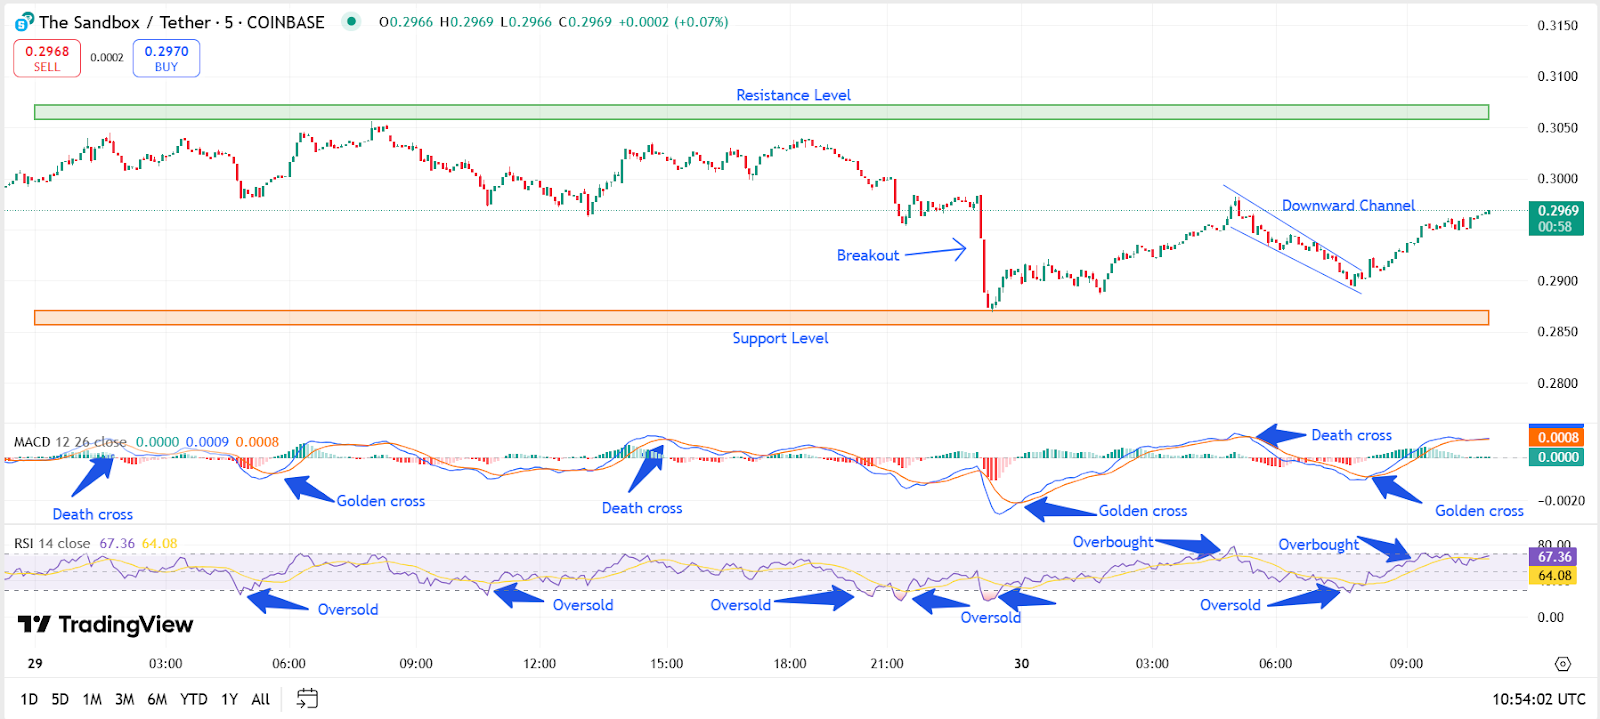
Chart 2, SAND/USDT M5 Chart, Analysed By Anushri Varshney, Published on TradingView, April 30, 2025
From 18:30 until the next day, SAND Coin traded within a restricted price band under previous support levels between $0.2880 and $0.2910. Oversold RSI readings emerged several times, alongside a 22:45 UTC MACD golden cross that indicated potential market recovery. The price stayed limited by a downward channel pattern throughout this period.
SAND Price Outlook – What Is Next for SAND?
Today, the SAND Price began recovering from the low of $0.2850, putting a new short-term uptrend in place. The MACD showed a death cross at 05:20 UTC as the bulls attempted to retake charge. At 08:10 UTC, the MACD produced a golden cross confirming the rise. With this, RSI moved from oversold territories into the 60s, reflecting the strengthening bullish momentum. However, resistance at $0.2970 halted all further movements, entering the early morning hours with slowing momentum.
The Sandbox price briefly moved into the downtrend channel after failing again to break the $0.2970 resistance. The RSI stayed set at elevated levels without marking any overbought conditions, signifying indecisiveness. The price quickly dipped toward $0.2900 before bouncing up and keeping the major recovery pattern intact.
Key Levels Define SAND Coin’s Next Move
SAND Coin’s recent market behavior demonstrates a careful struggle between price recovery initiatives that operate against strong opposing forces. SAND Price showed limited movement between $0.2970 and $0.3000, with brief surges repeatedly halted by firm resistance. Despite MACD golden crosses and RSI recoveries, the market remains reluctant as price meets persistent resistance. The market’s decisive state will become bullish once the Sandbox price breaks and sustains above $0.3000. SAND’s next confident decision within this crucial zone will determine its short-term market direction.
Sandbox (SAND) Price Analysis For May 25, 2025
The SAND Coin price analysis shows a mix of recovery, consolidation, and weakness, with notable MACD and RSI signals guiding intraday momentum. The Sandbox Breakout attempts were limited, and the SAND Price remained range-bound during most of the session. Price opened the day with sharp bearish pressure, falling to $0.2965 by 00:15 UTC. RSI dipped into the oversold zone, and a death cross on the MACD confirmed short-term weakness. However, by 01:00 UTC, bulls stepped in, forming an upward channel that lifted SAND back toward $0.3025.
A golden cross near 01:20 UTC supported the recovery, and RSI exited the oversold region. Between 01:20 and 02:10 UTC, a downward channel formed. The SAND Price corrected mildly to $0.3005. This was followed by another bullish move starting at 02:15 UTC, where SAND entered a fresh upward channel. Momentum picked up, and the price rallied to $0.3060 by 02:50 UTC. RSI hit the overbought mark, and a death cross shortly after warned of slowing momentum.
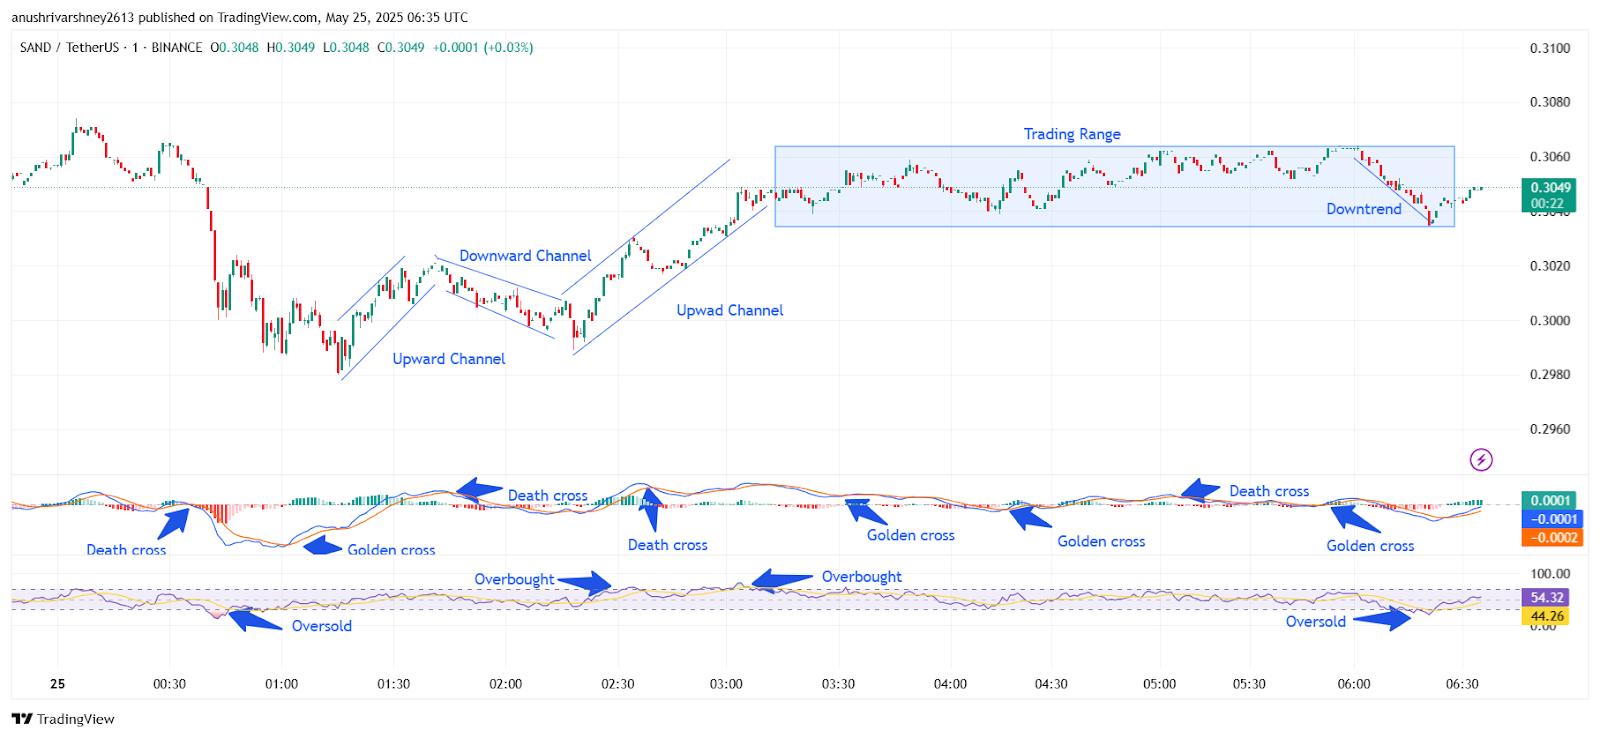
Chart 3- SAND/USDT M1 Chart, Analysed By Anushri Varshney, Published on TradingView, May 25, 2025
From 03:00 UTC to 04:50 UTC, the SAND Coin entered a sideways phase. Price action moved within a tight range between $0.3040 and $0.3060. Despite multiple golden and death crosses in the MACD, the lack of volume kept the Sandbox Breakout attempts muted. RSI hovered near the neutral zone, reflecting indecision. The consolidation continued through the early morning, and by 05:30 UTC, signs of exhaustion were visible. A fresh death cross on the MACD combined with RSI slipping below 45 hinted at upcoming weakness. The SAND Price dropped from $0.3055 to $0.3030, forming a minor downtrend by 06:00 UTC.
Sandbox Price Holds Between $0.3020–$0.3060 as Bulls Eye Breakout Confirmation
A final dip took SAND into oversold RSI territory at 06:15 UTC, touching $0.3020. However, bulls pushed a small rebound toward $0.3049 by the end of the observed session. A golden cross at 06:25 UTC reinforced the intraday bottom.
Throughout the day, SAND Coin struggled to hold above the $0.3060 resistance, and no clear Sandbox Breakout occurred. While the price recovered multiple times, every upward push was met with rejection near the upper range. RSI oscillated between extremes, and MACD signals flipped often. Key levels to watch ahead include support at $0.3020 and resistance at $0.3060. A breakout above the range may confirm the next directional move for the Sandbox ecosystem.
SAND Coin Outlook: Range Holds, Breakout Still Unclear
The SAND Price closed the day slightly above $0.3040, within the familiar $0.3020 to $0.3060 range. Despite several upward attempts, no strong Sandbox Breakout occurred. The price stayed trapped inside a sideways zone for most of the session, showing hesitation among both bulls and bears. MACD presented frequent golden and death crosses, adding to the indecision. RSI levels moved from oversold to overbought and back again, indicating short-lived momentum swings. The SAND Coin’s rejection near the $0.3060 mark shows clear resistance, while $0.3020 remains key short-term support. Until price breaks either boundary with strength and volume, the current range-bound nature may continue. Traders should stay cautious of false signals and monitor MACD and RSI closely. A confirmed breakout above $0.3060 could shift momentum in favor of bulls. For now, the Sandbox Price action signals consolidation, not conviction, as the market awaits a clear direction within the Sandbox ecosystem.
Sandbox (SAND) Price Analysis For May 31, 2025
The SAND Price analysis shows a volatile cycle of trend shifts, recovery attempts, and sideways action, with short bursts of momentum driven by RSI and MACD signals. SAND Coin opened the day with a steady downtrend, starting around $0.270 and slipping lower through the early hours. By 00:20 UTC, the RSI dipped into oversold territory, reflecting growing sell pressure. This oversold signal, combined with a MACD golden cross, triggered a minor Sandbox breakout, pushing the SAND price from $0.263 toward $0.267.
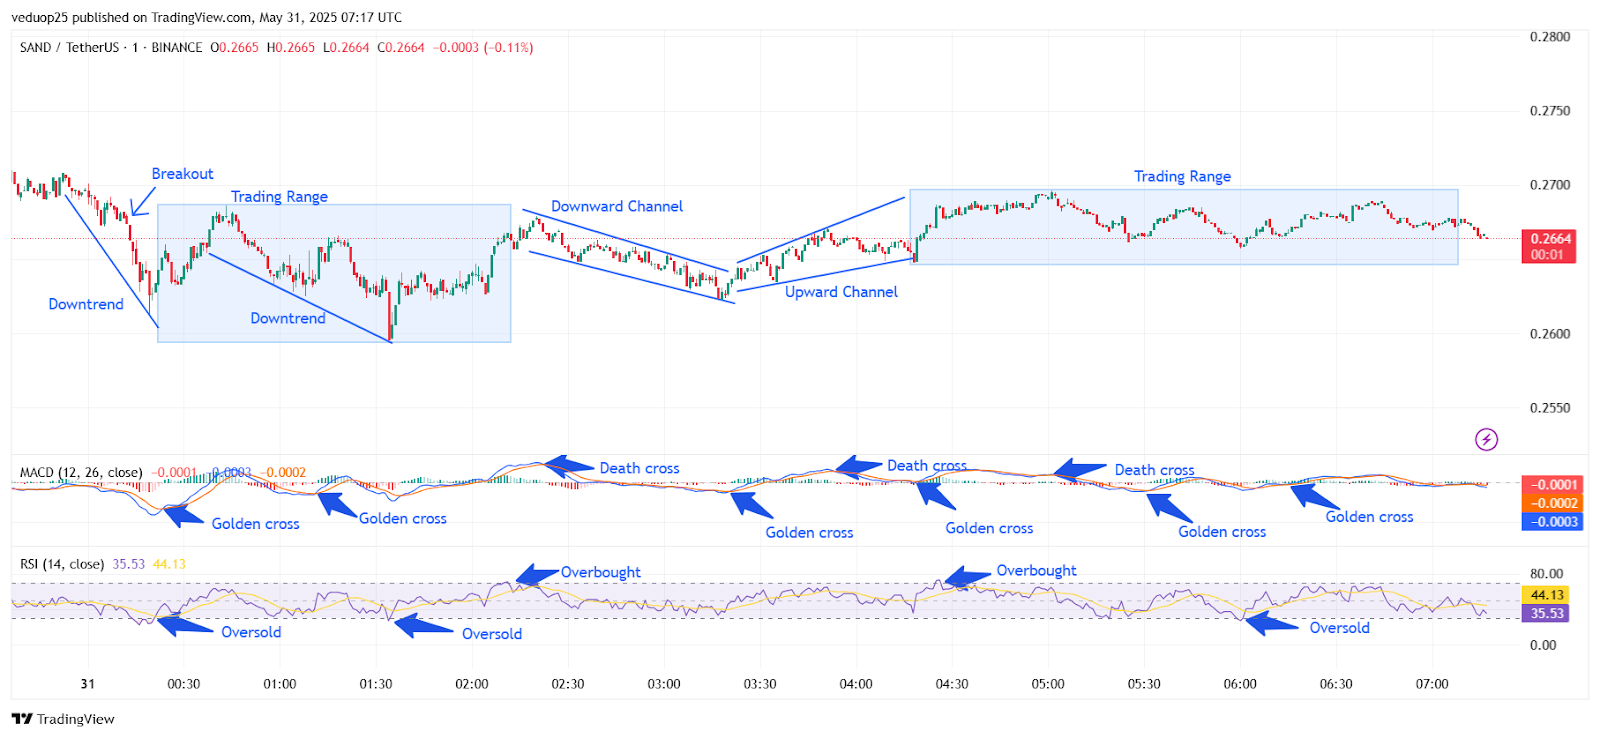
Chart 4- SAND/USDT M1 Chart, Analysed By Anushri Varshney, Published on TradingView, May 31, 2025
After this brief push, price action entered a tight trading range from 00:30 to 01:30. During this phase, the price fluctuated between $0.263 and $0.268 without any decisive move. Another downtrend kicked in around 01:40, creating a lower low around $0.261 by 02:15. Once again, RSI showed oversold conditions, and a MACD golden cross followed, sparking a second recovery. By 02:30, SAND entered an upward channel. The price steadily moved up, climbing from $0.262 to just under $0.270 by 03:45.
Sandbox Price Stalls Between $0.2630 and $0.2695
RSI briefly touched the overbought zone around 03:30, showing signs of exhaustion. Soon after, a MACD death cross appeared, and price momentum faded. From 04:00 onward, the SAND price started consolidating again in a new trading range, moving sideways between $0.264 and $0.269. This phase stretched until the end of the 24-hour window. Several golden and death crosses were spotted on the MACD during this time, but none led to strong follow-through. RSI hovered between 40 and 55, reflecting neutral momentum and a lack of a clear trend.
The SAND Coin failed to hold its earlier gains, and by the end of the session, it was trading around $0.2664. Despite multiple breakout attempts, the Sandbox breakout phases lacked strong volume and conviction to sustain a bullish move. Support has formed near $0.2630, while resistance holds firm at $0.2695.
SAND Coin Stalls as Momentum Fades Near Key Levels
The last 24 hours have shown that the SAND Coin is struggling to build a strong directional move, despite multiple bounce attempts. While there were moments of recovery driven by oversold RSI readings and golden crosses on the MACD, each rally lost steam quickly. The Sandbox breakout setups failed to hold above the $0.2695 resistance, leading to a return to range-bound action.
With RSI now neutral and MACD signals lacking strength, traders appear to be waiting for a clear breakout from the current $0.2630–$0.2695 zone. Until that happens, the SAND price is likely to continue consolidating sideways. Bulls need a strong push above $0.2695 to spark any meaningful upside, while bears will look for a break below $0.2630 to regain control. For now, the SAND coin remains in a decision zone, with momentum signals offering limited clarity. Patience may be key for the next major move.
Sandbox (SAND) Price Analysis For June 3, 2025
The SAND price analysis shows a volatile but technically structured session, marked by multiple channel formations and key indicator shifts. The day began with sideways consolidation before a clear Sandbox Breakout occurred around 00:45 UTC. This breakout pushed the SAND coin from near $0.2805 to $0.2842, confirming strong buying interest. Between 01:00 and 01:45 UTC, the price moved inside an upward channel, supported by a golden cross on the MACD and an RSI overbought signal. This rally marked the day’s high, but by 01:50 UTC, sellers stepped in. A MACD death cross appeared, and the price slipped into a downward channel from 02:00 to 04:15 UTC. The final recovery lacked supporting volume, showing hesitation among bulls.
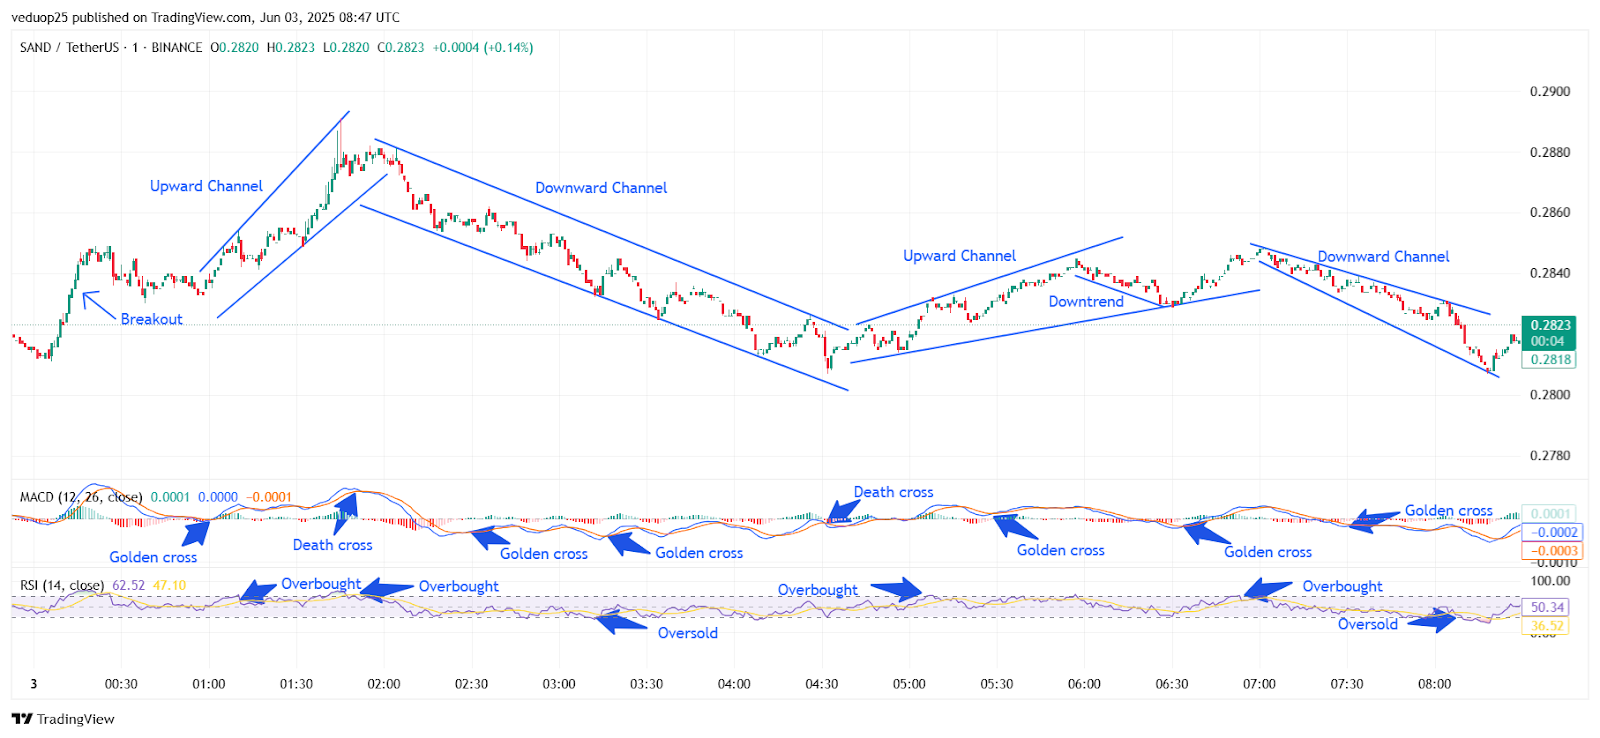
Chart 5- SAND/USDT M1 Chart, Analysed By Anushri Varshney, Published on TradingView, June 3, 2025
Around 04:30 UTC, a golden cross reappeared on the MACD. The SAND price responded with a bounce, climbing back into an upward channel between 04:30 and 06:00 UTC. Buyers regained momentum as RSI climbed above 50. However, the rally faced exhaustion near $0.2840 once again. The MACD showed a weak death cross at 05:45 UTC, signaling a potential stall.
SAND Coin Slides to $0.2818 Before Weak Bounce to $0.2823
From 06:15 UTC onward, the SAND coin entered a slow downtrend. RSI floated near 50, suggesting neutral momentum. By 07:00 UTC, price action began slipping into another downward channel, marking the third distinct corrective phase of the session. A brief oversold RSI reading was seen around 08:00 UTC, and a final MACD golden cross came in around 08:15 UTC. This triggered a minor recovery from $0.2818 to $0.2823 by the last visible candle.
However, the bounce lacked strong volume, signaling hesitation. From 08:15 UTC to the end of the session, the SAND price remained stable between $0.2820 and $0.2825. No further breakouts or strong momentum shifts occurred. RSI held near 50, and MACD stayed flat, reflecting consolidation into the close. Golden crosses led to upward movements, while death crosses aligned with local tops. Overbought and oversold conditions on RSI were also reliable markers of reversals.
SAND Price Remains Range-Bound With Technical Cues in Play
Despite the earlier Sandbox breakout, the coin closed the session with price action staying inside a tight range. Although buyers triggered brief rallies through upward channels, each push met resistance around the $0.2840 level. Meanwhile, the SAND price held above $0.2805, confirming a well-defined short-term range. MACD golden crosses provided reliable bounce signals, but most lacked strong follow-through. RSI movements added clarity, especially during overbought and oversold phases.
The recent bounce from $0.2818 shows that bulls are still active at lower levels. However, without volume, these recoveries remain fragile. For a clear trend shift, the SAND coin must break above the $0.2840 resistance or lose support below $0.2805. Until then, the price is likely to stay range-bound, reacting to intraday signals. If bullish momentum increases, another Sandbox breakout could retest $0.2860. On the downside, losing $0.2800 might open the door for a deeper correction toward $0.2775.
SAND Price Analysis For June 7, 2025
The SAND price analysis shows a clean and structured sequence of upward and downward movements, supported by strong indicator signals. The session began near $0.2680 today. The SAND coin immediately entered a sharp upward channel, gaining strength through steady green candles. A brief Sandbox breakout occurred between 00:15 and 00:30 UTC, pushing the price to $0.2735. RSI spiked into the overbought zone, and MACD gave a strong golden cross, confirming bullish strength. By 00:30 UTC, the trend reversed into a downward channel. The price dipped from $0.2735 to $0.2700 by 01:30 UTC.
RSI dropped below 50, and a MACD death cross signaled cooling momentum. However, the structure remained controlled without any sharp breakdown. From 01:45 UTC, a new upward channel formed. The SAND price climbed steadily from $0.2700 to $0.2745 by 02:45 UTC. This rise was marked by another golden cross on MACD and a quick RSI recovery above 60. A small overbought signal appeared near 03:00 UTC, which led to sideways consolidation between 03:00 and 04:00 UTC.
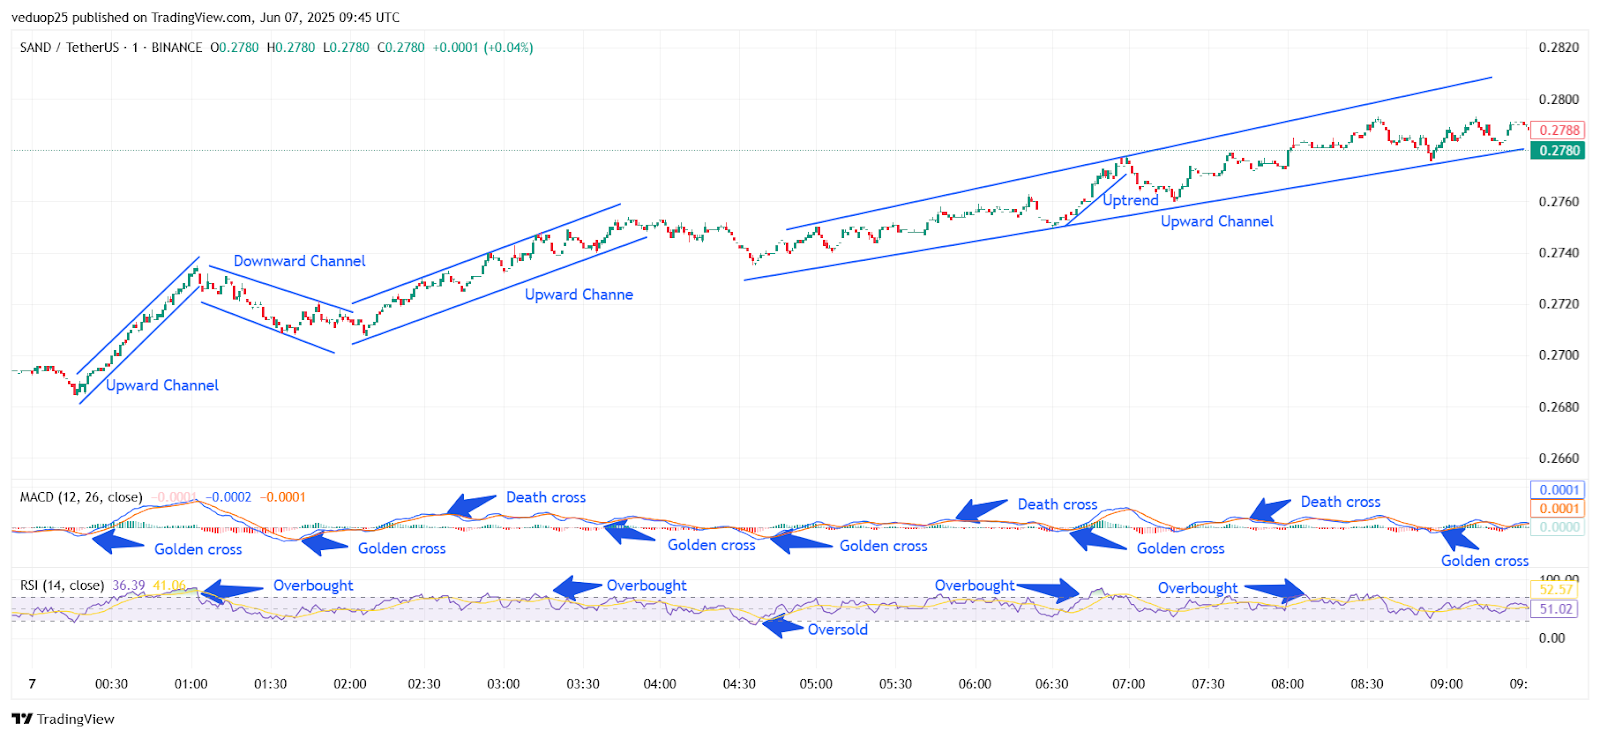
Chart 6- SAND/USDT M1 Chart, Analysed By Anushri Varshney, Published on TradingView, June 7, 2025
Around 04:15 UTC, the price dipped again, reaching an intraday low of $0.2725 at 04:30 UTC. RSI fell into the oversold zone, while MACD printed another golden cross by 04:45 UTC. This triggered a fresh uptrend, pushing the SAND coin from $0.2725 to $0.2765 between 05:00 and 06:00 UTC. RSI rose back above 60, showing clear momentum.
SAND Price Holds $0.2780 With Channel Support Between $0.2765–$0.2788
From 06:15 UTC, the trend matured into a wide upward channel. Between 06:15 and 08:00 UTC, price action moved steadily inside this rising structure, ranging from $0.2765 to $0.2780. After 08:00 UTC, the price consolidated within the top end of the channel. It remained between $0.2770 and $0.2788 till 09:30 UTC. A golden cross appeared again on MACD, and RSI stayed slightly above 50, showing buyers were still active near the top. At the time of writing, the SAND price is holding steady around $0.2780, keeping the trend structure intact. The clean mix of upward channels and repeated Sandbox Breakouts confirms a strong technical footing for the SAND coin.
SAND Price Holds Gains After Clean Sandbox Breakout Structure
The SAND price closed the session with strong technical support after a well-formed trend of upward channels, mild pullbacks, and multiple Sandbox breakouts. The day began with early momentum, where the SAND coin climbed quickly and entered overbought territory. Despite a pullback into a downward channel, buyers re-entered, triggering fresh upward moves throughout the mid-session.
The price maintained its bullish structure with consistent golden crosses on the MACD and strong RSI readings, mostly above 50. Every minor drop was followed by a recovery, showing buyers were in control of the market. Even late in the session, the price stayed inside the final rising channel, without breaking support. At the close, the SAND coin traded near $0.2780, reflecting healthy consolidation after upward movement. If the structure continues, the next Sandbox Breakout could lift the price closer to $0.2810, with $0.2760 as the immediate support level.
SAND Price Analysis of June 11, 2025
The SAND price analysis showcases repeated shifts between trending moves and flat ranges. Price started the day around $0.3045 and quickly entered a sharp downward channel. Between 00:00 and 01:00 UTC, the SAND Coin dropped steadily, breaking below $0.3000. RSI hit oversold around 00:45 UTC, and MACD gave a death cross, confirming bearish strength. From 01:00 to 02:00 UTC, price action moved sideways inside a trading range between $0.2985 and $0.3005. The sideways move was slow, and momentum indicators stayed flat. MACD showed a golden cross at 01:30 UTC, hinting at recovery. Around 02:15 UTC, a mild downtrend resumed and pushed the price down to $0.2975 before bulls stepped in.
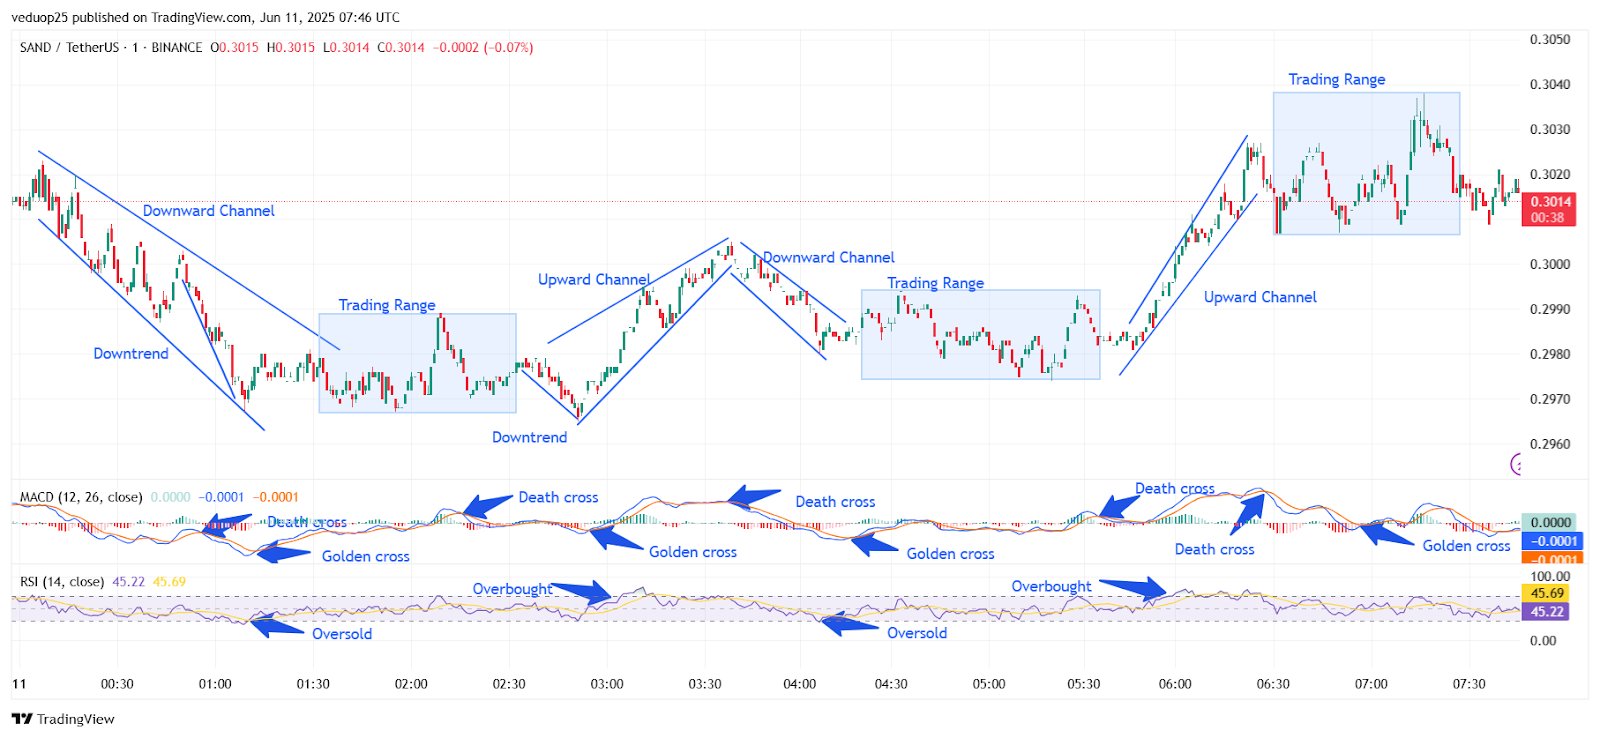
Chart 7- SAND/USDT M1 Chart, Analysed By Anushri Varshney, Published on TradingView, June 11, 2025
Between 02:30 and 03:15 UTC, the SAND Price formed a clean upward channel. Price rebounded from $0.2975 to $0.3040 in a strong 45-minute rally. MACD gave a fresh golden cross, and RSI briefly touched overbought territory near 70. The price rejected from $0.3040 and reversed sharply. From 03:15 to 04:00 UTC, the coin moved inside another downward channel, falling back toward $0.2980. A death cross on the MACD and a sharp RSI drop confirmed this reversal. However, no strong selling followed, and the market entered another sideways phase.
SAND Coin Rallies Fade Below $0.3040 as Momentum Stalls
Between 04:00 and 05:15 UTC, SAND Coin traded inside a tight range between $0.2975 and $0.3000. RSI hovered near 45, and MACD showed weak direction with back-to-back crossovers. Bulls returned shortly after. From 05:15 to 06:15 UTC, the price spiked again in a fast upward channel, moving from $0.2978 to $0.3030. RSI jumped overbought again, and MACD gave a golden cross, suggesting rising demand. However, the move lacked volume, and there was no follow-through.
In the final session, from 06:15 to 07:45 UTC, SAND entered another trading range, floating between $0.3015 and $0.3035. Momentum slowed. RSI cooled to 45, and MACD flattened with a weak golden cross at the end. Despite two strong rallies, the Sandbox Breakout failed to sustain. Price closed at $0.3014, showing indecision. A clean break above $0.3040 or a drop below $0.2975 will decide the next phase for SAND Coin.
SAND Coin Stalls After Failed Sandbox Breakout
The SAND Coin ended the session without a clear breakout despite multiple attempts to regain upward momentum. After early weakness pulled the price below $0.3000, buyers stepped in twice to trigger upward channels. However, both rallies lost steam before breaching the key resistance near $0.3040. The RSI consistently reacted at key turning points, moving from oversold to overbought, and the MACD printed several golden and death crosses, reflecting unstable momentum.
The final trading range between $0.3015 and $0.3035 showed indecision among traders, with no strong push in either direction. Support near $0.2975 held firm throughout the day, acting as a key base. The absence of a confirmed Sandbox Breakout leaves SAND stuck in a neutral zone. For any real direction, traders should watch for a clean breakout above $0.3040 or a breakdown below $0.2975. Until then, the SAND price may move sideways with short, reactive swings.
Sandbox (SAND) Price Analysis For June 14, 2025
The SAND price analysis shows a mix of sharp drops, short recoveries, and two tight consolidation zones. The price stayed active throughout the session, moving within structured channels and forming clear signals across RSI and MACD. By 01:45 UTC, the SAND coin fell steadily inside a broad downward channel. Price dropped from $0.2665 to $0.2635 during this period. This phase marked an early weakness in the SAND price trend. Between 01:45 and 03:00 UTC, bulls stepped in.
A clear upward channel developed as the price climbed back to $0.2658. RSI touched 70 briefly, and a Sandbox breakout seemed to form. MACD flashed another golden cross at 02:30 UTC, confirming temporary strength. But this move lacked volume support. From 03:15 to 05:15 UTC, SAND shifted into a sideways zone. The price floated between $0.2650 and $0.2660 with no real push. RSI stayed flat around 50, and MACD moved sideways with alternating quick crosses.
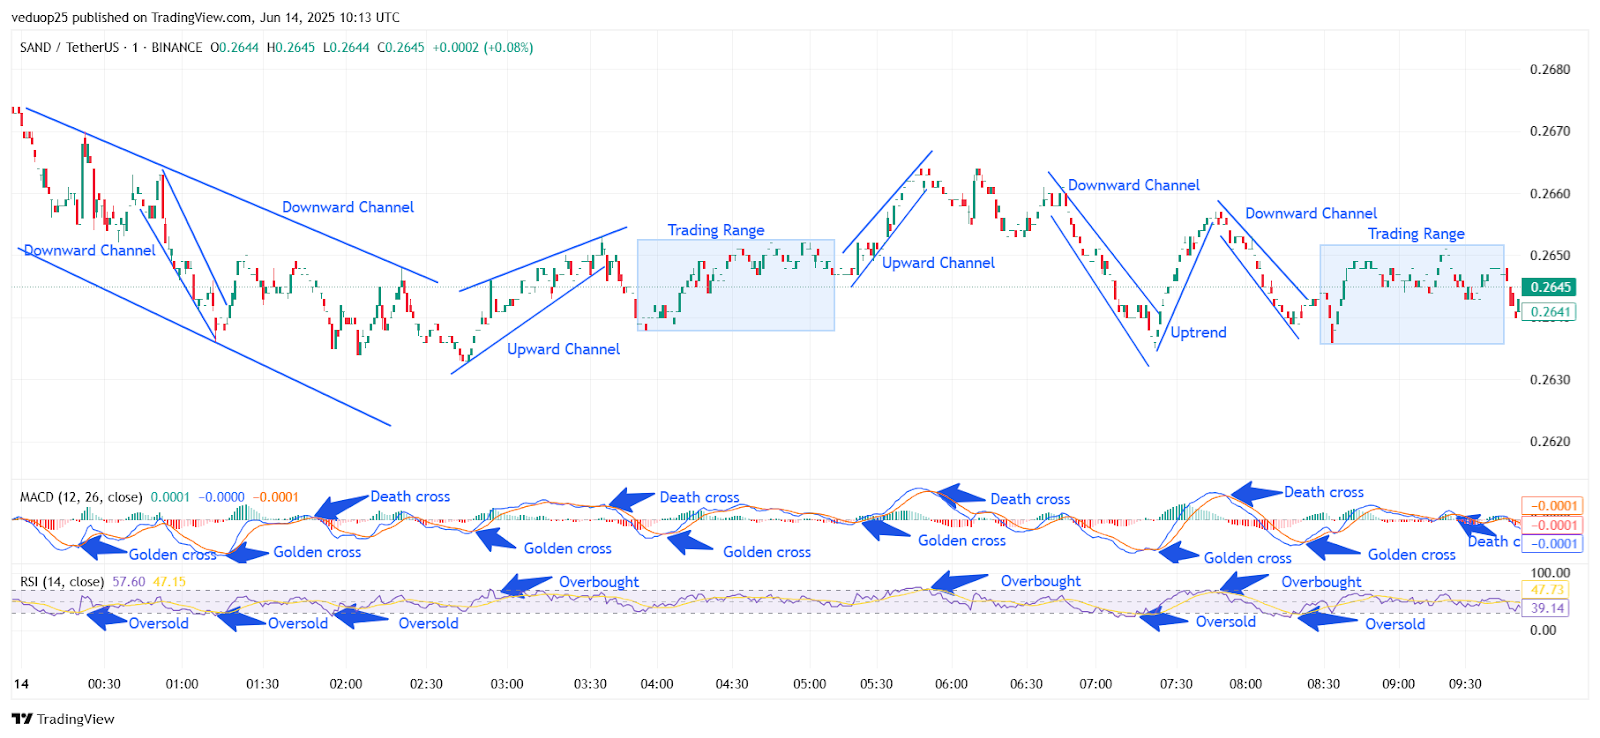
Chart 8- SAND/USDT M1 Chart, Analysed By Anushri Varshney, Published on TradingView, June 14, 2025
A sharp upward channel appeared from 05:30 to 06:30 UTC. SAND jumped from $0.2650 to $0.2675. RSI spiked into overbought territory, and MACD gave another golden cross at 06:00 UTC. This was the second mini Sandbox Breakout, but again, the price couldn’t hold above $0.2675.
SAND Coin Swings in Volatile Channels, Ends in Flat Range
From 06:30 to 07:15 UTC, SAND dropped again inside a fresh downward channel. The price fell back to $0.2642. RSI hit oversold and MACD gave a strong death cross, confirming bearish pressure. Between 07:15 and 08:00 UTC, a clean bounce occurred. The SAND coin surged back to $0.2668 in a new uptrend. RSI touched overbought again, and MACD flipped bullish. But this upmove was brief and quickly faded.
By 08:15 UTC, a third downward channel emerged. SAND dropped from $0.2668 to $0.2640. RSI sank below 40, and MACD gave another death cross. No strength followed from buyers. From 09:00 to 10:00 UTC, the chart showed a flat trading range between $0.2640 and $0.2652. RSI hovered near 47, and MACD stayed neutral, confirming weak sentiment. Momentum stays weak as SAND coin continues to trade within narrow intraday ranges.
SAND Price Holds Key Support, Momentum Still Weak
Despite multiple attempts by bulls, the SAND price closed the session with no clear breakout direction. While two short Sandbox breakouts formed during the uptrends at 03:00 UTC and 06:00 UTC, both lacked sustained volume and failed near $0.2675. The SAND coin also dipped into oversold territory several times, highlighting buyer hesitation around support at $0.2635. RSI stayed mostly between 40 and 70, and MACD showed frequent golden and death crosses, reflecting unstable momentum throughout the day.
The last few hours were marked by a tight trading range, where the SAND price moved sideways with minimal strength from either side. Unless the price breaks out strongly above $0.2675, any rallies will likely remain limited. On the downside, if $0.2635 fails, further selling could push the SAND coin lower. For now, the trend remains uncertain with weak signals, and traders should watch closely for the next decisive Sandbox Breakout.
SAND Price Analysis For June 16, 2025
The SAND price analysis highlights a full bullish recovery, shaped by clean channel patterns and consistent indicator signals. The day opened with bearish pressure. From 00:00 to 01:15 UTC, the SAND coin dropped inside a clear downward channel, falling from $0.2658 to $0.2595. RSI dipped into oversold territory, and a MACD golden cross at 01:15 UTC gave the first sign of a possible reversal.
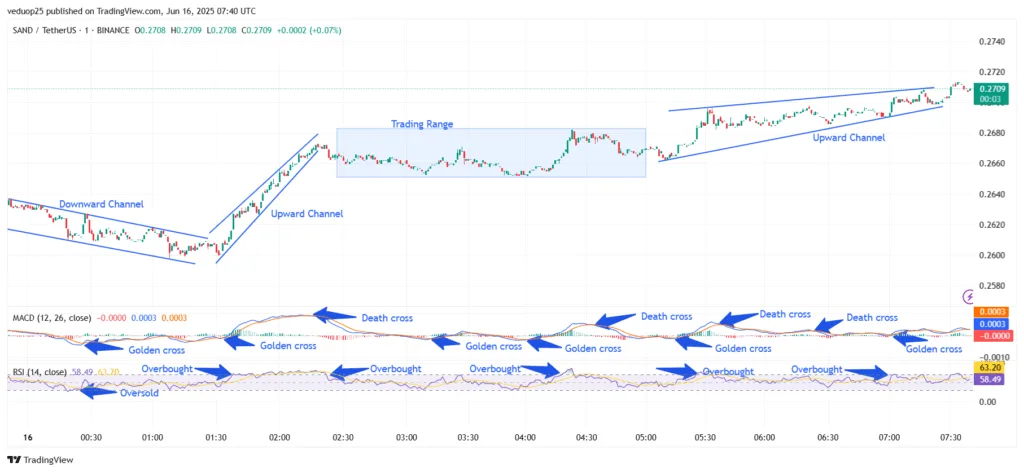
Chart 9- SAND/USDT M1 Chart, Analysed By Anushri Varshney, Published on TradingView, June 16, 2025
Between 01:15 and 02:15 UTC, the SAND price surged in a sharp upward channel, moving from $0.2595 to $0.2665. RSI touched overbought, confirming demand. MACD backed the move with another strong golden cross. By 02:30 UTC, momentum cooled. Between 02:30 and 04:15 UTC, the price remained within a tight trading range, fluctuating between $0.2662 and $0.2683. Multiple MACD crosses occurred, but none gained strength. RSI hovered near neutral. This was a clear phase of balance after the earlier spike.
Sandbox Breakout Extends with Strong RSI and Golden Cross Support
At 04:15 UTC, a clean Sandbox breakout began. Price pushed out of the range and entered a broader upward channel. From 04:15 to 07:30 UTC, the SAND coin climbed from $0.2670 to $0.2709. RSI hit overbought again at 04:45, 06:00, and 07:15 UTC. MACD gave out fresh golden crosses near each leg up, keeping the momentum strong. Death crosses at 05:00 and 06:00 UTC signaled short pauses, but the price held above trendline support.
Buyers stayed in control through higher lows. Each dip was short-lived and followed by a bounce. This kept the uptrend intact. From 07:30 to 08:30 UTC, prices moved slowly but stayed within the rising channel. Minor consolidation took place near $0.2705. RSI cooled slightly, but MACD remained bullish. At 09:00 UTC, another bounce pushed SAND to $0.2713.
Bulls Maintain Control After Clean Sandbox Breakout
The trading session confirm a strong buyer presence in the SAND coin market. After a clear reversal from the downward channel early in the day, the price followed a consistent upward channel, backed by repeated golden crosses and multiple overbought RSI signals. The breakout from the mid-range zone around 04:15 UTC marked the real turning point. From there, the SAND price stayed bullish, forming higher lows and gradually pushing up to $0.2720 by the end of the session. Even minor death crosses didn’t shake the uptrend, showing that sellers lacked pressure.
The steady rise, combined with healthy RSI and MACD conditions, leaves room for more upside. If the price holds above $0.2700 and MACD remains positive, another Sandbox Breakout could follow. However, if the RSI overheats again or the trendline breaks, a short pullback may occur. For now, bullish control looks intact going into the next session.


