

Are you eager to invest in SEI coins and need an articulate, data-completed perspective to facilitate your movement? If so, this SEI price analysis is for you. This analysis will specify major support and resistance zones, recent momentum shifts in price, and indicate price trends within a short period. Be it short-term trades or waiting for a SEI breach that will ultimately designate a change of trend; this breakdown will give you the confidence to do so. Now, let us look at the SEI price analysis and the current opportunity it presents.
SEI Price Analysis of May 3, 2025
SEI coin experienced limited price movement during the recent few hours while showing considerable fluctuations in the early part of the day. The SEI tokens initiated their trading position at $0.2215 but this value experienced quick depletion before settling at $0.2183. The death cross on MACD triggered the price decline when it appeared at 00:25 UTC. The price continued moving downward from 05:00 UTC until the end of the analysis period. SEI experienced an acceleration in its price activity starting from 06:00 UTC. The short-term price surge happened after the MACD indicator displayed a golden crossover pattern. The market valuation of $0.2208 developed at 08:20 UTC going against continued upward movement because volume levels remained insufficient.

Chart 1- SEI/USDT M5 Chart, Analysed By Anushri Varshney, Published on TradingView, May 3, 2025
The stock produced another golden cross pattern at noon while RSI restored its neutral position. At 18:00 UTC and the end of the examined period, SEI experienced a steady upward trend that pushed its price towards $0.2230. The coin did not succeed in surpassing its established high point during this period. During this particular time period, the SEI trading range expanded its boundaries. The price of SEI stabilized at $0.2185 before running into obstacles at $0.2235.
A second death cross occurred at 03:20 UTC which produced a minor market dip yet investors reentered the market. The coin remained restricted to its trading area without breaking beyond its defined zones. SEI displayed a second golden cross that materialized at 08:10 UTC. Following a dip to the border of $0.2190 sei price rose back to $0.2205. The momentum on MACD stalled out during this period at the same time that market volume levels stayed low. Current market conditions keep the coin confined between $0.2185–$0.2235.
Rangebound Trading Stalls Bullish Momentum
Today, SEI coin traded in a narrow band between $0.2185 and $0.2235, indicating consolidation after a recent downtrend. The MACD kept recording golden crosses, while the RSI remained neutral around 49, indicating weak momentum. A bounce from the lower range confirmed support near $0.2185, while resistance remains strong at $0.2235. Traders would watch for an upside confirmation above $0.2235 or a bearish continuation below $0.2185. SEI coin remains on the radar as more pressure builds.
SEI Price Prepares for Breakout or Breakdown
The trading range of SEI coins has remained confined for a long time within a range between $0.2185 and $0.2235. Factors cause a major swing from such a long, long consolidation. Massive golden crosses repeatedly appear in the MACDs and hint at bullish developments. However, without volume, the momentum cannot go far, leaving the RSI experiencing the implication that neither buyers nor sellers fully control the market. A breakout above $0.2235 will lead to a temporary surge in sei price toward resistance at $0.2280. A decline below $0.2185 will prove the continuation of the bear trend. A possible sei breakout is expected to dictate the next trend.
SEI Price Analysis For May 7, 2025
The SEI coin began its trading session yesterday with a bearish movement. The price opened below the resistance level of $0.2024 and entered a clear downward channel, where selling pressure remained strong. The MACD showed a death cross at 01:20 UTC. By 02:30 UTC, the RSI entered oversold territory, attracting early buyer interest. As the SEI price dropped, the RSI indicator showed oversold conditions near 02:30 UTC, which built early buying interest among traders. A golden cross on the MACD appeared around 03:10 UTC. It hinted at bullish momentum, but the price failed to break out. The price moved sideways between $0.1920 and $0.1960 from 03:30 UTC to 08:00 UTC.
At 08:05 UTC, bullish pressure returned when a golden cross occurred again on the MACD and RSI broke neutral, which marked the first upward channel. This upward movement lasted approximately 11:25 UTC. The RSI hit overbought levels at this point, and the price touched $0.2020, just below the major resistance at $0.2024. A brief false SEI breakout occurred but quickly reversed as selling pressure returned.

Chart 2- SEI/USDT M5 Chart, Analysed By Anushri Varshney, Published on TradingView, May 7, 2025
After the rejection of resistance, a pullback began. Another golden cross appeared on the MACD at midnight, but the candlesticks were weak. The price declined further to $0.1956 by 05:48 UTC, nearing the lower zone of the earlier trading range. Currently, the SEI price shows signs of exhaustion after failing to break the resistance at $0.2024. The support level at $0.1904 remains valid and may be tested again if bearish pressure continues. A breakout above resistance could push the price to $0.2050. A dip below support may signal further decline.0. A dip below support may signal further decline.
SEI Coin Slips Below $0.20 After Early Rally
On May 7, the SEI price attempted to break higher but lost steam after breaching the $0.2000 mark, pulling back to around $0.1950. The price had earlier rebounded from the $0.1900 support, moving through a trading range before rallying within an upward channel. Although multiple MACD golden crosses supported bullish momentum, the recent RSI drop from overbought to oversold suggests waning strength. A sustained hold above $0.1920 is now critical to avoid deeper losses. Resistance at $0.2020 remains intact, keeping upward moves in check.
SEI Shows Promise but Faces Key Resistance Ahead
SEI showed recovery signs but faces pressure near $0.2000. After sliding through a downward channel, it found support at $0.1900. This was followed by a SEI breakout into an upward channel, lifting the SEI price briefly above $0.2000. However, the move lacked strength, and the price pulled back to around $0.1950 today. The MACD flashed multiple golden crosses, pointing to bullish attempts, but the RSI’s drop from overbought to oversold now signals fading momentum. For SEI coin recovery to regain traction, it must hold above the price of $0.1920 and build strength toward the next resistance at $0.2020. The broader trend has shifted more constructively, but there is no sustained buying interest, so gains could still be limited to the upside. Traders should remain vigilant, as renewed buying momentum could signal a run to test critical resistance levels again.
SEI Price Analysis For May 12, 2025
The SEI price analysis over the last 24 hours exhibits a sharp early decline followed by a gradual recovery. The price opened near $0.2750 and quickly slipped into a downward channel by 04:30 UTC. During this early session, multiple MACD death crosses confirmed bearish momentum, while the RSI dipped into oversold territory around 05:00, signaling a temporary trend reversal.
From 05:00 to 08:30 UTC, SEI stabilized near the $0.2550 support level. This phase saw choppy sideways action, with price attempting minor bounces but remaining capped below $0.2630. A golden cross appeared on the MACD around 08:40 UTC, aligning with an oversold RSI indication. The market stayed uncertain, with two more downward moves between 09:00 and 14:00 UTC, each forming lower highs and lows. The price briefly touched the $0.2520 region but failed to break the strong support level.
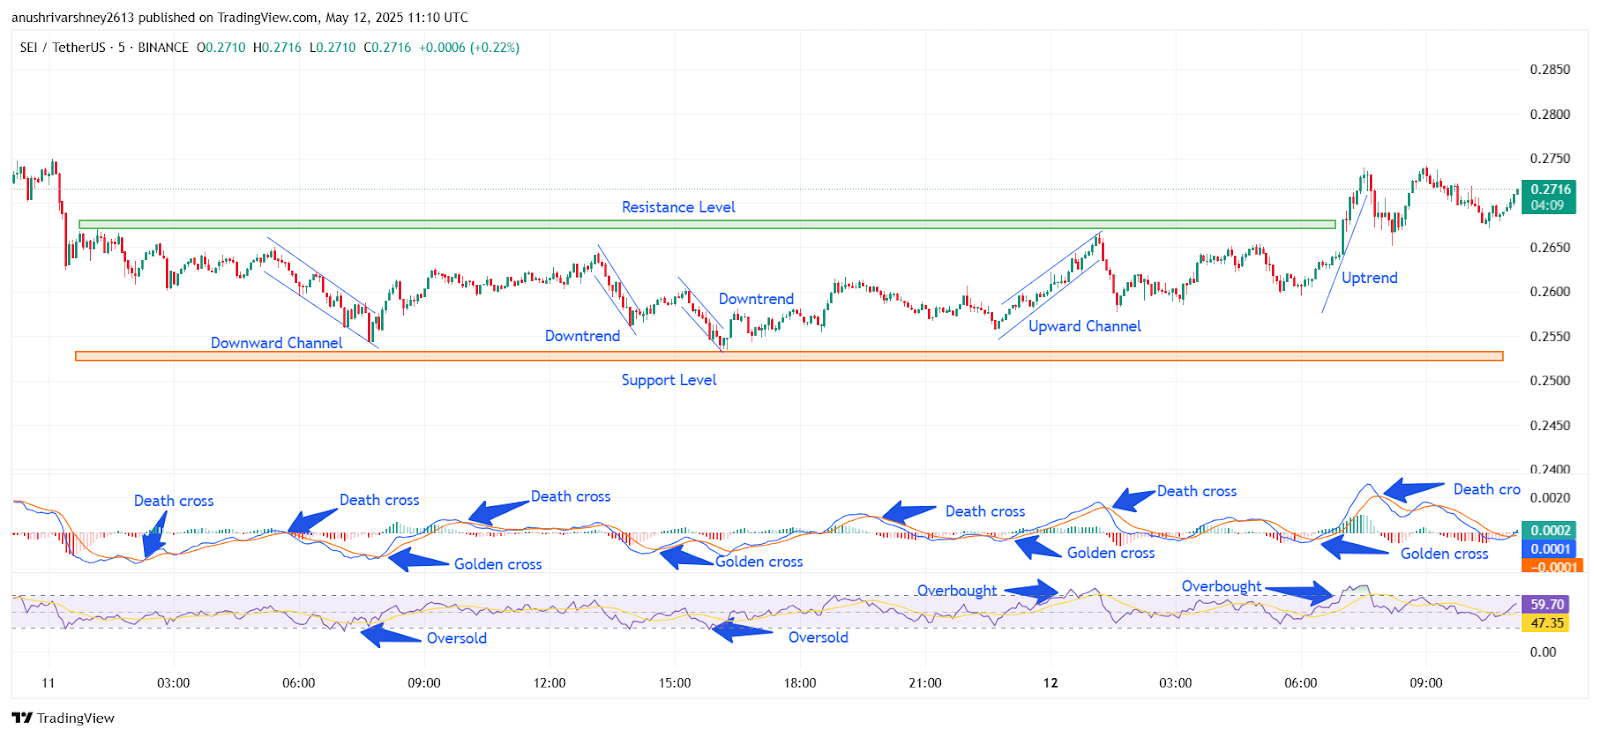
Chart 3- SEI/USDT M5 Chart, Analysed By Anushri Varshney, Published on TradingView, May 12, 2025
Between 14:00 and 18:00 UTC, SEI entered a narrow consolidation range. The MACD showed another golden cross, while the RSI recovered from oversold levels, suggesting bullish divergence. Buyer confidence grew over time, and by 20:00 UTC, the SEI had entered an upward channel, signaling the beginning of a recovery phase. Between 22:30 and 00:30 UTC, the price experienced a significant breakout, rising from $0.2620 to $0.2740 and surpassing the intraday resistance. SEI had completely recovered the resistance zone by the end of the day, trading close to $0.2716. By the end of the day, SEI had completely recovered the resistance zone and was trading close to $0.2716. If buyers hold above $0.2660, another move higher toward $0.2800 remains possible. A drop below $0.2630, however, could signal a reversal.
SEI Price Holds Strong Above Support After Breakout
Today, SEI Price continued to consolidate above the $0.2660 support after a strong breakout late yesterday. Early price action showed a brief dip toward $0.2650, but buyers defended the level well. A fresh uptrend began around 06:30 UTC, with SEI Coin pushing higher into the $0.2740 zone. The MACD showed a golden cross, while the RSI touched overbought levels, confirming bullish momentum.
However, the SEI Breakout momentum slowed mid-session as the price faced resistance near $0.2750. A mild pullback followed, but the momentum remained intact. As of now, SEI trades around $0.2716 with stable momentum. Holding above $0.2660 keeps the bullish outlook valid. A close below that may trigger renewed downside pressure.
SEI Coin Recovers Sharply After Support Bounce
The SEI Price showed consolidation after testing the strong support near $0.2520. Early downside pressure triggered a steep drop within a downward channel, confirmed by repeated MACD death crosses and oversold RSI readings. However, buyers defended the support zone well, and bullish signals emerged with a series of golden crosses and RSI recoveries throughout the day.
Momentum built slowly, leading to a clean SEI Breakout late in the session as the price surged above the $0.2660–$0.2700 resistance zone. This rally pushed the SEI Coin toward the $0.2740 area before a minor pullback appeared. Despite the final death cross on the MACD, price action remains bullish as long as SEI holds above $0.2660. If bulls maintain control, SEI Price could push toward $0.2800 in the next session. A break below $0.2630 would invalidate the bullish setup and shift momentum back to the bears.
SEI Price Analysis For May 16, 2025
The SEI Price analysis over the last 24 hours shows a clear trend reversal, starting with a steady downtrend and ending with a sharp breakout backed by strong momentum. SEI Price opened near $0.248 at 06:00 UTC on May 15 and then slipped into a downward channel, forming steady lower highs and lower lows until 13:00 UTC. RSI dipped into the oversold zone more than once, and MACD remained bearish throughout.
Between 06:00 and 13:00 UTC, the SEI token lost ground and dropped to a low of $0.233. However, around 08:45 UTC, a golden cross appeared on the MACD. RSI dipped again, hinting at a possible reversal. At 13:15 UTC, SEI Price broke above the channel’s upper boundary. This SEI Breakout marked a clear change in momentum. The price climbed steadily from $0.233 to $0.246 by 17:00 UTC, backed by strong green candles. The RSI crossed 70 and stayed in the overbought zone for a short period, showing strong buyer interest. Another golden cross on the MACD around 15:00 UTC further confirmed this uptrend.
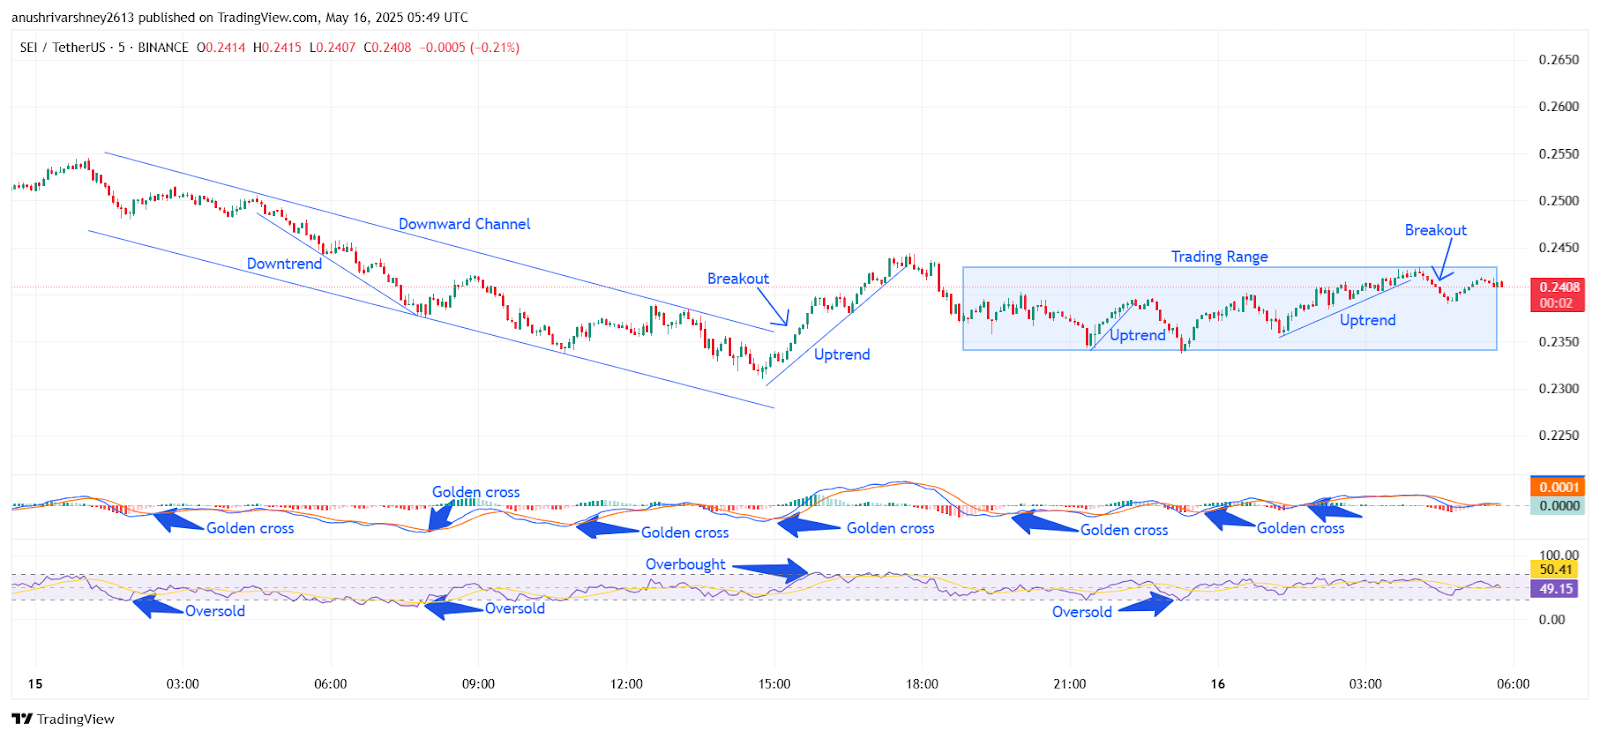
Chart 4- SEI/USDT M5 Chart, Analysed By Anushri Varshney, Published on TradingView, May 16, 2025
After touching $0.246, the SEI price entered a sideways trading range from 18:00 UTC to 04:00 UTC on May 16. This range held between $0.235 and $0.245. Support stayed solid around $0.235, and resistance capped gains at $0.245. RSI dipped near oversold at 23:00 UTC but bounced again, keeping momentum alive.
SEI Price Holds Between $0.240–$0.242 After Breakout
The SEI Price today stayed mostly stable after a clean SEI Breakout from the trading range seen yesterday. Price opened near $0.245 and briefly tested higher levels around $0.247 before trend reversal. SEI coin traded sideways in a narrow range between $0.240 and $0.242. MACD showed a golden cross early in the day, but momentum weakened as volume dropped. RSI hovered near the 50 mark, showing a balanced market with no strong buying or selling pressure. As long as SEI holds above $0.235 support, bulls remain in control. A strong close above $0.247 could trigger another SEI breakout and push the price toward $0.255 in the short term.
SEI Coin Maintains Strength After Breakout, Key Levels in Focus
The SEI Coin showed solid signs of recovery after breaking out of the downward channel and trading range. The recent SEI Breakout gave bulls a clear edge, pushing the SEI closer to key resistance near $0.247. Today’s action stayed stable, with SEI Price hovering near $0.240, showing buyers are still in control. Momentum indicators like MACD golden crosses and RSI rebounds support the ongoing trend, although short-term consolidation is visible. As long as the SEI token stays above the $0.235 support zone, the bullish momentum remains intact. A close above $0.247 may lead to another SEI breakout, targeting the $0.255 level next. On the downside, losing $0.235 could pull SEI back into the previous range. Traders should watch for volume spikes and RSI shifts to catch the next move. Overall, SEI is maintaining a clear trend with more breakout potential ahead.
SEI Price Analysis For May 21, 2025
The SEI Coin price analysis over the last 24 hours shows multiple breakout attempts, visible support zones, and strong reactions to RSI and MACD shifts. Opening near $0.226, SEI closed marginally higher despite intraday swings, showing strong volatility and technical movement.
The Trading day opened with a brief uptrend that began around 01:00 UTC. SEI Price moved from $0.223 to $0.229, supported by a golden cross on the MACD and RSI entering the overbought zone. A rejection at $0.229 triggered a sharp pullback, leading SEI into a defined downward channel. From 01:00 UTC to 06:30 UTC, SEI Coin moved inside a clear downward channel, falling from $0.229 to $0.221. Between 06:30 UTC and 11:30 UTC, SEI shifted into a trading range between $0.221 and $0.223. MACD flashed a golden cross near 09:00 UTC, while RSI floated close to 50, hinting at a possible shift in momentum.
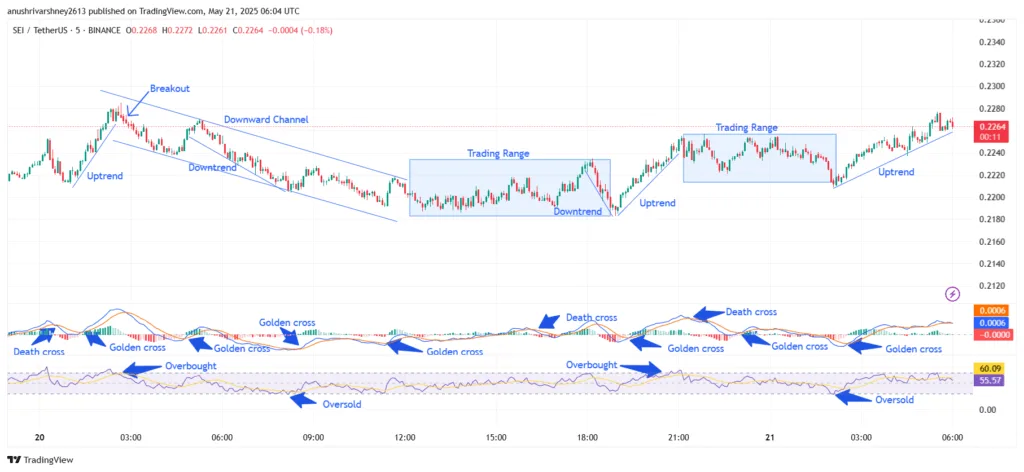
Chart 5- SEI/USDT M5 Chart, Analysed By Anushri Varshney, Published on TradingView, May 21, 2025
SEI Price fell to $0.219 in a minor downtrend, triggered by another death cross. From 13:30 UTC to 17:30 UTC, the RSI broke into overbought territory, and MACD formed a fresh golden cross, confirming bullish momentum. RSI climbed past 70 while MACD formed a fresh golden cross, signaling strong bullish momentum. However, from 17:30 to 21:30 UTC, SEI drifted sideways between $0.225 and $0.227, as volume and momentum faded. The final move came after 21:30 UTC. SEI formed higher lows as RSI moved near 60, indicating early bullish intent by 05:30 UTC. RSI hovered near 60, and MACD stayed flat, signaling a hesitant uptrend.
SEI Breakout Fails Near $0.228 as Range Holds Steady
Today, the SEI price showed a calm but structured pattern after yesterday’s volatility. Early in the session, SEI Coin attempted to break above $0.228 but failed to sustain, slipping back into a narrow range between $0.225 and $0.227. With RSI near 55 and MACD flat, momentum remained neutral. Despite minimal fluctuations, no major trend developed. Buyers continue defending support at $0.225, preventing further declines. However, a convincing breakout requires higher volume and a close above resistance. If the price can push above $0.228 with volume, the trend may turn bullish. Until then, SEI Coin remains in a wait-and-watch zone with short-term consolidation likely to continue.
SEI Coin Stays Range-Bound with Cautious Momentum
The price is holding steady after a series of SEI breakout attempts failed to gain follow-through. Throughout the day, price consolidated within a tight range just above $0.225 resistance. Both RSI and MACD signals stayed neutral, showing a lack of strong momentum on either side. Buyers are defending the lower boundary well, but sellers continue to cap upside moves near $0.228. SEI Price needs more substantial volume and a confirmed close above resistance for a clean breakout. Until then, the market remains cautious. If support at $0.225 breaks, a short-term pullback could follow. On the flip side, reclaiming $0.228 may trigger another uptrend. With the current sideways structure, traders may wait for clearer direction before entering new positions. SEI Coin showed signs of accumulation, but lacked follow-through strength.
SEI Price Analysis For May 30, 2025
The SEI price analysis shows a clear structure with multiple shifts in momentum and trend. Price action opened near $0.215 and dropped sharply into a downward channel by 00:45 UTC. The SEI Coin dipped to a low of $0.202 during this fall. RSI entered the oversold zone, and a MACD golden cross printed just after, signaling a short-term reversal.
From 00:50 to 01:40 UTC, SEI climbed steadily in an uptrend, bouncing from $0.202 to $0.209. MACD confirmed the strength with multiple golden crosses, and RSI climbed above 60. This uptrend was short-lived as the SEI price entered a wide trading range from 02:00 to 05:45 UTC, fluctuating between $0.208 and $0.211. The momentum was mixed, and traders were indecisive. MACD flipped between golden and death crosses, while RSI hovered near neutral.
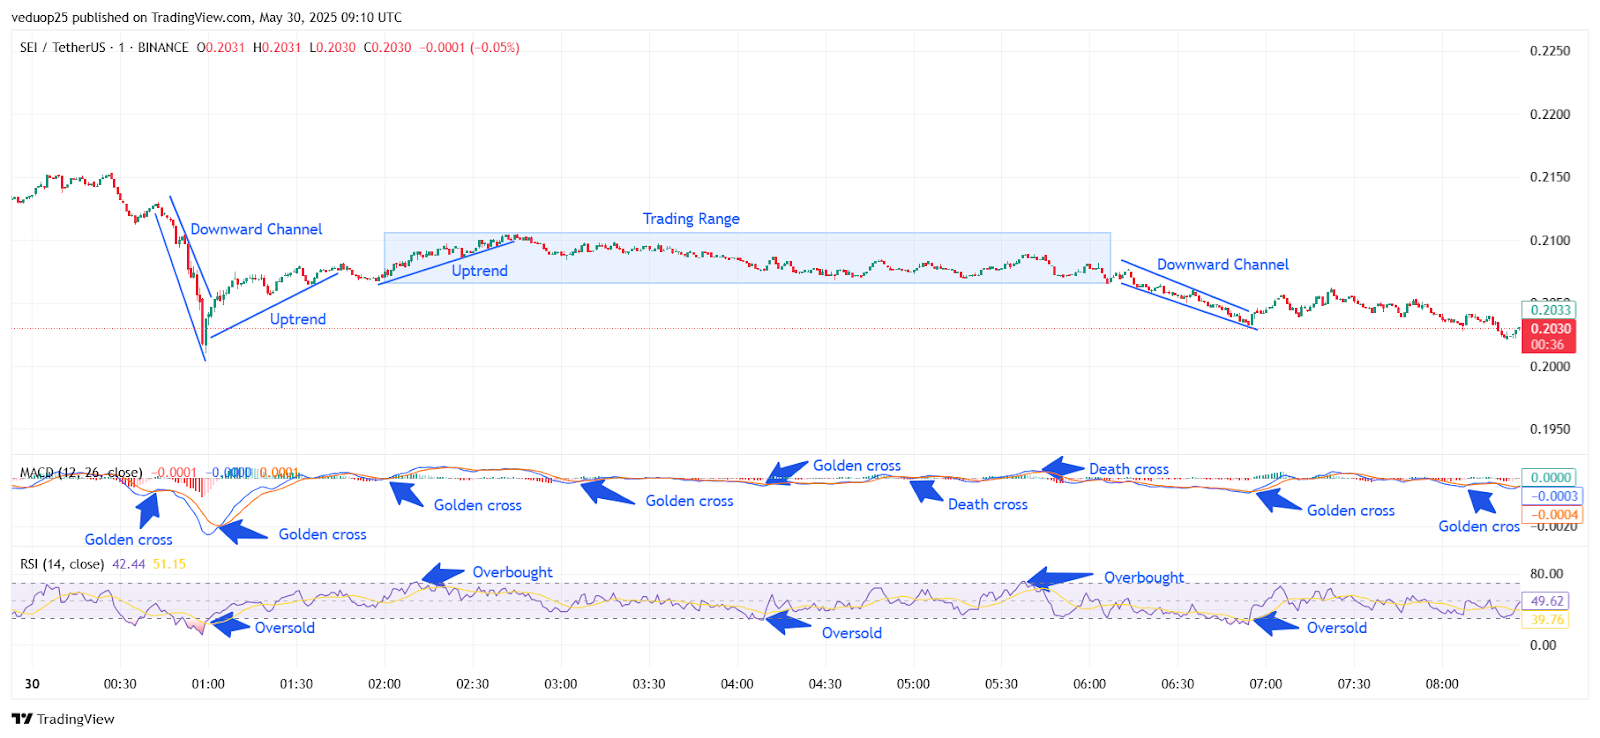
Chart 6- SEI/USDT M1 Chart, Analysed By Anushri Varshney, Published on TradingView, May 30, 2025
Around 04:30 UTC, a MACD death cross appeared, followed by another one at 05:00 UTC. However, no heavy drop followed as the price stayed inside the range. RSI briefly touched the oversold zone near 04:45 UTC but recovered quickly.
SEI Drops from $0.210 to $0.202, Fails to Reclaim $0.205
By 05:50 UTC, the SEI Coin broke below the range and formed a second downward channel, slipping from $0.210 to $0.202 by 06:40 UTC. A MACD death cross confirmed the bearish move. RSI also showed a fresh overbought to oversold rotation during this fall, supporting the sell-off. Between 07:00 and 08:00 UTC, a mild bounce followed. The SEI price climbed from $0.202 to $0.205. A golden cross appeared on MACD, but RSI stayed below 50, suggesting limited strength. The rebound lacked follow-through, and SEI slipped back below $0.204.
In the final hour, SEI traded flat between $0.202 and $0.204. A weak MACD golden cross showed up around 08:10 UTC, but no real buying came in. RSI held near 42, still under the 50 mid-line. The SEI Coin closed the session at $0.203, slightly above its intraday low.
SEI Coin Outlook Remains Cautious Below Key Resistance
The SEI Coin closed the session near $0.203, failing to show any decisive move after a full day of mixed signals. The price formed two clear downward channels and one short uptrend, but all recovery attempts were capped below the $0.208 resistance. RSI stayed mostly below 50 after the early uptrend faded, reflecting weak buyer momentum. No confirmed SEI breakout occurred during the session, and the range between $0.202 and $0.208 continues to hold.
For bulls to regain control, the SEI price must break and hold above the $0.208 resistance level. On the downside, if $0.200 is breached, further downside could develop. Until a breakout happens, SEI Coin remains range-bound and directionless. Traders should stay cautious and watch for stronger volume or cleaner signals to confirm the next trend move.
SEI Price Analysis For June 3, 2025
The SEI price analysis shows a clear rotation between bullish channels and bearish phases, with momentum fading near key resistance and support levels. SEI Coin traded in sharp patterns across the day, reflecting traders reacting to breakout signals, RSI extremes, and MACD crossovers. SEI started the day near $0.2000 and quickly entered an upward channel around 00:15 UTC, pushing toward $0.2040. During this early rally, RSI moved above 70, signaling an overbought condition. The bullish momentum was confirmed by a MACD golden cross, hinting at strong short-term buying. This first wave topped out near 01:50 UTC, where price exhaustion kicked in.
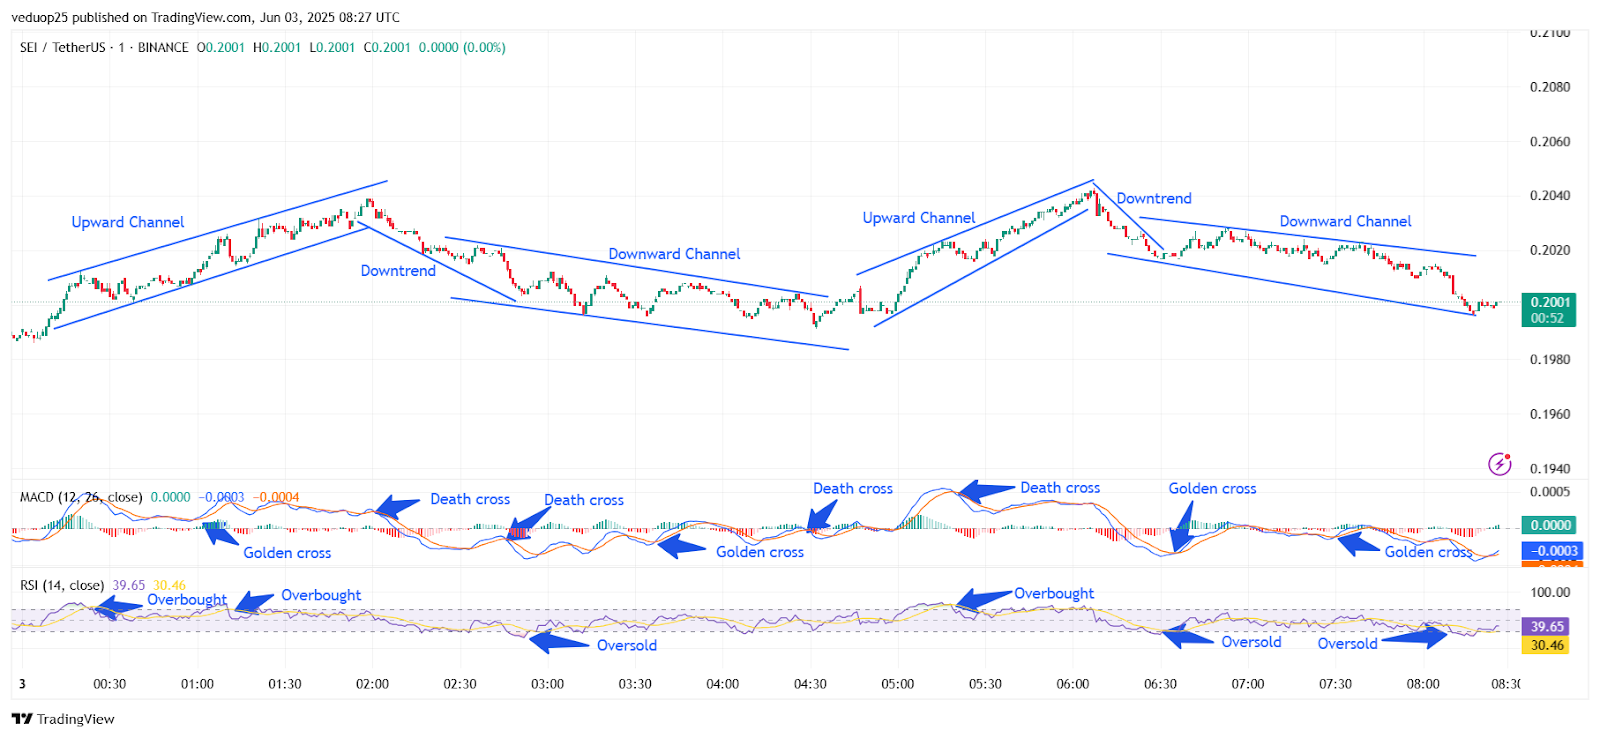
Chart 6- SEI/USDT M1 Chart, Analysed By Anushri Varshney, Published on TradingView, June 3, 2025
Following the peak, the SEI price reversed, breaking down from the channel and entering a short-term downtrend around 02:00 UTC. RSI pulled back fast, while MACD formed a death cross, confirming the shift. SEI dropped to nearly $0.1985, finding temporary support and creating a downward channel by 02:45 UTC. RSI then dipped into the oversold zone below 30, showing that the sellers may have overextended.
SEI Price Rejected at $0.2060 Drops to $0.1980 Support
From 04:00 UTC, a new phase of recovery began. SEI Coin formed another upward channel, breaking out from the lower trendline. A MACD golden cross triggered alongside a steady RSI rise, bringing back some buying pressure. Price climbed again toward the $0.2060 zone by 05:30 UTC, retesting earlier highs. Once more, RSI spiked above 70, suggesting the asset was again overbought. By 06:00 UTC, the pair began to decline, with a confirmed death cross on the MACD and RSI slipping below 50. This marked the start of another downtrend, which evolved into a descending channel after 06:30 UTC.
Prices steadily dropped, reaching $0.1980 by 08:00 UTC, where RSI showed oversold conditions twice. The SEI price has now returned to the same range it started from, near $0.2000, reflecting indecision after multiple swings. Short-term traders are reacting to breakout attempts and failing to hold above $0.2040, which now stands as key resistance. On the downside, support remains firm at $0.1980. If SEI breaks above $0.2040, a push toward $0.2080 could follow. On the other hand, a breakdown below $0.1980 might trigger further weakness toward $0.1950.
SEI Price Remains Neutral Between Key Levels
The SEI Coin price saw a sharp rise toward $0.2060 during the early recovery phase but failed to hold gains as selling pressure returned quickly. The golden cross on the MACD and overbought RSI signaled temporary bullish strength, but the momentum faded after 06:00 UTC. A death cross took place to promote SEI into a consistent downtrend that fell short at the $0.1980 support area. SEI has been range-bound and will do so until it breaks out without being catalyzed by short-term traders, as they are mentally controlling the trades.
A confirmed SEI breakout over $0.2040 could lead to upside towards $0.2080, but unless the lowest level is broken at $0.1980, things don’t look good, and losses toward $0.1950 could be in order. Until then, the SEI price is likely to stay volatile, offering quick setups for intraday moves.
SEI Price Analysis For June 5, 2025
The SEI price analysis highlights a balanced mix of trading ranges, channels, and multiple golden crosses, but no strong SEI breakout. Price opened around $0.1926 and stayed flat until 00:30 UTC, trading sideways inside a tight range. Momentum was quiet, with RSI near 50 and MACD lines hugging each other. At 00:45 UTC, SEI coin attempted a slow move upward, forming a short upward channel. This uptrend was backed by a golden cross on the MACD around 01:00 UTC and an RSI bounce from the oversold zone.
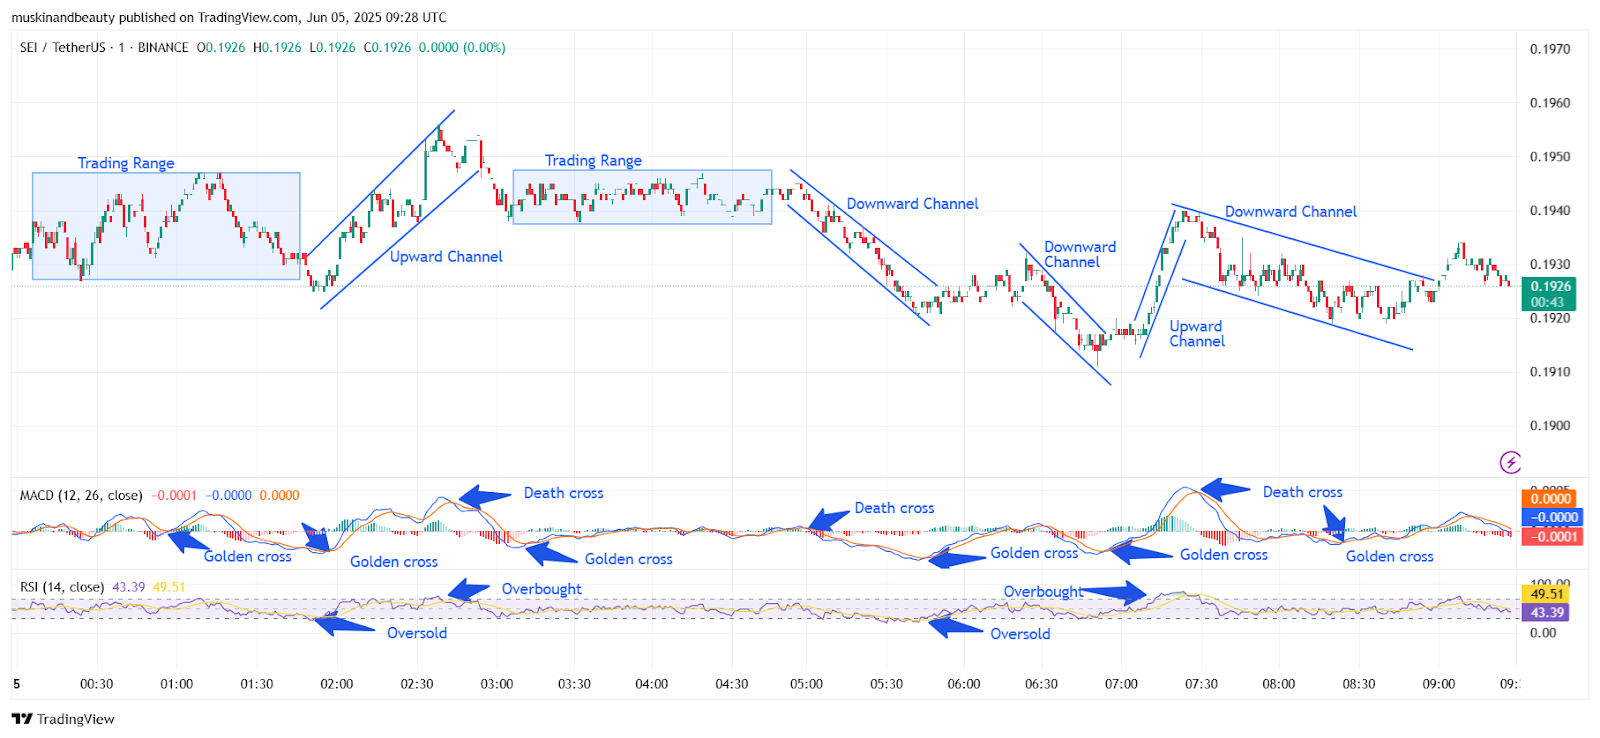
Chart 7- SEI/USDT M1 Chart, Analysed By Anushri Varshney, Published on TradingView, June 5, 2025
SEI price moved from $0.1924 to $0.1938 before stalling near local resistance. By 02:15 UTC, the pair broke out of the channel but failed to hold gains. A death cross on the MACD at 02:50 UTC marked the end of bullish momentum. Price pulled back slightly and moved into another tight range until 04:30 UTC, with no strong volume and flat indicators. RSI briefly touched the overbought zone, but no SEI breakout followed. From 04:45 UTC, a downward channel started forming. SEI price dropped from $0.1932 to $0.1914 over the next hour, with the MACD showing a gradual bearish crossover. RSI also trended lower, touching the oversold region by 05:30 UTC.
SEI Trades Between $0.1910–$0.1939 With No Clear Breakout
Between 06:00 and 06:30 UTC, the SEI coin remained within another tight downward channel. A golden cross formed on MACD near 06:10 UTC, helping the price recover slightly from $0.1910 to $0.1922. By 07:00 UTC, the RSI had climbed back above 50, signaling a temporary increase in strength. The strongest upward move came around 07:15 UTC, as SEI price rallied in a short upward channel to $0.1939. RSI hit the overbought zone again, but the rally was short-lived. A death cross on MACD at 07:45 UTC signaled trend weakness, and the price started sliding into another downward channel.
From 08:00 to 09:00 UTC, SEI traded inside this falling structure. MACD flipped between golden and death crosses but failed to offer clear momentum. RSI stayed mostly neutral, ranging between 43 and 50. Despite multiple minor rallies and dips, no decisive SEI breakout was seen. The overall tone was neutral with intraday swings inside channels without any directional conviction.
SEI Price Stays Range-Bound Despite Intraday Volatility
The price ended the day nearly neutral, reflecting a session full of intraday movement but no clear direction. While SEI coin showed brief momentum bursts through upward and downward channels, none resulted in a sustained SEI breakout. Early golden crosses on the MACD and repeated RSI flips between oversold and overbought zones suggested active short-term trading, yet lacked conviction from buyers or sellers.
The price bounced between $0.1910 and $0.1940 throughout the day, forming multiple channels but never closing outside this tight band. Each rally faded quickly, and bearish pressure pulled the price back into the range. Indicators like RSI and MACD remained reactive but not dominant. To shift the bias, bulls must break and hold above $0.1940 with volume support. Traders may need to wait for clearer signs before entering larger positions.
SEI Price Analysis For June 7, 2025
The SEI price analysis shows a full cycle of bullish momentum, breakout phases, and a late-session consolidation as the SEI coin traded inside both trend channels and a sideways range. The session began with a small upward push around 00:15 UTC, where SEI entered a steep rising channel. This move was supported by a MACD golden cross and rising RSI values, pushing the price from the $0.1840 level toward $0.1865 by 00:45 UTC. From 01:00 UTC to 02:30 UTC, SEI formed a broader ascending channel. The SEI coin stayed strong inside this formation as buyers held higher lows, and MACD printed another golden cross.
The RSI hovered near overbought multiple times, confirming a strong short-term uptrend. By 02:50 UTC, SEI Price had reached above $0.1880, with momentum continuing to build. Between 03:00 UTC and 04:00 UTC, the price pulled back slightly but remained inside a new rising structure. MACD remained bullish through back-to-back golden crosses, while RSI stayed elevated.
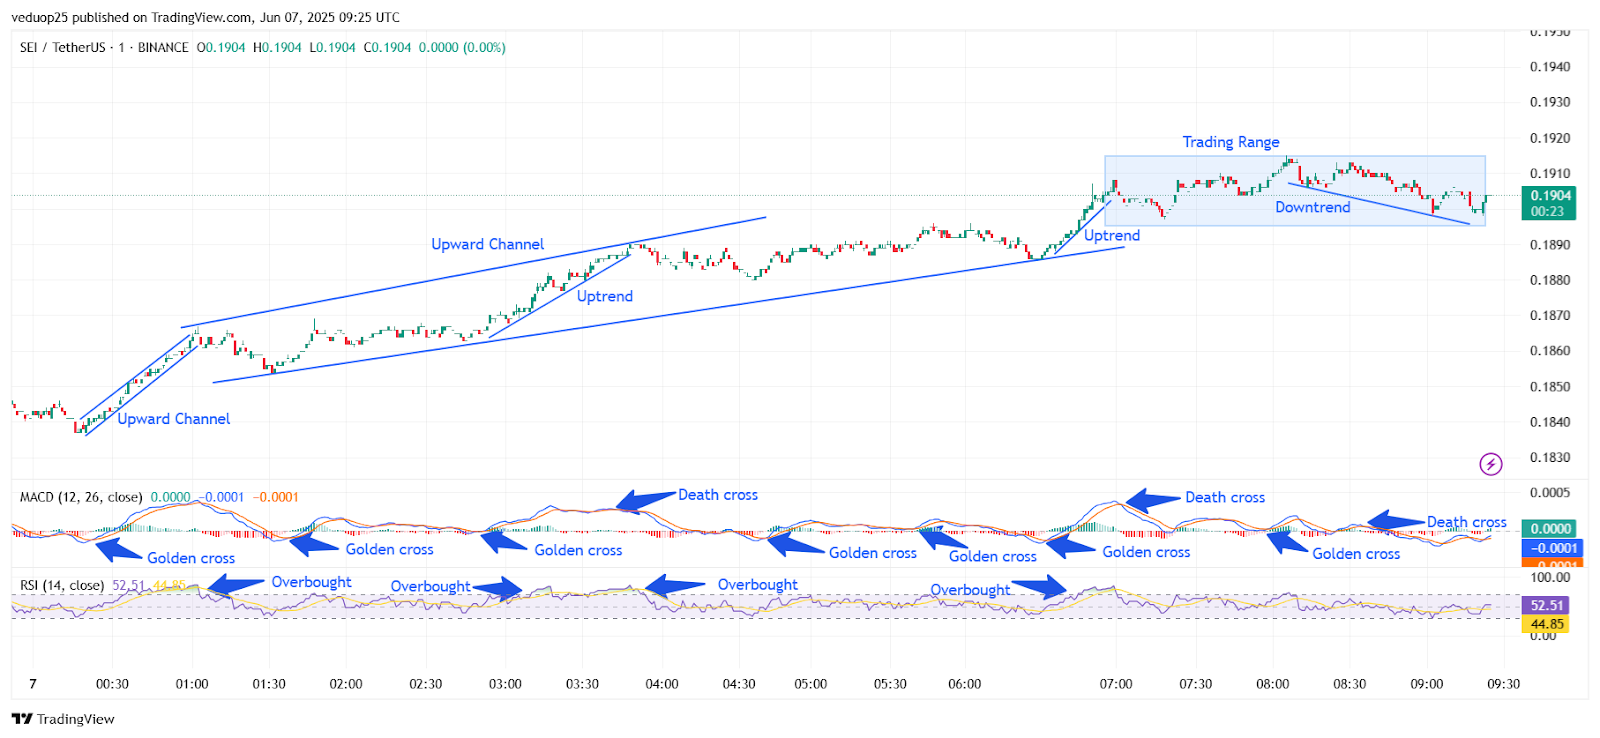
Chart 8- SEI/USDT M1 Chart, Analysed By Anushri Varshney, Published on TradingView, June 7, 2025
This move helped SEI’s price climb closer to the $0.1895 zone by 04:20 UTC, showing no major weakness yet. At around 05:00 UTC, a clearer SEI breakout attempt was made. The coin sharply moved upward again, reaching near $0.1920 by 06:00 UTC. A golden cross in MACD confirmed this move, and RSI briefly entered overbought. This marked the peak of the bullish session.
SEI Price Rejected at $0.1920 Resistance, Consolidates Near $0.1900
However, after 06:30 UTC, SEI entered a consolidation range. The price started moving sideways between $0.1890 and $0.1920. This trading range lasted for several hours and was marked by multiple death crosses in the MACD, showing fading bullish momentum. RSI also cooled down to neutral levels, staying between 50 and 55.
From 07:00 UTC to the end of the session, SEI coin showed signs of weakness as it trended slightly downward within the range. By 09:25 UTC, SEI price hovered around $0.1904, with the MACD flattening and another death cross appearing. RSI stood near 52, signaling a neutral phase. The SEI breakout above $0.1920 failed to hold, and the price is now trapped in a tight range. Key resistance remains at $0.1920, while support lies near $0.1880.
SEI Coin Slows After Breakout as RSI Cools and MACD Turns Flat
SEI coin showed strong bullish momentum for most of the session, marked by multiple upward channels and multiple MACD golden crosses. The SEI price surged from the $0.1840 level to a local high near $0.1920, supported by consistent RSI strength and clean SEI breakout patterns. However, once that breakout zone was hit, the price started moving sideways inside a tight trading range, with the MACD flipping into a neutral zone through a series of death crosses.
The RSI also declined from overbought to a balanced reading near 52, indicating a pause in buying pressure. The SEI coin is now sitting at a critical point, with strong support around $0.1880 and resistance near $0.1920. A breakout above this range could lead to another bullish phase, while failure to hold the support might invite short-term weakness.
SEI Price Analysis of June 11, 2025
The SEI price analysis shows a full cycle of trend shifts, with SEI coin moving from deep selling pressure into a structured breakout phase. The day began with a sharp downtrend as the SEI price dropped from around $0.2095 near 00:00 UTC, breaking into a clear downward channel. This bearish leg lasted until 01:45 UTC, where SEI reached a local low near $0.2040. The RSI hit oversold territory earlier around 01:00 UTC, hinting at exhaustion.
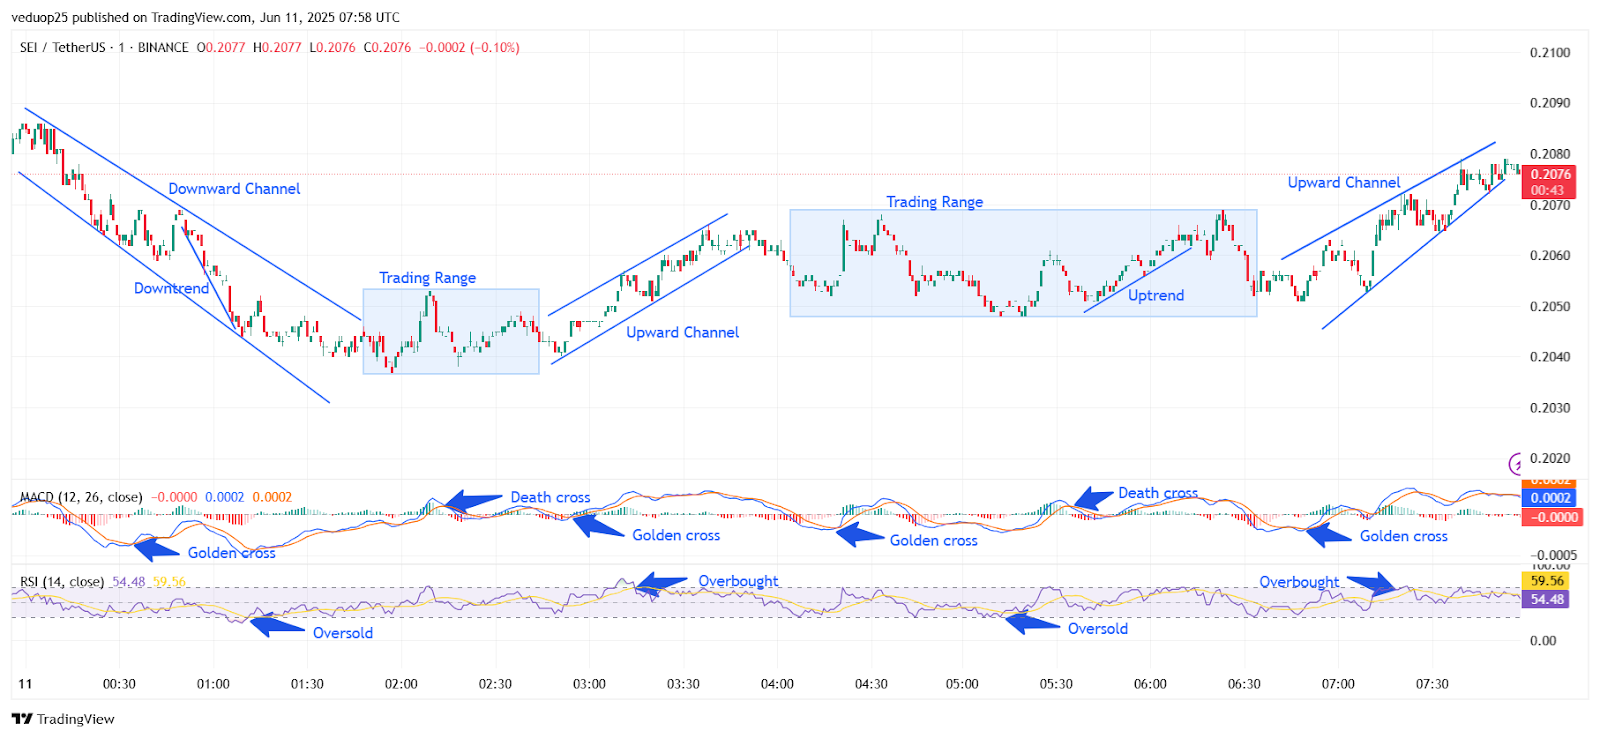
Chart 9- SEU/USDT M1 Chart, Analysed By Anushri Varshney, Published on TradingView, June 11, 2025
A MACD golden cross soon followed around 01:20 UTC, signaling the start of reversal momentum. Between 01:45 and 02:45 UTC, SEI Coin traded within a range of $0.2040 to $0.2055. This sideways action cooled the RSI back to neutral levels, and the MACD showed mixed signals with a death cross near 02:25 UTC, keeping the market cautious. A breakout came around 02:50 UTC as the SEI price pushed out of the range into an upward channel, gaining steady momentum. The pair moved from $0.2055 to $0.2070 by 03:40 UTC. The RSI jumped above 70, hitting overbought levels around 03:20 UTC, while a second MACD golden cross supported the bullish trend.
SEI Price Reclaims $0.2080 After Uptrend, Holds Support Above $0.2060
After peaking, SEI entered another trading range from 03:45 to 05:50 UTC, holding steady between $0.2060 and $0.2070. A temporary dip around 05:30 UTC triggered a brief RSI oversold signal, but the price held firm. The MACD printed a death cross here, showing cooling momentum. A small uptrend followed at 06:00 UTC, leading into a cleaner upward channel formation from 06:30 to 07:50 UTC.
The SEI price climbed steadily to reclaim $0.2080, showing clear signs of a SEI breakout backed by bullish structure. RSI hovered near 60, while MACD gave a third golden cross around 07:00 UTC. By the close of the 24-hour session, SEI coin was trading at $0.2076, holding above short-term support and maintaining higher lows. The structure shows solid strength, with the potential for continuation if bulls hold above $0.2060.
SEI Coin Holds Bullish Structure With Breakout Potential Ahead
The SEI price action reflects a clean reversal from bearish conditions into a more structured and controlled uptrend. After recovering from the sharp downward channel early in the session, SEI coin maintained steady momentum through multiple breakout attempts, supported by bullish RSI and MACD signals. The consistent presence of golden crosses and higher lows suggests that the buyers are gradually regaining control.
With the SEI price stabilizing above $0.2070 and holding its position inside an upward channel, the market structure favors another leg higher, especially if the $0.2080 resistance is cleared on stronger volume. Short-term support near $0.2060 remains critical to avoid renewed selling pressure. Momentum indicators have cooled down just enough to allow room for further upside. Overall, SEI coin is showing strength, and if current levels hold, another SEI breakout above the recent high could unfold in the next few sessions.
SEI Price Analysis For June 16, 2025
The SEI price analysis shows a steady mix of recovery and resistance. SEI Coin moved through multiple patterns, including channels, trading ranges, and a late-session breakout attempt. The day began with a bearish sentiment. Between 00:00 and 01:15 UTC, SEI moved inside a downward channel, dropping from $0.1765 to around $0.1725. RSI briefly dipped into oversold territory, and shortly after, a golden cross appeared on the MACD, signaling the start of a shift in momentum.
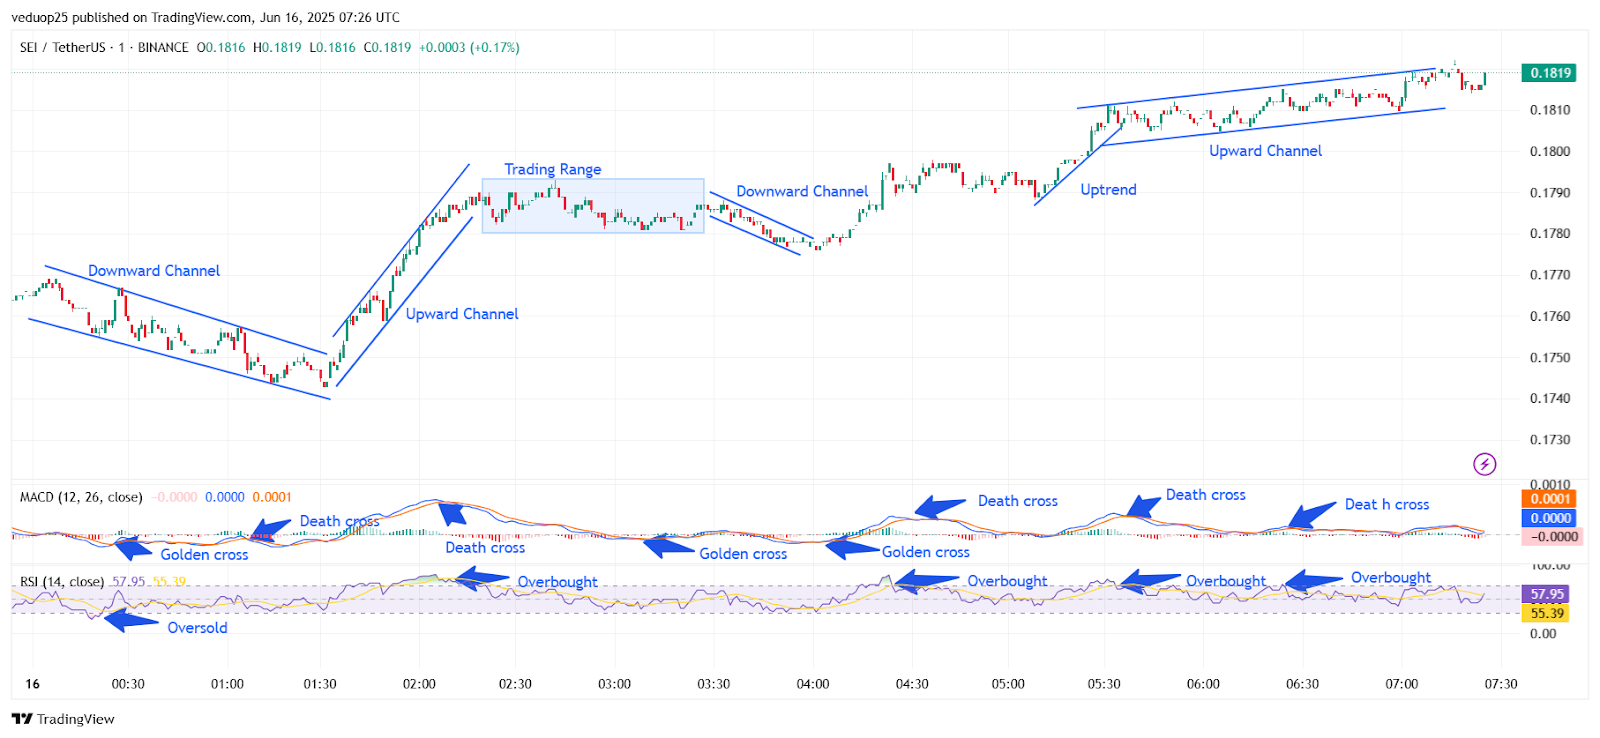
Chart 10- SEI/USDT M1 Chart, Analysed By Anushri Varshney, Published on TradingView, June 16, 2025
From 01:30 UTC, SEI Coin entered a sharp upward channel, breaking above $0.1760 by 02:00 UTC. This rally triggered overbought signals on the RSI, and momentum cooled after a MACD death cross around 02:15 UTC. Price action then stabilized into a sideways trading range between $0.1765 and $0.1780 from 02:30 to 03:30 UTC, showing hesitation near the top of the earlier breakout. By 03:45 UTC, the SEI price started pulling back again, forming a downward channel that extended till about 04:30 UTC, touching intraday lows near $0.1740. RSI stayed neutral, while a second MACD golden cross hinted at a potential bottom forming.
SEI Price Holds Firm at $0.1819 Near Key Resistance
From 04:45 UTC onward, a clean uptrend followed. SEI climbed gradually from $0.1745 to above $0.1785 by 05:30 UTC. RSI rose steadily, crossing 60, and the price began forming higher lows. MACD printed a series of golden crosses, supporting this slow grind upward.
From 06:00 UTC until the end of the session, SEI was held within a narrow upward channel within a trading range between $0.1790 and $0.1825. RSI briefly reached overbought levels several times, while MACD changed from red to green with minor death crosses, demonstrating the minor indecision. However, price remained at or near the top of the range, indicating overall bullish pressure was still in force.
SEI Coin Maintains Bullish Momentum Ahead of Key Breakout Level
The SEI Price closed the session on a strong move, showing signs of resilience after multiple intraday shifts. Despite early bearish pressure, the SEI Coin managed to recover through a well-defined upward structure, supported by golden crosses and consistent RSI strength. The price held firm inside an upward channel in the final hours, closing near $0.1819 and just under the critical resistance zone at $0.1825.
With RSI hovering near 58 and the MACD showing signs of flattening, SEI coin is in a consolidation phase, awaiting a trigger for the next move. If bulls break above $0.1825 with convincing volume, a fresh SEI Breakout could push the price toward new short-term highs. However, failure to hold above $0.1790 may invite minor corrections. Overall, the SEI Price trend remains bullish with cautious optimism.


