

SHIB traded through a series of structured patterns throughout the session, starting with a move off the daily low at $0.00001316. The price broke upward from an early range, forming a spike and expanding triangle. However, the move faded after RSI entered overbought territory, and the triangle broke down, leading to further declines, a new range, and a converging triangle formed during the retracement. RSI briefly touched oversold levels before the price rebounded. A Golden Cross in MACD supported a late-session breakout, forming an upward-moving channel. The SHIB token demonstrated range-driven price action, alternating bullish and bearish momentum signals. Let’s take a look at SHIB price analysis to see what it looks like on the chart.
SHIB Price Analysis for April 29, 2025
After marking the low for the day at $0.00001316, SHIB moved to the upside and formed a range. The range broke out to the upside at 05:50 UTC, supported by a Golden Cross of MACD. Price moved to the upside, creating a spike and an expanding triangle pattern. In the meantime, at 06:45 UTC, RSI moved above level 70, indicating overbought market conditions and suggesting a reversal or at least a pullback. The expanding triangle marked the high for the day at $0.00001421. The expanding triangle broke out to the downside at 11:45 UTC, supported by a Death Cross of MACD.

Chart 1: Analysed by vallijat007, published on TradingView, April 29, 2025
Price spiked to the downside and formed a small range. The range broke out to the downside at 13:25 UTC, supported by a Death Cross of MACD. Price moved further to the downside and formed a converging triangle pattern. In the meantime, at 13:35 UTC, RSI dropped below 30, indicating oversold market conditions. The converging triangle broke out to the upside at 17:40 UTC, supported by a Golden Cross of MACD. Price spiked to the upside and formed an upward-moving channel. The day is considered to be a range day for the SHIB price.
Impending SHIB Breakout or Breakdown Ahead?
From the start of the day, SHIB consolidated inside a small range with RSI and MACD hovering near their base levels, suggesting substantial consolidation in the price. If the range breaks out to the upside, the price may break its previous high of $0.00001421. If the range breaks out to the downside, the price may drop to $0.00001300. On the other hand, if the SHIB price cannot break these two critical levels, it may continue to consolidate in the coming sessions. These two are the necessary levels for the SHIB token to fail to form a strong trend.
SHIB Awaits Breakout From Key Levels
A consolidation pattern is keeping the price movement of SHIB confined between support at $0.00001300 and resistance at $0.00001421. If SHIB surpasses resistance, it might spark renewed upward momentum. The SHIB breakout of $0.00001300 will indicate additional downward pressure on SHIB. RSI and MACD oscillate close to their baseline positions, which signals market stability with minimum price fluctuations. Before entering directional trades, traders should monitor SHIB closely because it stays within this limited price zone. This coin’s next significant price movement will probably emerge through either of these crucial levels, as their breakthrough establishes the direction for upcoming trading sessions.
SHIB Price Analysis of May 1, 2025
SHIB formed the range with resistance at $0.00001350 and support at $0.00001330. Some patterns have formed within this range. The first one is an upward-moving channel, which broke out to the downside at 05:40 UTC, supported by a death crossover of the MACD. The price spiked to the downside and formed a converging triangle pattern, but could not break the support area. The converging triangle pattern broke out to the upside at 08:10 UTC and formed an expanding triangle pattern.
The expanding triangle pattern failed to break out to either side. A minor range appeared near the resistance area, which marked the high for the day at $0.00001355, and the price broke out from the range to the downside at 12:05 UTC. The momentum from the small range was strong enough to break the support area at 12:35 UTC, supported by a death cross of the MACD. The price spiked to the downside and marked the low for that day at $0.00001280.

Chart 2: Analysed by vallijat007, published on TradingView, May 1, 2025
In the meantime, at 12:45 UTC, the RSI dropped below the level of 30, indicating an oversold market condition, suggesting a reversal or at least a pullback from the SHIB breakout from the trading range. A small range appeared in the SHIB price, which broke out to the upside at 16:35 UTC, supported by a golden cross of the MACD. The price spiked to the upside and formed a downward-moving channel. The downward-moving channel again broke out to the upside at 19:45 UTC, supported by a golden crossover of the MACD.
Shiba Inu’s Rangebound Struggle: When Will the Deadlock Break?
After surpassing charts in a descending pattern, SHIB prices climbed up before developing another downward-moving channel that finally broke the upper boundary at 23:10 UTC with MACD crossing above. The RSI indicator reached 70 at 20:25 UTC, and this developed an overbought market signal, which might lead to a trend reversal or momentary pullback in the present upward pattern. The price displayed a small converging triangular pattern until it broke downward at 02:30 UTC.
A death cross of the MACD supported the breakout. The price spiked to the downside from the converging triangle and formed a small range. The range broke out to the downside at 03:50 UTC, supported by the death cross of the MACD. The SHIB breakout from the range failed to form a spike to the downside; instead, the price reversed and again filled the small range. This indicates the range behavior in the SHIB price, which could continue.
The SHIB token requires a strong breakout of $0.00001350 or $0.00001280 levels because these points represent past resistance and support areas, respectively. A strong market trend for SHIB Token seems unlikely if it fails to surpass these crucial support and resistance levels, which stand at $0.00001350 and $0.00001280, respectively.
SHIB’s Endless Pattern Cycle: Triangles, Channels, and Failed Breakouts
The SHIB token remains range-bound between key levels at $0.00001350 resistance and $0.00001280 support. Multiple patterns have failed to establish a sustained breakout, including channels, triangles, and micro-ranges. MACD Death Crosses and Golden Crosses support short-term moves, while RSI signals indicate frequent overbought and oversold conditions. Despite several breakouts, momentum has been inconsistent, with price often returning to previous ranges. A lasting period of lack of decision will persist unless SHIB achieves decisive moves above $0.00001350 or below $0.00001280. The key levels should receive trader attention for trend changes, but traders must be aware of potential false breakouts in the consolidation area.
Shiba Inu (SHIB) Price Analysis of June 2, 2025
The Shiba Inu trend began the session in a consolidation phase before breaking to the downside, which quickly reversed and gave rise to an upward-moving channel. This bullish move marked the high for the day at $0.00001297. However, overbought RSI conditions signaled exhaustion, and a series of failed breakouts followed. The SHIB trend broke down into a bearish sequence, forming multiple ranges and channels, eventually reaching the low of the day at $0.00001269. Throughout the session, RSI and MACD triggered multiple overbought and oversold alerts, reflecting a high-churn, low-conviction market. Currently, the SHIB price is trading at $0.00001280.
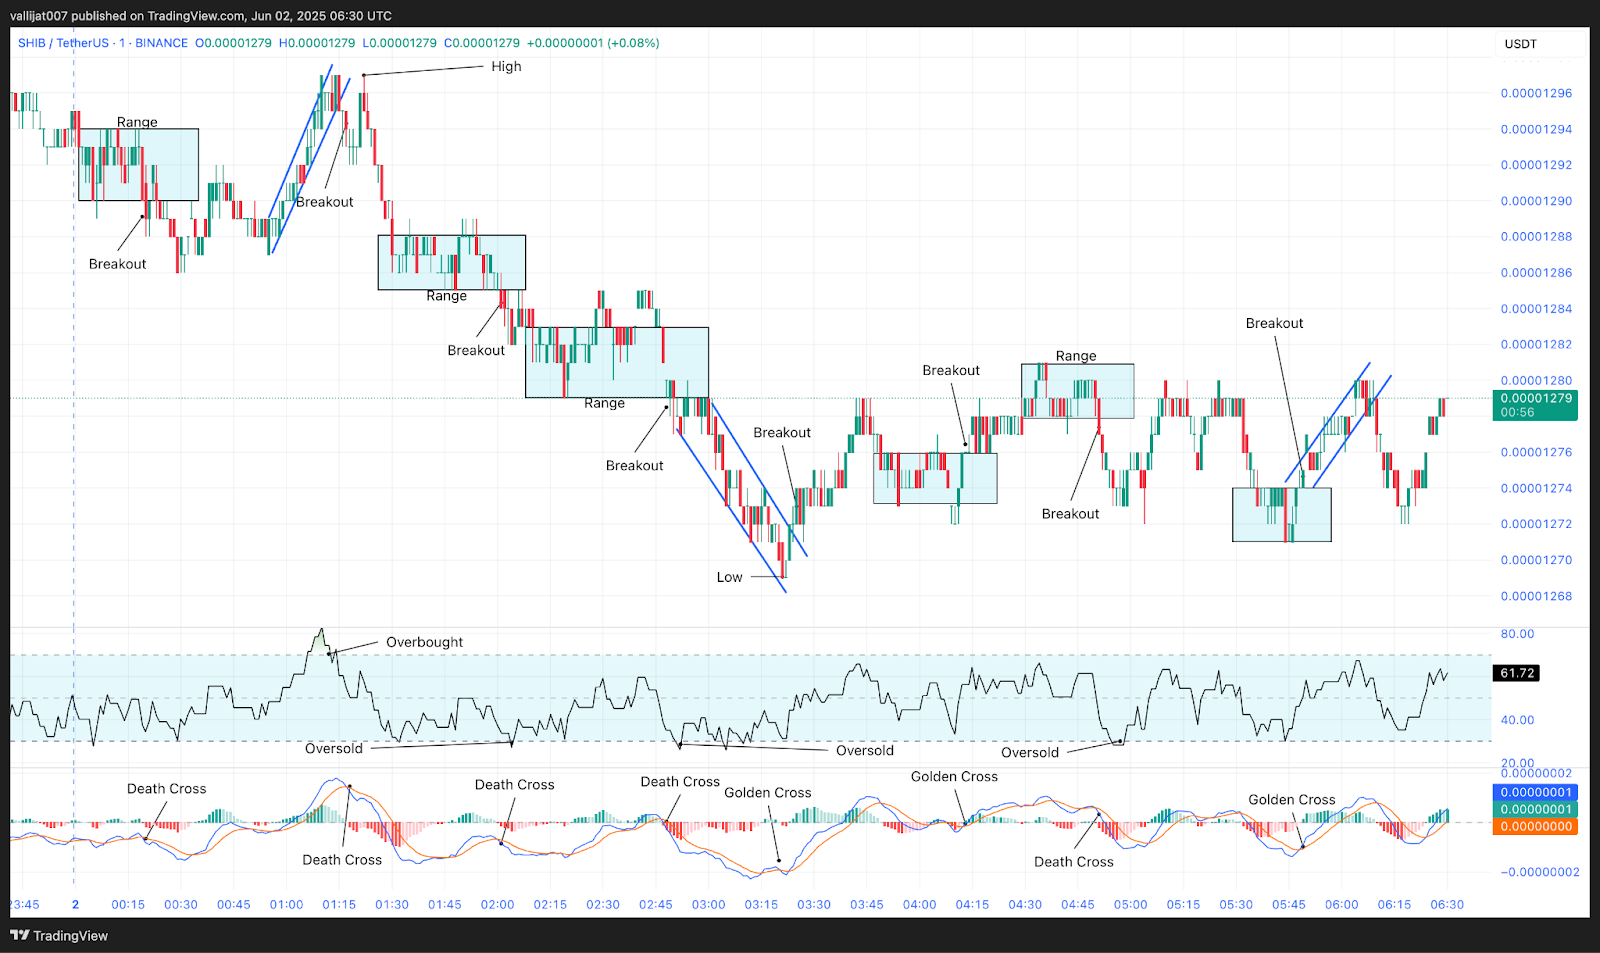
Chart 3: SHIB/USDT M1 Chart, Analysed by vallijat007, published on TradingView, June 2, 2025
The Shiba Inu price formed a range that broke out to the downside at 00:20 UTC, supported by a death crossover of MACD, but the downside breakout failed, and the price rose to the upside, forming an upward-moving channel. The upward-moving channel pushed the price higher and marked the high for the day at $0.00001297. In the meantime, at 01:10 UTC, RSI moved above the level of 70, indicating overbought market conditions and suggesting a reversal or at least a pullback.
Death Cross Breakdown Establishes $0.00001200 Low
The upward-moving channel broke out to the downside at 01:17 UTC, supported by a death crossover of MACD. The SHIB trend moved to the downside and formed a range. The range broke out to the downside at 02:01 UTC, supported by a death crossover of MACD. The Shiba Inu price moved lower and formed another range. At 02:04 UTC, RSI dropped below the level of 30, indicating oversold market conditions and suggesting a reversal or at least a pullback.
The range broke out to the downside at 02:50 UTC, supported by a death crossover of MACD, and a downward-moving channel formed. The downward-moving channel pushed the price lower, marking the low for the day at $0.00001269. The channel broke out to the upside at 03:25 UTC, supported by a golden crossover of MACD. Price moved up and formed a range. The range broke out to the upside at 04:13 UTC, supported by a golden crossover of MACD, followed by another range. The second range broke out to the downside at 04:51 UTC, supported by a death crossover of MACD.
The Shiba Inu price dropped to the downside, pushing RSI below the level of 30, indicating oversold market conditions, suggesting a reversal or at least a pullback. Another range developed, which broke out to the upside at 05:49 UTC, supported by a golden crossover of MACD. Price moved to the upside and formed an upward-moving channel. The upward-moving channel broke out to the downside at 06:10 UTC, supported by a death crossover of MACD. If the breakout succeeds, the price may drop to the level of $0.00001260. If the breakout fails, then the price may rise to the level of $0.00001300.
Shiba Inu Trapped Between Momentum Swings
Range-bound still is Shiba Inu price activity, with numerous fake breakouts in both directions. The existence of oscillating MACD crossovers and RSI triggers suggests a lack of long-term momentum. A breakout below the present level may send the SHIB price towards $0.00001260; a failed breakdown may cause a retest of $0.00001300. Until SHIB confirms a directional move with volume and follow-through, traders should approach this market with caution. The near-term trend is still uncertain; traders should lean towards range-trading techniques rather than breakout moves.
Shiba Inu (SHIB) Price Analysis June 5, 2025
Strong momentum at the opening session for Shiba Inu generated a converging triangle pattern, marking the high for the day at $0.00001319. But the bullish breakout did not set a trend, and soon selling pressure took center stage in the price movement. A series of failed upside breakouts and successful downside moves began to shape the day’s tone. SHIB moved through various formations, including downward channels, expanding triangles, and converging triangles, reflecting strong indecision but consistent bearish follow-through. By the end of the session, the SHIB price had marked a low at $0.00001269, illustrating the dominant selling sentiment. Currently, the Shiba Inu price is at $0.00001275.
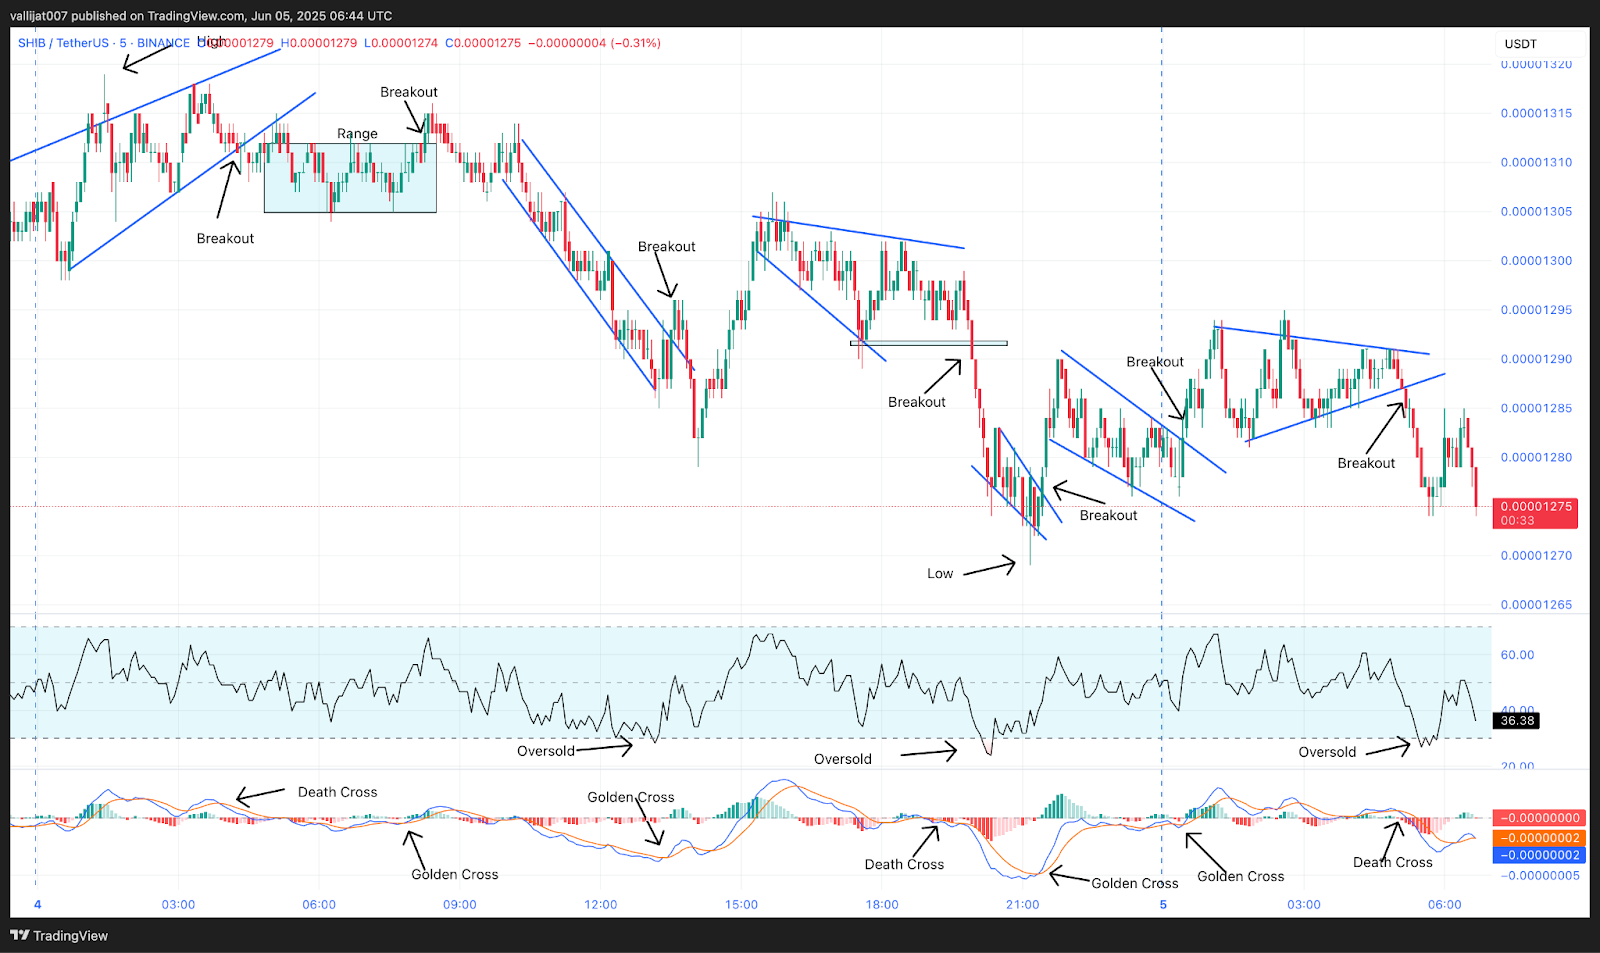
Chart 4: SHIB/USDT M5 Chart, Analysed by vallijat007, published on TradingView, June 5, 2025
Shiba Inu price formed a converging triangle pattern, which marked the high for the day at $0.00001319. The converging triangle pattern broke out to the downside at 04:15 UTC, supported by a death crossover of MACD, but the downside breakout failed, and the SHIB price formed a range. The range broke out to the upside at 08:15 UTC, supported by a golden crossover of MACD, but the upside breakout failed to create an uptrend, and the price dropped to the downside, forming a downward moving channel.
Shiba Inu Hits $0.00001269 Low Amid Bearish Trend and Weak Rallies
Supported by a golden MACD crossover, the downward-moving channel tried to break out to the upper side at 13:35 UTC. The breakout failed, however, and the price dropped again, pushing the RSI below 30, implying oversold market conditions and pointing to a reversal or perhaps a pullback. Rising slowly, the Shiba Inu trend created an expanding triangle pattern. Supported by MACD’s death crossover, this pattern broke out to the downside at 19:55 UTC and produced a convergence triangular pattern.
The RSI fell below 30 at 20:15 UTC, pointing to oversold market circumstances and implying a correction or at least a pullback. The low for the day, $0.00001269, was marked by the converging triangle pattern; then, backed by a MACD golden cross, it broke out to the upside at 21:25 UTC and formed a channel. The channel once more broke out to the upside at 00:30 UTC June 5, 2025, and the Shiba Inu trend surged to the upside, building another converging triangle pattern.
The pattern broke out to the downside at 05:10 UTC, supported by a death crossover of the MACD. At 05:30 UTC, the RSI dropped below 30, indicating oversold market conditions and suggesting a reversal or at least a pullback. The price shows selling pressure, as most downside breakouts have hit their target price, while upside breakouts have failed to sustain. Traders and investors should be cautious before placing an upside breakout trade, as Shiba Inu is currently in a bearish trend.
Bearish Momentum Weighs on Shiba Inu Token
The SHIB price action showcased a clear bearish bias. Most upward breakouts failed to gain traction, while downside breakouts frequently met their targets. RSI repeatedly entered oversold territory, signaling potential pullbacks, but each recovery attempt lacked strength. Despite intermittent golden MACD crossovers, sellers maintained control, and SHIB remained under pressure. With Shiba Inu price struggling to hold gains and patterns resolving in favor of downside movement, caution is warranted. If sentiment doesn’t shift soon, SHIB may retest lower support zones. Until buyers reclaim key levels with conviction, upside breakouts should be viewed with skepticism amid this prevailing downtrend.
Shiba Inu (SHIB) Price Analysis on June 6, 2025
The Shiba Inu trend began the session, forming a converging triangle pattern that broke out to the upside early in the session, driven by a golden crossover of MACD. A second converging triangle emerged and broke to the downside, but the move lacked strength. Around 05:30 UTC, RSI dropped below 30, signaling extreme oversold conditions. After a failed range breakout, the Shiba Inu price climbed to mark the high of the day at $0.00001297. However, continued bearish pressure led to repeated death crossovers and oversold RSI readings. The low of the day was marked at $0.00001189, followed by weak recovery attempts, keeping SHIB in a consolidation phase trading at $0.00001220.
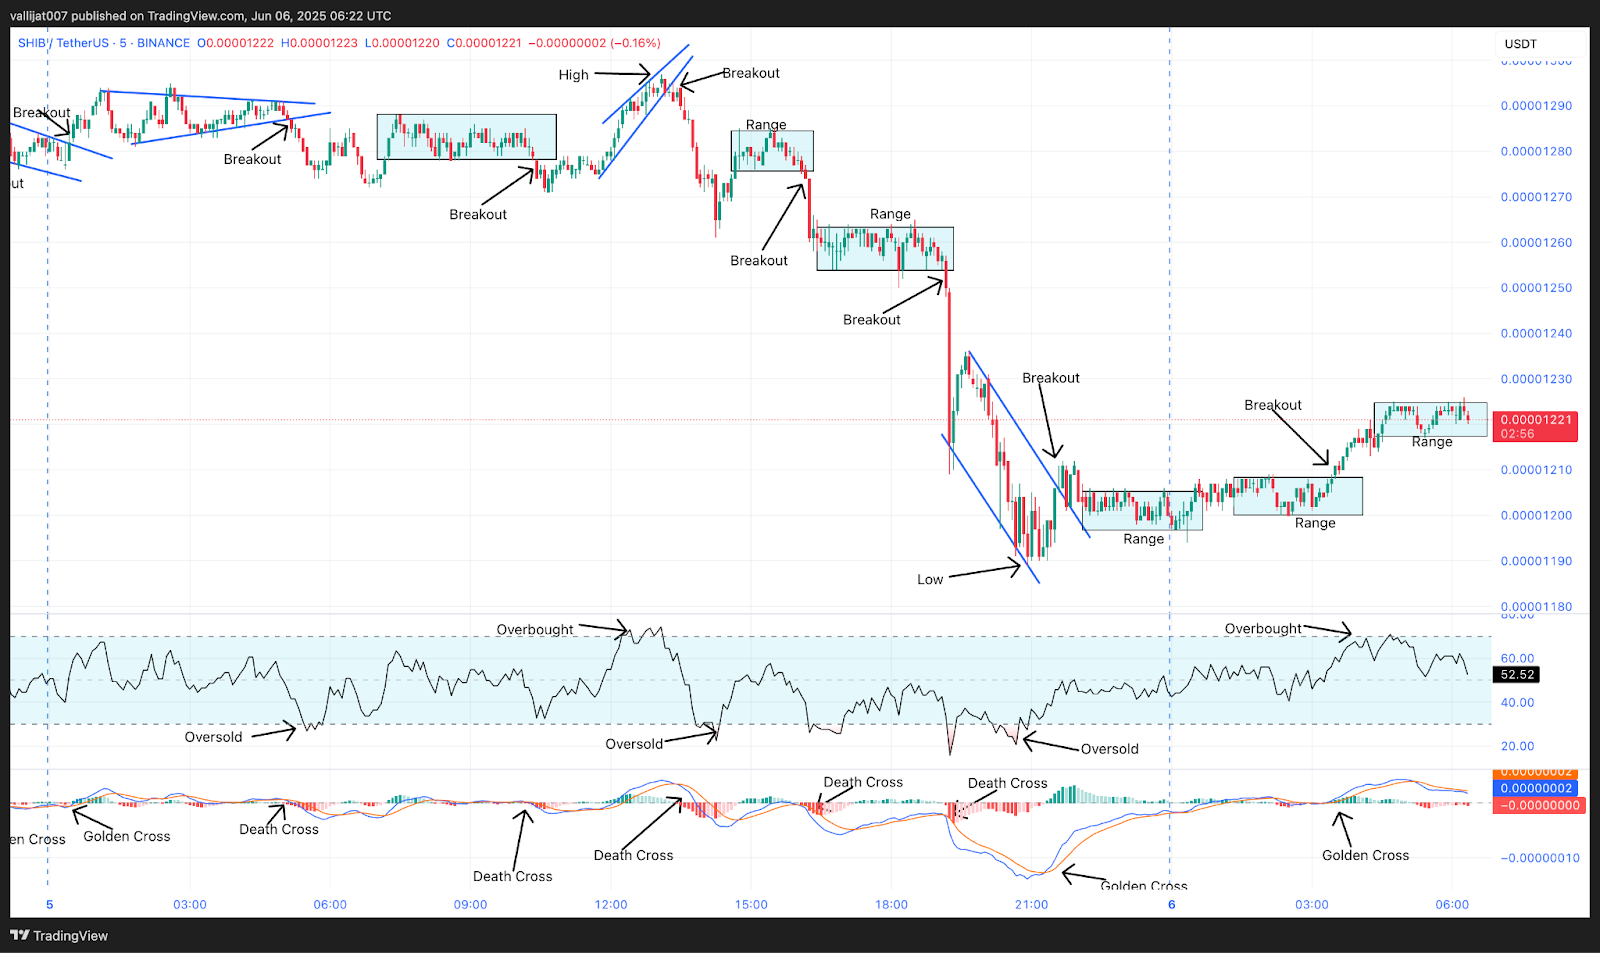
Chart 5: SHIB/USDT M5 Chart, Analysed by vallijat007, published on TradingView, June 6, 2025
The Shiba Inu price formed a converging triangle pattern, which broke out to the upside at 00:30 UTC, supported by a golden crossover of MACD, and led to the formation of another converging triangle pattern. The second converging triangle pattern broke out to the downside at 05:10 UTC, supported by a death crossover of MACD, but the downside momentum soon faded. At 05:30 UTC, the RSI dropped below 30, indicating oversold market conditions and suggesting a reversal or at least a pullback.
The Death Cross Trap: How Failed Breakdowns Create Reversal Opportunities
Price formed a range, which broke out to the downside at 10:25 UTC, supported by a death crossover of MACD, but the breakout failed, and SHIB price rose to the upside, forming another converging triangle pattern. This triangle marked the high for the day at $0.00001297. The converging triangle broke out to the downside at 13:20 UTC, supported by a death crossover of MACD, leading to a range. The range again broke out to the downside at 16:10 UTC, supported by a death crossover of MACD, and another range developed.
At 16:30 UTC, oversold conditions were indicated when the RSI once again fell below 30. At 19:10 UTC, backed by a MACD death crossover, the second range breakout to the downside created a downward-moving channel. RSI was still below 30 at 19:15 UTC, confirming the oversold state. Supported by a golden MACD crossover, the downward-moving channel breakout to the upside at 21:40 UTC, marking the low for the day at $0.00001189, but the breakout failed to create a spike, and a range formed.
This range attempted to break out to the upside at 00:30 UTC on June 6, 2025, but lacked strong momentum, leading to the formation of another range. The second range broke out to the upside at 03:30 UTC, supported by a golden crossover of MACD, forming another range. If this latest range breaks out to the upside, the Shiba Inu price may rise to the level of $0.00001300. If it breaks to the downside, the price may fall to the level of $0.00001100.
SHIB Holds Above $0.00001189 But Lacks Breakout Strength
The Shiba Inu trend is still under intense selling pressure despite occasional rises in its price. It is important to keep an eye on $0.00001189 as support. During the session, RSI frequently went below 30, which confirmed oversold conditions and made a short-term bounce plausible. Nevertheless, bullish attempts rarely lasted, and most of them ended in only sideways movements. If the current range goes up, SHIB could retest the resistance at $0.00001300. With bearish pressure, the SHIB price may decline toward the $0.00001100 support point. Before making a strong move, traders ought to treat the market with care and await confirmation for their directional bets.
Shiba Inu (SHIB) Price Analysis, June 9, 2025
The Shiba Inu trend began the session trading within a tight range before breaking out upward at 01:30 UTC, supported by a golden MACD crossover. However, the bullish move lacked momentum, and the price slipped into a downward-moving channel. Multiple failed breakout attempts and weak trend follow-through defined the Shiba Inu trend throughout the day. RSI flashed both oversold and overbought signals, underscoring the choppy nature of the market. Despite several upward breakouts, SHIB couldn’t sustain gains. It ultimately marked the high of the day at $0.00001272 and the low at $0.00001237, both tied to failed breakout patterns and sentiment reversals. Currently, the SHIB price is trading at $0.00001240.
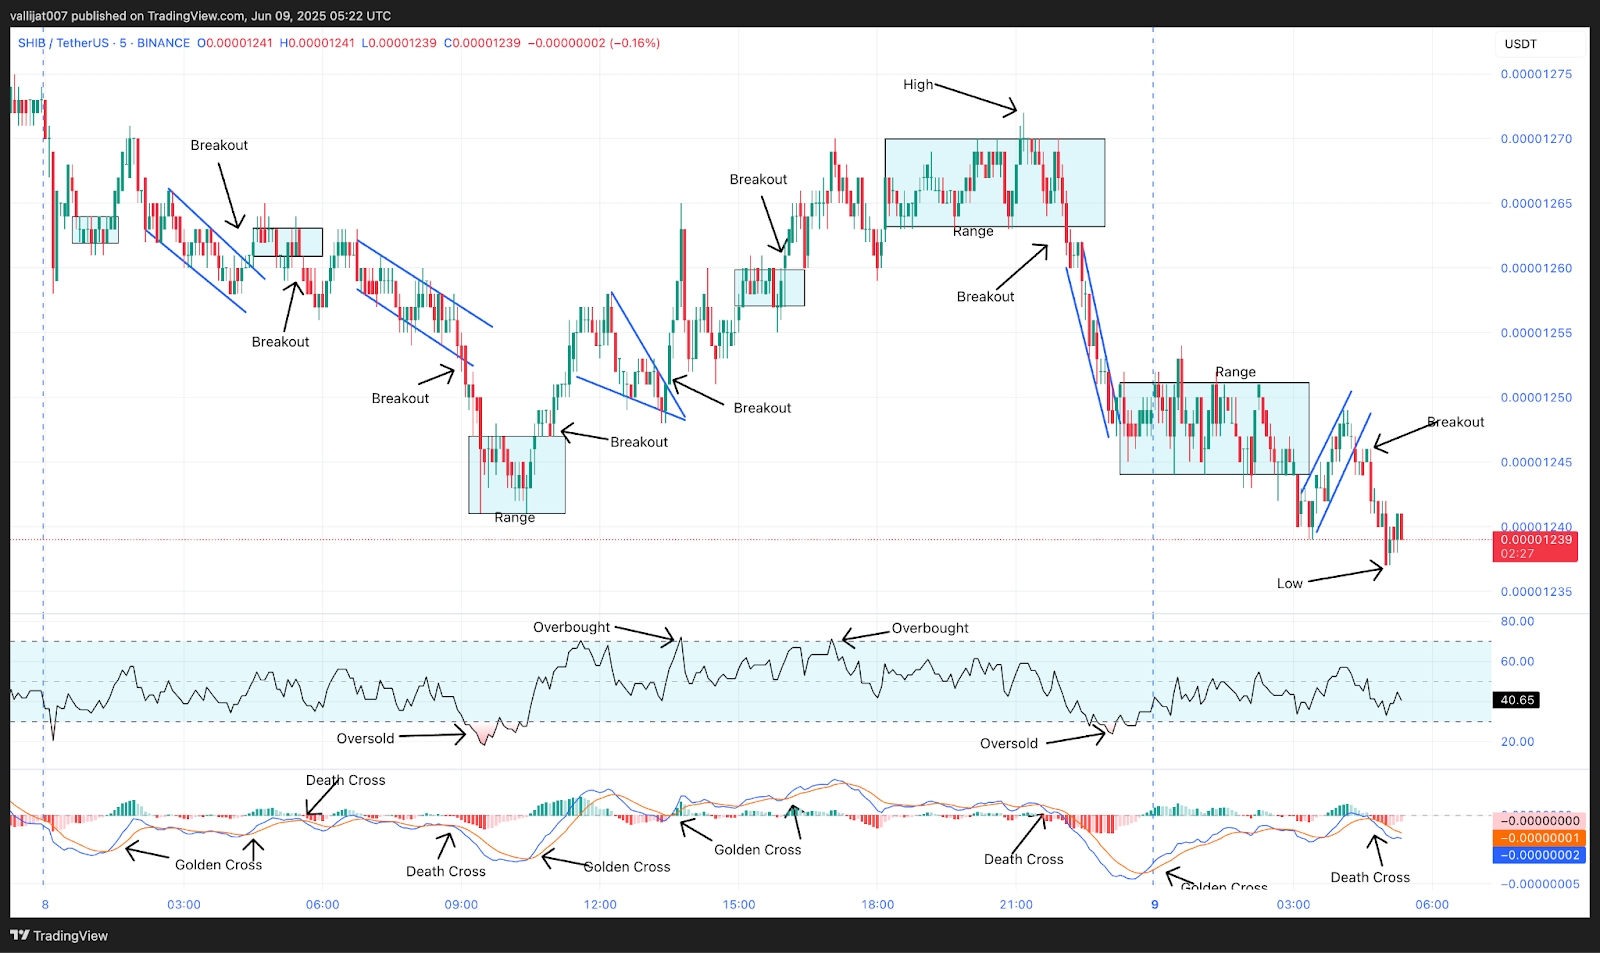
Chart 6: SHIB/USDT M5 Chart, Analysed by vallijat007, published on TradingView, June 9, 2025
The Shiba Inu price formed a range, which broke out to the upside at 01:30 UTC, supported by a golden crossover of MACD, with the price moving to the upside. However, the upside momentum soon faded, and the price formed a downward-moving channel. The downward-moving channel broke out to the upside at 04:30 UTC, supported by a golden crossover of MACD, and formed a range. The range broke out to the downside at 05:35 UTC, supported by a death crossover of MACD, with Shiba Inu price moving back to the downside and forming another downward-moving channel.
SHIB’s Choppy Session, Repeated Breakouts Fail to Sustain Momentum
Supported once again by a death MACD crossover, that downward-moving channel broke out to the downside at 09:05 UTC and established a range. Meanwhile, RSI fell below 30 at 09:30 UTC, pointing to oversold market circumstances and suggesting either a reversal or at least a pullback. At 11:00 UTC, backed by a golden MACD crossover, the range broke out to the upside and established a converging triangle pattern. RSI climbed over 70 at 11:35 UTC, pointing to oversold market circumstances and implying a turnaround or at least a pullback.
Supported by a MACD golden crossover, the converging triangle pattern broke out to the upside at 13:30 UTC, creating a range. Backed by MACD’s golden crossover, this range broke out to the upside at 16:00 UTC and established another range. RSI climbed over 70 at 17:00 UTC once more, signaling overbought circumstances and therefore pointing toward a turnaround or even a pullback. Backed by a golden MACD crossover, the range attempted to break out to the upside at 21:10 UTC, setting the high for the day at $0.00001272.
However, the range broke out to the downside at 22:05 UTC, supported by a death crossover of MACD, and formed a downward-moving channel. The downward-moving channel broke out to the upside at 23:15 UTC, supported by a golden crossover of MACD, but failed to produce a significant spike, and a range developed. The range broke out to the downside at 03:05 UTC, supported by a death crossover of MACD, but the downside breakout failed, and the Shiba Inu trend formed an upward-moving channel. This upward-moving channel broke out to the downside at 04:20 UTC, supported by a death crossover of MACD, marking the low for the day at $0.00001237.
SHIB Stuck Between $0.00001237 Low and $0.00001272 High
Shiba Inu price action showed a lack of directional conviction. While multiple golden MACD crossovers sparked rallies, nearly all attempts faded without follow-through. RSI surged above 70 twice, hinting at overbought conditions that later aligned with downside reversals. The high at $0.00001272 was short-lived, while the low of $0.00001237 followed a failed support breakdown. This back-and-forth movement indicates consolidation. If the SHIB price breaks above the day’s high, the next target may be $0.00001300. On the flip side, a break below the low could open room toward $0.00001200. Traders should avoid premature entries and wait for strong volume-backed confirmation.
Shiba Inu (SHIB) Price Analysis of June 14, 2025
Shiba Inu price opened the session trading within a range that eventually marked the high for the day at $0.00001227. After this early high, the market saw a sharp breakdown into an expanding triangle pattern, dragging the price down to a session low of $0.00001138. MACD and RSI indicators played a critical role in signaling these shifts, with oversold and overbought signals appearing multiple times throughout the session. Despite frequent breakouts in both directions, SHIB price momentum remained inconsistent. A series of failed follow-throughs in both bullish and bearish structures highlighted overall market indecision and range-bound behavior.
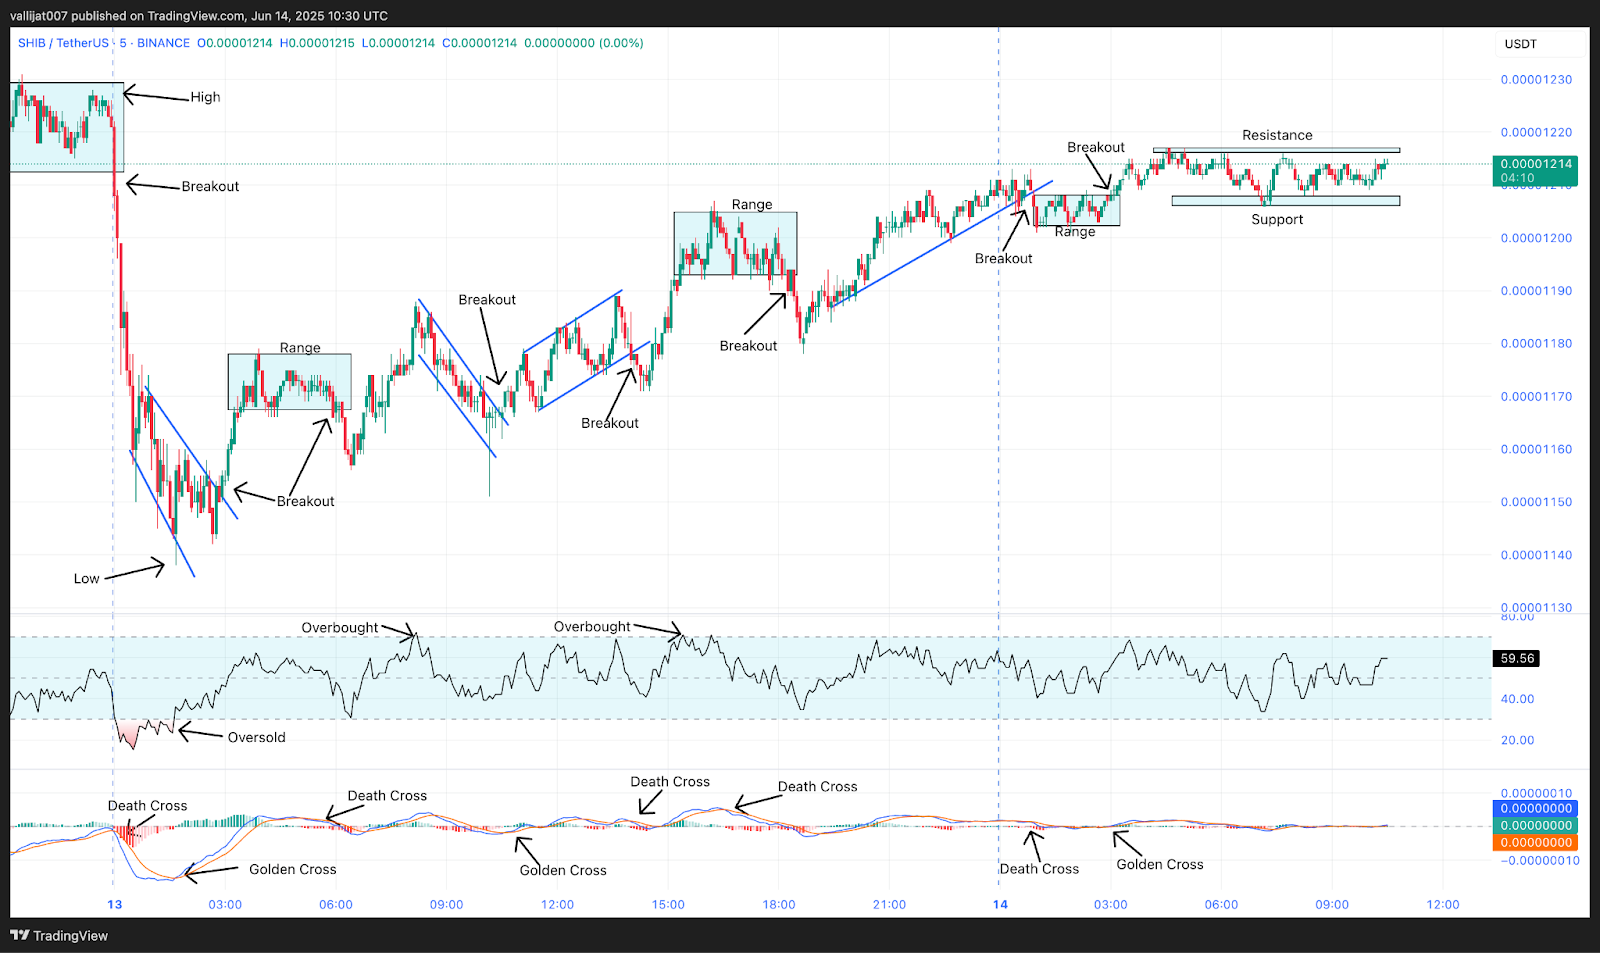
Chart 7: SHIB/USDT M5 Chart, Analysed by vallijat007, published on TradingView, June 14, 2025
Shiba Inu price formed a range, which marked the high for the day at $0.00001227. The range broke out to the downside at 00:00 UTC, supported by a death crossover of MACD, and formed an expanding triangle pattern. At 00:30 UTC, RSI dropped below the level of 30, indicating oversold market conditions, suggesting a reversal or at least a pullback. The expanding triangle pattern marked the low for the day at $0.00001138. The pattern broke out to the upside at 02:55 UTC, supported by a golden crossover of MACD, and formed a range.
Failed Breakdown at 05:55 UTC Leads to Channel Formation
The range broke out to the downside at 05:55 UTC, supported by a death crossover of MACD, but momentum soon faded, and the SHIB price rose to the upside, forming a downward-moving channel. At 08:10 UTC, RSI moved above the level of 70, indicating overbought market conditions. The downward-moving channel broke out to the upside at 10:35 UTC, supported by a golden crossover of MACD, and formed an upward-moving channel. The upward-moving channel broke out to the downside at 14:00 UTC, supported by a death crossover of MACD, but momentum quickly faded, and the Shiba Inu trend rose again, forming a range.
The range broke out to the downside at 18:15 UTC, supported by a death crossover of MACD, but the downside breakout failed, and price formed an upward-moving trendline. The trendline broke out to the downside at 00:55 UTC on 14th June 2025, supported by a death crossover of MACD, and a range developed. The range broke out to the upside at 03:00 UTC, supported by a golden crossover of MACD, and formed a resistance area at the level of $0.00001215 and a support area at $0.00001205. If the Shiba Inu trend breaks to the upside, it may reach $0.00001300. If it breaks to the downside, it may drop to $0.00001100.
$0.00001227 to $0.00001138: Range-Bound Market Leaves SHIB Directionless
Price swings of Shiba Inu during the day mirrored a choppy and indecisive market setting. Most breakouts swiftly turned or stalled even though technical systems indicated trend continuations, MACD crossovers, and RSI signals, for example. Although the price fluctuated between highs and lows for the day, it did not set a definite course. Following the low of $0. 00001138 and a little rebound, SHIB kept between a resistance zone at $0. 00001215 and support at $0. 00001205. A breach above resistance could open the door to $0. 00001300; a failure might cause a dip towards $0. 00001100. The token is still in consolidation for the present; therefore, traders ought to be wary of false breakouts.


