
SHIBA INU Coin is gaining new life as a more serious market-leading meme token, with an expanding utility base, continuing aggressive burn strategies, robust community support, and the development of the Shibarium layer-2 network. The primary goal of this technical analysis is to demonstrate important support and resistance levels of the SHIB Price while providing traders with specific outlines for breakout movement or downside corrections. We will provide support and resistance levels based on observed chart patterns, the movement of RSI indicators, MACD signals, and behavior of price channels to determine if a SHIB price breakout is possible in the upcoming trading days or if we see some short-term exhaustion followed by a pullback.
This interpretation provides useful and straightforward input based on the observed price action and other supporting market inputs. Whether you’re trading intraday or watching for trend confirmation, the following analysis captures what’s currently shaping the SHIBA INU Coin price path.
Shiba Inu Price Analysis For July 16, 2025
The SHIB price analysis shows a structured recovery from early selling pressure, followed by steady gains and a brief breakout. The session opened with a mild uptrend between 00:00 and 00:30 UTC, but this quickly faded into a downward channel. SHIBA INU Coin dropped steadily from 00:30 to 02:15 UTC, hitting a low near 0.00001330. A golden cross appeared on the MACD just before the drop, but it failed to hold. The RSI dipped into oversold territory around 02:00 UTC, triggering a bounce.
From 02:15 to 03:15 UTC, the SHIB Price started to recover. A small uptrend formed, and momentum shifted back to the bulls. A second golden cross appeared on the MACD. RSI climbed slowly, confirming buyer interest. This led to a sideways trading range from 03:30 to 05:45, where the price moved between 0.00001350 and 0.00001370. Inside this range, SHIBA INU Coin experienced minor uptrends. RSI oscillated between overbought and oversold, while MACD gave mixed signals, including a few death crosses.
By 06:00 UTC, momentum turned positive. SHIB Price entered a clear upward channel, pushing higher in a consistent trend. This strong phase lasted from 06:00 to 08:45 UTC. RSI moved back into overbought areas multiple times. MACD posted several golden crosses, showing clear buyer strength. Volume remained stable, supporting the upward drift. At 08:45 UTC, a sharp SHIB Breakout occurred.
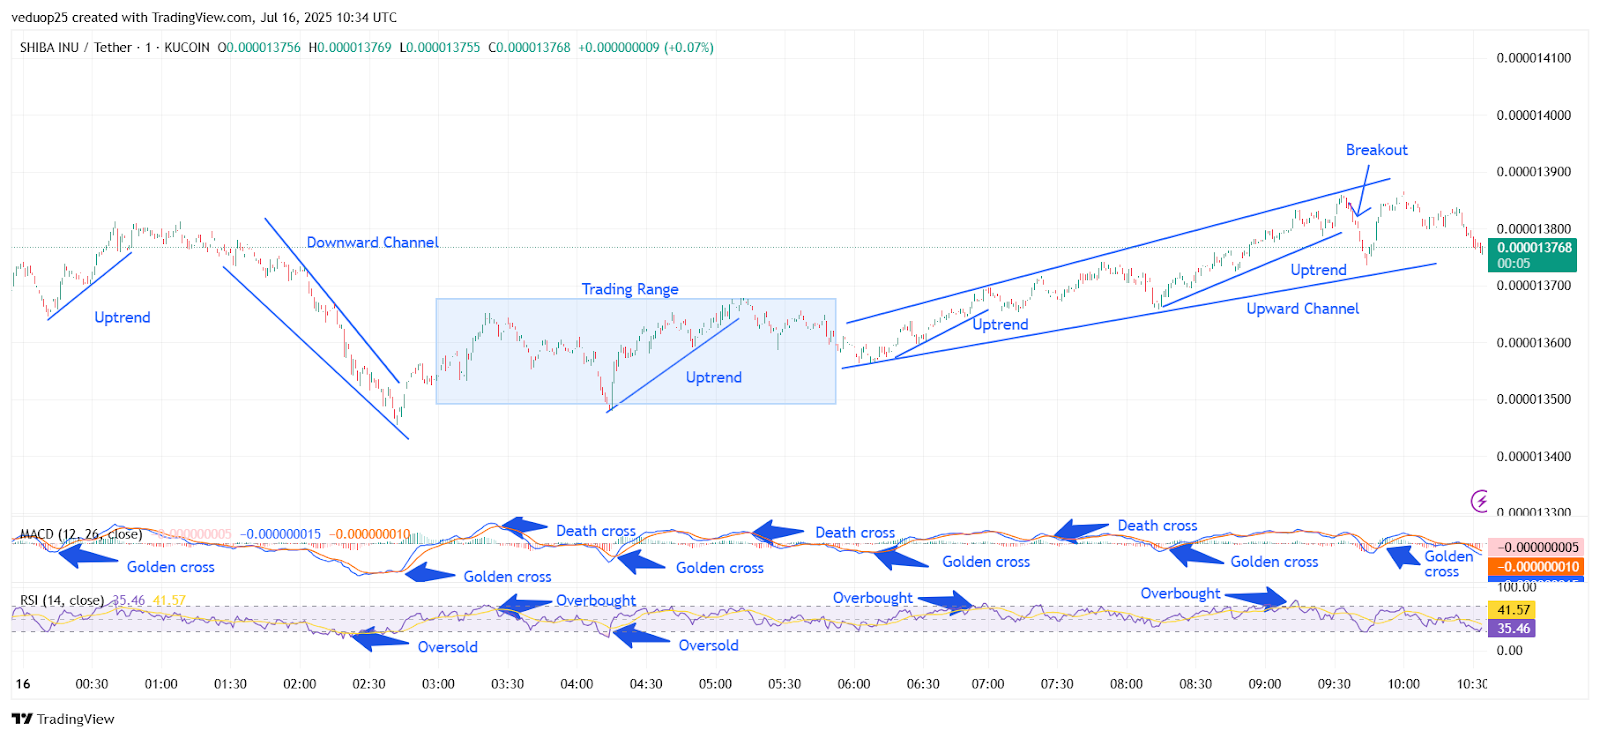
Chart 1- SHIB/USDT M1 Chart, Analysed By Anushri Varshney, Published on TradingView, July 16, 2025
Price broke above the channel near 0.00001390. The move was quick, and sellers reacted just as fast. A pullback followed by 09:00 UTC. This rejection was supported by a new death cross and a falling RSI, both signaling short-term exhaustion. From 09:30 UTC until the session closed at 10:30 UTC, SHIBA INU Coin traded sideways again. Price hovered around 0.00001375. Momentum indicators flattened. RSI cooled down to 41, while MACD showed a weak golden cross with no strong follow-up. Price remained inside the channel, holding the support.
SHIB Burn Rate Surges 2000% as Shibarium Activity and Investor Interest Rise
Shiba Inu witnessed a major shift last week as over one billion SHIB tokens were burned, marking a dramatic 2,000% increase in burn rate. This aggressive supply cut reflects growing confidence within the community. As fewer tokens circulate, investor sentiment has turned bullish. On-chain data shows rising self-custody activity, a signal that holders are preparing for long-term gains. This reduced exchange pressure often precedes upward price movement.
Shibarium, SHIB’s layer-2 network, continues to anchor this momentum. The blockchain surpassed 12 million blocks, showing real-world usage, not just hype. Its high transaction volume and efficiency improvements make it a key part of SHIB’s ecosystem growth. Analysts suggest that Shibarium’s steady expansion may act as a foundation for a future price rally.
Outside the blockchain, SHIB is attracting renewed retail interest. Google search trends have reached a two-month high, which may mean that new buyers will step into the market. Technical signals such as the RSI nearing 70 on the daily chart suggest traders would be wise to exercise short-term caution, as this indicates SHIB may be in overbought territory. No matter whether SHIB continues higher or pulls back for a brief correction, all signs indicate a project gaining serious momentum.
SHIB Price Prediction Remains Bullish Amid Burn Surge and Shibarium Growth
The recent 2,000% surge in SHIB’s burn rate, combined with Shibarium’s expanding ecosystem, provides a strong foundation for a positive SHIB Price Prediction in the near term. With over one billion SHIB tokens permanently removed from circulation, the supply shock is beginning to influence market dynamics. The on-chain data indicates that there has been an increase in self-custody, which is a typical sign of confidence by investors. Shibarium’s milestone of 12 million blocks shows there’s plenty of activity on the network, which backs the long-term utility and relevance of SHIB. In addition, Google search trends are also climbing, which is a good indicator of retail interest coming back.
The only warning sign is the RSI approaching 70, which indicates potential for a short-term pullback. Nevertheless, overall sentiment remains on the rise. The combination of decreasing supply, more users adopting Shiba Inu Coin, and active development suggests we could see some potential upside. If current trends hold, a gradual SHIB Price climb could follow, though short pullbacks should be expected. For now, all eyes remain on continued burn activity and Shibarium’s sustained growth.


