

Solana (SOL) is making headlines again, creating serious momentum across the crypto space. Fresh data from The Solana Post on X shows Solana has jumped to the second spot in crypto social discussions, tying with Ethereum in dominance. At the same time, DEX trading activity is booming, with over $3.39 billion daily volume, while open interest on platforms like Jupiter Exchange continues to climb. These points indicate a growing wave of attention and optimism building around SOL. As the buzz grows louder, traders are eyeing higher targets, with Solana’s ecosystem showing signs of strength.
🚨 $SOL (@solana) ascends to #2 in crypto social dominance, per LunarCrush. pic.twitter.com/Dqj5wlu8QD
— The Solana Post (@thesolanapost) April 26, 2025
The surge in social buzz, rising DEX volumes, and stronger open interest set a positive tone for Solana’s next moves. While some analysts call for a push toward $170, the real story is how SOL behaves around key short-term levels. Let’s dive into the latest chart to see where Solana could head next.
Solana Price Analysis of 28th April, 2025
In the early trading hours of April 27, the Solana price maintained a bearish sentiment, gradually sliding into a descending channel. The price declined from near $150 to approximately $146 by 01:55 UTC. A minor recovery followed, but SOL price entered a narrow sideways range between $146 and $148 until around 05:15 UTC. The RSI hovered around oversold levels during this time, while the MACD occasionally flashed golden crosses but lacked strong momentum. Buyers defended the $145–$146 support area, hinting at some accumulation beneath the selling pressure. The Solana price shifted into an uptrend between 06:00 UTC and 18:00 UTC, whereas the price recovered progressively above $149.

Chart 1, Analyzed by Alokkp0608, published on April 28th, 2025.
By 18:45 UTC, buyers had pushed the price to $150, attempting to break through the $152 resistance zone. Over that time frame, the RSI fluctuated between neutral and overbought, and it looked to be building bullish momentum. The indicators MACD were providing a positive signal, reflecting the rising price. However, the price was rejected and could not break through the $152 resistance zone. By 20:00 UTC, the price was slow to trend as a new downtrend channel was evident as SOL broke below $146, briefly around 01:40 UTC on April 28.
Solana Price Outlook: What Lies Ahead for SOL?
From 02:00 UTC on April 28, Solana price reversed sharply, forming a strong uptrend channel back toward the $150 mark. Buyers aggressively defended the $145–$146 support range, leading to a rally that pushed SOL to $151 by 07:30 UTC. RSI moved into overbought conditions in the latter half of this rally, indicating a possible cooling-off phase ahead. MACD showed golden crosses across multiple intervals, suggesting sustained bullish strength. SOL price trades are currently near $151, and they struggle to clear the $152 resistance. A successful Solana breakout above $152 could open the door for a rally toward $155, while failure might trigger another retest of the $147–$148 zone.
Solana Gathers Steam as Bulls Target $155
The Solana price shows signs of strength after bouncing off the $145–$146 zone and pushing back toward $151. Buyers are stepping in, and with the RSI and MACD both leaning bullish, SOL looks well-positioned for another move higher. The key to watch now is the $152 resistance; a strong Solana breakout here could open the door for a rally toward $155, while a rejection might drag prices back to the $147–$148 range for a retest. Backing up the technical picture, Solana’s rising social buzz, booming DEX volumes, and steady open interest are adding even more momentum. If Solana price keeps riding this wave, there’s a good chance we’ll see it pushing into the $155–$158 range sooner rather than later.
SOL Price Analysis of April 30th, 2025
The SOL price action on the 5-minute chart began with subdued volatility, ranging between $147.00 and $149.00 through the early hours (00:00–03:00 UTC). This sideways trend lacked directional momentum, with the RSI mostly neutral and hovering near the 50 mark. Around 04:25 UTC, Solana token dipped briefly to $145.50, breaking the lower boundary of the previous range. The MACD confirmed this bearish momentum with a death cross just before the drop. However, this down move quickly reversed, as the RSI entered oversold territory, sparking a buying response that triggered a new bullish channel upward.

Chart 2, Analyzed by Alokkp0608, published on April 30th, 2025.
From 05:15 UTC to 09:00 UTC, SOL price climbed within an ascending channel, gradually pushing towards the resistance region at $150.65. This rally peaked near $149.50, where sellers stepped in. RSI entered the overbought zone by 08:30 UTC, signaling short-term exhaustion. Meanwhile, the MACD showed a golden cross early in the uptrend, affirming bullish strength before it flattened near the rally peak. Buyers struggled to breach $149.50 convincingly. Despite several retests, momentum waned, and the Solana token entered a consolidation. Price action remained above $146.90 but failed to push past $149.35, forming a horizontal trading range.
Volatility Compression and Failed SOL Breakout
Between 09:00 UTC and 18:00 UTC, the price oscillated within the range above. Attempts to break higher were met with resistance just below $150.00. MACD showed repeated death and golden crosses, reflecting indecision, while RSI briefly touched overbought levels but didn’t sustain above 70. Notably, the trading volume during this range-bound phase was moderate, hinting at a buildup before a decisive move. At around 19:00 UTC, Solana token briefly broke above the range of nearly $149.50 but failed to maintain upward momentum. This false SOL breakout led to a sharp drop beginning at 19:25 UTC, marking the start of a bearish channel.
From 19:25 UTC to 00:00 UTC, SOL declined rapidly, falling to the support region at $145.00 by 23:10 UTC. This was a significant correction, erasing nearly $4 in value. The RSI dipped into oversold conditions again during this phase, and MACD confirmed strong bearish momentum with a clean death cross just after 19:30 UTC. The channel down showed consistently lower highs and lower lows. Although there was a brief rebound attempt after hitting the support zone, it lacked strength and was quickly countered by renewed selling. Buyers appeared hesitant to re-engage above $146.50.
SOL Price Outlook: What Lies Ahead for Solana?
In the early hours of April 30, from 00:00 UTC to 06:00 UTC, a new uptrend channel formed after SOL bounced from the $145.00 support. This movement was more stable and sustained compared to the earlier failed rebound. By 03:55 UTC, the price reached $148.60, just below key resistance, before entering sideways action again. RSI climbed steadily but did not enter the overbought zone, signaling controlled bullish momentum. MACD flashed a golden cross during the rise, though a death cross appeared again near the end of the period, suggesting slowing bullish pressure. Price stabilized around $147.10.
SOL Price Recovery at Crossroads
SOL appears to slowly regain strength after bouncing from the $145.00 support level. While there’s cautious optimism, it’s still facing strong resistance near $150.65. The recent uptrend and golden cross on the MACD suggest some bullish momentum is building, but the inconsistent MACD signals and a neutral RSI keep expectations in check. If buying pressure increases and RSI pushes above 70, we could see a retest of $149.50 and possibly a SOL breakout and move toward $151. On the flip side, if the Solana’s price drops below $145 again, the next support to watch lies around $143.20, where buyers may try to step in again.
Solana(SOL) Price Analysis of May 2nd, 2025
The Solana price action on a 5-minute chart over the past 24 hours began inside a sideways path between $147 and $150 until about 07:25 UTC. SOL Price hovered close to the support near $148 multiple times, forming temporary wicks below before recovering, signaling strong buying interest near that zone. During this period, RSI hit several overbought zones above 70, especially in minor rebounds, while MACD occasionally showed death crosses that quickly flipped. These signs pointed to uncertainty within the tight range. However, the underlying structure formed a base, setting up a potential Solana breakout if momentum could build above $150.

Chart 3- Analyzed by Alokkp0608, published on May 2nd, 2025.
Solana price eventually surged out of the consolidation zone, crossing above $150 after 07:30 UTC and forming a steady uptrend channel that peaked around $152.60 by 13:20 UTC. This rise came with consistently higher highs and higher lows, reflecting growing buyer confidence. At several points along the rise, RSI moved into overbought conditions, while MACD signaled golden crosses supporting bullish sentiment. After touching $152.60, a brief retracement brought the price down to around $150.60 before it regained footing. Importantly, this pullback did not break below the previous resistance-turned-support around $150, confirming the strength of the Solana breakout.
Failed Resistance Break and Loss of Momentum
In the hours following 13:30 UTC, Solana price regained momentum and made a second push that reached the key resistance area near $154 around 16:00 UTC. However, the SOL price failed to sustain above this resistance level, showing clear rejection with long upper wicks and declining candle body sizes. RSI turned back from overbought and started declining, while MACD flashed a death cross shortly after, indicating slowing bullish strength. From this failed breakout, Solana declined to $150 by 18:15 UTC. The drop was not sharp but steady, suggesting a fading bullish drive rather than a full reversal, yet signaling a potential transition into range-bound action again.
Following the drop to $150, Solana price entered another prolonged sideways range between $149.50 and $151.80 from around 18:30 UTC onward. This tight path persisted for the rest of the day and into the new trading day on May 2. RSI bounced frequently between 40 and 60, avoiding both extremes, showing indecision in the market. MACD fluctuated, producing alternating golden and death crosses that failed to follow through, further confirming the range-bound nature of this phase. The inability to reclaim $152 during repeated attempts hints that sellers are defending that zone while buyers are protecting the $149.50 floor, creating a short-term balance.
Neutral Stalemate Near Support Boundary
In the most recent price action leading into May 2, Solana price continued to hover inside the tight consolidation band, slipping slightly toward the lower end around $149.50. This sideways pattern shows A mild bearish bias with successive lower highs. The MACD printed another death cross near the end of the chart, and RSI has dropped closer to the oversold line, suggesting mild downward pressure. However, no decisive breakdown has occurred. Buyers are stepping in at nearly $149, but upward momentum is lacking. Price remains vulnerable unless bulls reclaim the $151.80–$152 region with volume.
SOL Price Recovery Stalls as Bulls Struggle Below Resistance
Solana’s recovery has stalled after rejection at the $154 resistance level. With momentum turning neutral, the price now hovers near $149.50 support in a sideways phase. A clean Solana breakout above $152 could open doors back toward $154 and higher, but a close below $149 would risk deeper pullbacks toward $147. RSI is leaning slightly bearish near the 40 level, and MACD has shown fresh death crosses, adding short-term caution. The price direction remains uncertain as long as the Solana price stays trapped in this narrow range. Still, pressure may build soon for a decisive move, likely below support if momentum continues fading.
Solana(SOL) Price Analysis of May 6th, 2025
The Solana price action over the last 24 hours shows a shifting market dynamic with alternating periods of decline, consolidation, and recovery. The period opened with a sharp drop in prices, continuing an earlier downward trend. SOL price slipped from around $146.80 and began forming a clear downward channel, breaking beneath $145.50 by 07:25 UTC. By 10:45 UTC, price action hit an intraday low near $143.70, marking an important bounce zone. RSI entered oversold territory at this point, while MACD showed a prior death cross, confirming continued bearish momentum through the early sessions.
Chart 4- SOL/USDT M5 Chart, Analyzed by Alokkp0608, published on May 6th, 2025.

From 10:45 UTC to 15:40 UTC, Solana price entered a sideways consolidation pattern, forming a tight trading range between $143.50 and $145.25. Despite minor intra-range spikes, the price failed to establish directionality during this stretch. RSI hovered around neutral levels with multiple minor bounces off the oversold line, showing indecision. Meanwhile, MACD remained flat, with histogram bars shrinking, suggesting weakening bearish force but no strong bullish reversal. Buyers showed interest at $143.50 multiple times, establishing it as a short-term support level ahead of the next directional move.
Uptrend Recovery Meets Stiff Resistance
Beginning around 15:40 UTC, SOL broke out of the trading range and launched into a steep uptrend channel. Price surged cleanly from $143.50, rising toward a major resistance near $147.55. By 19:00 UTC, the rally met its first rejection just below that resistance, followed by another failed retest at 23:00 UTC. This double rejection around the $147.50 mark highlighted strong selling pressure. RSI briefly entered overbought territory during the climb, signaling an exhausted push, while MACD issued a golden cross mid-rally, confirming temporary bullish strength.
The rejection at $147.55 sent the SOL price into another downward channel starting after 23:00 UTC. The price retraced gradually toward the familiar support of $143.50, finally touching it again by 02:25 UTC. This fall was accompanied by RSI dropping back toward oversold, while MACD registered a fresh death cross around 01:45 UTC. Sellers regained short-term control, and buyers defended the same historical support again. This quick test-and-bounce pattern repeated the earlier cycle, suggesting the market remains in a broad range, squeezed between major resistance and support.
Sideways Drift as Market Awaits New Catalyst
After the early-morning drop, the most recent price action shows Solana price transitioning into a sideways path. From 03:00 UTC to 06:00 UTC, the coin traded quietly between $144.50 and $145.50, with low volatility. MACD signaled a golden cross just before 04:00 UTC, but without any follow-through in price. RSI gradually climbed toward 57 by the end of the period, indicating mild bullish pressure but still far from overbought. This lack of strong directional moves points to a wait-and-see sentiment among traders. Buyers have defended $144 repeatedly, but without reclaiming $146, upside momentum remains capped.
Price Compression Signals SOL Breakout Setup
Solana price continues to bounce between the $143.50 support level and the $147.55 resistance zone, suggesting a consolidation phase with no clear SOL breakout yet. Momentum has cooled significantly in the final stretch of the 24 hours, although short bursts of activity around support and resistance hint at potential volatility ahead. If SOL holds above $144 and can break through $146.20 convincingly, another test of $147.55 becomes likely. RSI’s recent climb suggests building bullish interest, while MACD’s golden cross indicates early reversal potential. A clean break above $147.55 or below $143.50 will likely set the next intense directional wave.
Solana(SOL) Price Analysis of May 8th, 2025
The Solana price action over the last 24 hours shows a bullish start that transitioned into a choppy intraday pullback before rebounding. In the 06:00–09:00 UTC interval, SOL price pushed upward and briefly tapped $148.33 before facing rejection. This early strength began forming a short-lived ascending structure, but the price soon slipped back toward $146 during the next phase. The RSI hit overbought levels around 08:30 UTC before turning down, signaling local exhaustion. MACD also formed a bearish crossover near 09:00 UTC, hinting at the upcoming drop. Momentum briefly paused after the initial burst.

Chart 5- SOL/USDT M5 Chart, Analyzed by Alokkp0608, published on May 8th, 2025.
From 09:00 UTC to 18:00 UTC, Solana entered a corrective phase, dropping to the key support level near $145 by 18:05 UTC. This marked a 3% pullback from the earlier peak. SOL Price action consolidated within a wide trading range during this period. RSI dipped into oversold territory between 15:00–16:00 UTC, coinciding with the price revisiting the lower support region. Meanwhile, MACD printed multiple golden crosses through this stretch, suggesting underlying bullish divergence despite the range-bound price action. This interval appeared more corrective than a structural trend change, hinting that bullish momentum was resetting rather than reversing.
SOL Breakout Lift-Off Clears Resistance
A new upward channel began forming between 18:00 UTC and 03:00 UTC, as Solana built strength steadily from the $145 base. By 00:55 UTC, the price experienced a sharp spike toward $149.60, and bullish volume carried it further. RSI climbed back into overbought territory near 01:00 UTC, while MACD showed clean golden crossovers, validating renewed momentum. The SOL breakout above the $150 resistance came at 03:40 UTC, establishing bullish control and signaling potential for continuation. The sustained upward pressure and SOL breakout from the earlier trading range marked this as a confirmed structural move.
Between 03:00 UTC and 06:00 UTC, Solana price made a new local high at $151.95 before facing profit-taking. The resistance breakout lost steam, and prices retraced slightly back to just above the $150 mark. RSI touched overbought levels for the third time in this cycle, weakening afterward. MACD also printed a death cross near 05:30 UTC, confirming declining momentum. Despite that, the price held above the previous resistance (now support), signaling that the breakout level is being respected. Consolidation near this zone suggested that bulls were defending their gains without major distribution pressure.
Post-Breakout Sideways Drift Near $150
Following the rejection near $151.95, SOL price entered a sideways path while hovering above the $150 mark. Price behavior in the final stretch leading up to 06:00 UTC remained tight, showing neither aggressive buying nor significant selling. This zone between $150 and $151 acted as a neutral consolidation band. While RSI stabilized near 49, signaling market indecision, MACD showed a mild bearish crossover, indicating potential for a minor pullback unless renewed buying resumes. Price compression near recent highs, without significant breakdown, suggests bulls are still present but awaiting a fresh catalyst for direction.
Consolidation Near Highs Keeps Bulls in Play
Solana price is consolidating near the $150–$151 zone after a sharp breakout and strong bullish push, suggesting the uptrend remains intact but is temporarily cooling off. The price is likely to retest the $151.95 high if bullish momentum resumes, with extended resistance lying near $153. Immediate support rests at $150, and stronger support sits around $148. RSI is neutral after repeated overbought spikes, while MACD’s recent death cross warns of short-term loss in momentum. Still, holding above former resistance shows strength. If bulls reclaim directional control, SOL could push toward $153–$154 in the next sessions
Solana (SOL) Price Analysis of May 12th, 2025
The Solana price action over the last 24 hours shows an initial bearish drift followed by phases of sideways consolidation and eventual bullish recovery. From early morning, the SOL price declined in a short downtrend channel, dropping from near $175.50 to $172.34 by around 07:40 UTC. This marked the day’s first meaningful support test. A slight rebound followed, but price action stayed mostly in a narrow sideways path with lower highs and higher lows, capped below $174. Indicators during this stretch remained mixed, with RSI briefly dipping into oversold territory and MACD triggering a death cross around 08:00 UTC, suggesting continued bearish pressure.
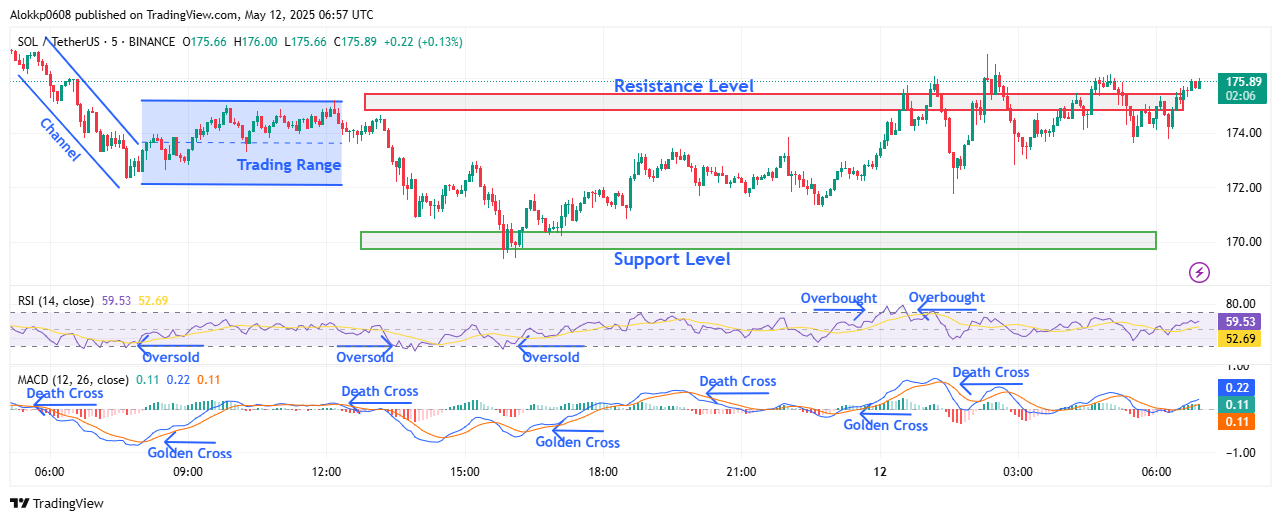
Chart 6- SOL/USDT M5 Chart, Analyzed by Alokkp0608, published on May 12th, 2025.
Between 09:00 UTC and 15:00 UTC, Solana price fluctuated within this sideways structure, but momentum weakened further into a second brief downtrend. The price sank to test the $170 support level by 15:50 UTC. This level marked a significant reversal point. RSI touched another oversold zone during this move, while MACD sustained its bearish crossover for most of this stretch, reinforcing the downward pressure. However, no major breakdown followed, which hinted at support strength. The bulls then stepped in with a moderate push, initiating a short-term uptrend that held through the late afternoon.
Buyers Regain Control After Dip
From 15:00 UTC to 21:00 UTC, SOL price slowly climbed from the support area around $170.20 to retest the $174 region. This upward recovery coincided with a MACD golden cross around 17:00 UTC, showing renewed short-term bullish energy. RSI stayed neutral for most of this period, hovering between the 50–60 zone without breaking into overbought. Price action remained in a steady climb until facing rejection near resistance. A temporary sideways movement formed again just before 21:00 UTC, maintaining stability near $173.70 as buyers gathered momentum.
From 21:00 UTC into the early hours of May 12, the SOL price experienced multiple sharp attempts to break the $175 resistance level. The price approached this cap several times, notably around 00:30 and 05:30 UTC. RSI spiked into overbought territory during these rallies, while MACD saw a golden cross around 00:00 UTC but later faded into a death cross. Despite brief rejections, the price stayed elevated near the resistance area, suggesting buyers were absorbing selling pressure. This setup pointed toward a likely breakout if momentum sustained.
Consolidation Near Resistance After SOL Breakout
In the final stretch between 06:00 UTC and 07:00 UTC, SOL price finally broke above the $175 resistance barrier after hovering tightly below it for hours. The SOL breakout occurred with moderate strength, pushing the price to $175.89. RSI hovered near 60, cooling off slightly from earlier overbought conditions, while MACD flattened after the previous crossover activity, hinting at a possible pause in momentum. The breakout was not yet confirmed by strong volume or continuation candles, but the structure suggests buyers are attempting to flip $175 into a new support base.
SOL Breakout Momentum Faces First Test Near $175
Solana’s price outlook has shifted bullish after defending the $170 support level and breaking through the $175 resistance. Momentum is cautiously optimistic, but confirmation above $176.50 is needed to sustain gains. The RSI cooled slightly from its earlier overbought spikes, while MACD behavior remains mixed after back-to-back golden and death crosses. Short-term support lies at $173.70 and $172.00, with strong demand around $170. If the new support holds, SOL may extend gains toward $178–$180, but failure to hold $175 could bring a retest of lower consolidation zones.
Solana (SOL) Price Analysis of May 14th, 2025
The Solana price action over the last 24 hours shows a strong bullish continuation from the prior day’s dip, with early momentum kicking off around the $171 level. A SOL breakout above this key support occurred near 06:05 UTC, followed by a consistent rally toward the next resistance at $176. Momentum slowed slightly between 11:30 and 14:45 UTC, resulting in a sideways channel just below resistance. The RSI during this leg repeatedly entered the overbought zone, signaling strong buying pressure, while MACD confirmed the uptrend with a golden cross early in the day.
Chart 7- SOL/USDT M5 Chart, Analyzed by Alokkp0608, published on May 14th, 2025.
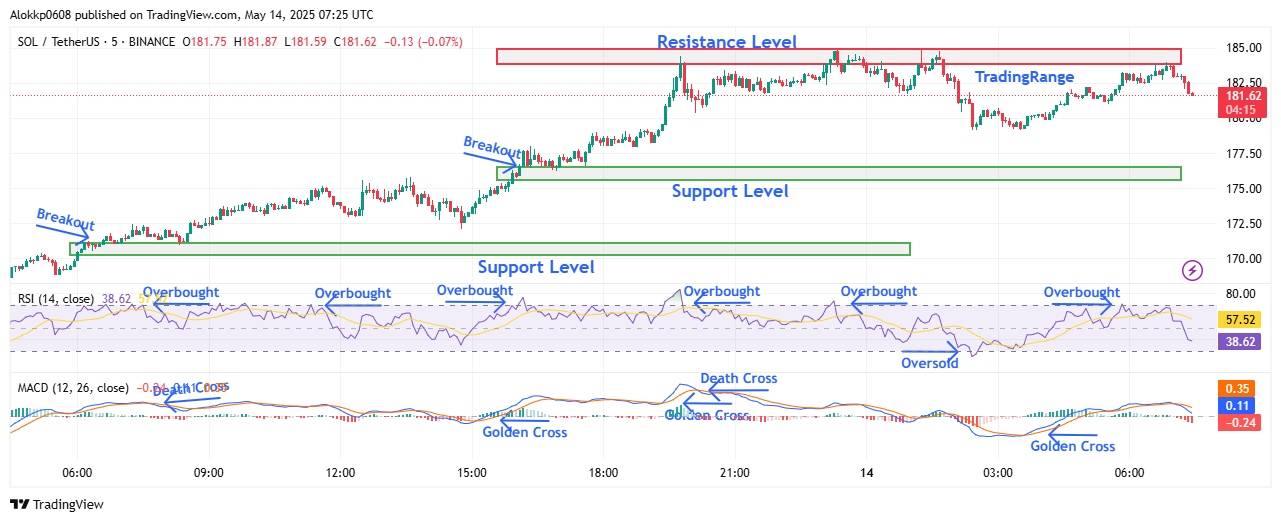
After 15:00 UTC, another SOL breakout took place, breaching the $176 resistance and setting it up as a new support level. This triggered a rapid surge toward the next major resistance at $185. The SOL price hit a high near that level by 19:50 UTC but met strong rejection. Notably, RSI peaked again in the overbought region during this upward push, and the MACD showed a brief death cross followed by a golden cross, reflecting volatility and a bullish bias returning quickly. Buyers held the $176 level convincingly during this stretch.
Stiff Resistance Caps Bullish Attempt
From 21:00 UTC through the early hours of May 14, the Solana price consolidated within a tight range just below the $185 ceiling. Despite multiple attempts, bulls were unable to break above this resistance, leading to a temporary rejection and a downward move starting after 01:30 UTC. Price declined sharply to the $179 zone by 02:25 UTC, breaking the local range lows. During this drop, RSI dipped to oversold levels while MACD showed decreasing momentum, suggesting the bearish leg was corrective, not a reversal.
Following the dip, SOL price rebounded with strength beginning near 02:30 UTC, climbing steadily back toward the $185 resistance. RSI showed a sharp recovery from oversold to near-overbought levels, and MACD crossed bullishly again around 06:00 UTC, supporting the renewed momentum. The price revisited the $185 level by 06:55 UTC but faced another rejection, forming a double top-like structure on the intraday chart. Despite bullish intent, sellers defended the resistance firmly, keeping SOL inside the upper trading range.
Consolidation Near Resistance After Breakout
At the time of writing, the SOL price is trading around $181.60, just below the $185 resistance that has now been tested twice. While buyers continue to dominate the broader trend, short-term momentum appears to be cooling. The RSI has retreated slightly from its earlier highs but remains above 57, indicating moderate bullish sentiment. The MACD remains in positive territory, but its histogram is narrowing, hinting at weakening momentum. Unless bulls reclaim $185 decisively, the price may continue to consolidate between $179 and $185.
SOL Momentum Faces Key Test Below $185
Solana’s bullish momentum remains intact, but it’s facing strong resistance near $185, which has already triggered two rejections. If this level is breached, the SOL price could target $190 next. However, failure to break out may result in another pullback toward the support zone at $176–$179. Momentum remains mildly bullish, supported by the MACD’s recent golden cross and RSI’s steady recovery from oversold levels. Traders should monitor the $185 ceiling closely; a confirmed SOL breakout above could reignite the rally, while another rejection may set the stage for a broader consolidation or short-term dip.
Solana (SOL) Price Analysis of May 19th, 2025
The Solana price action over the last 24 hours shows an early bullish undertone that transitioned into a volatile structure of alternating trend channels. Between 06:00 UTC and 08:05 UTC, the price moved out of a short sideways consolidation and surged to $171.90, signaling strong buyer interest. However, from 08:05 UTC to around 12:05 UTC, the price consolidated again, indicating hesitation before retesting the resistance zone near $175. By 15:45 UTC, SOL had climbed into that resistance level but failed to maintain momentum, leading to a selloff. RSI showed signs of overbought conditions during the peak, reflecting buying exhaustion.
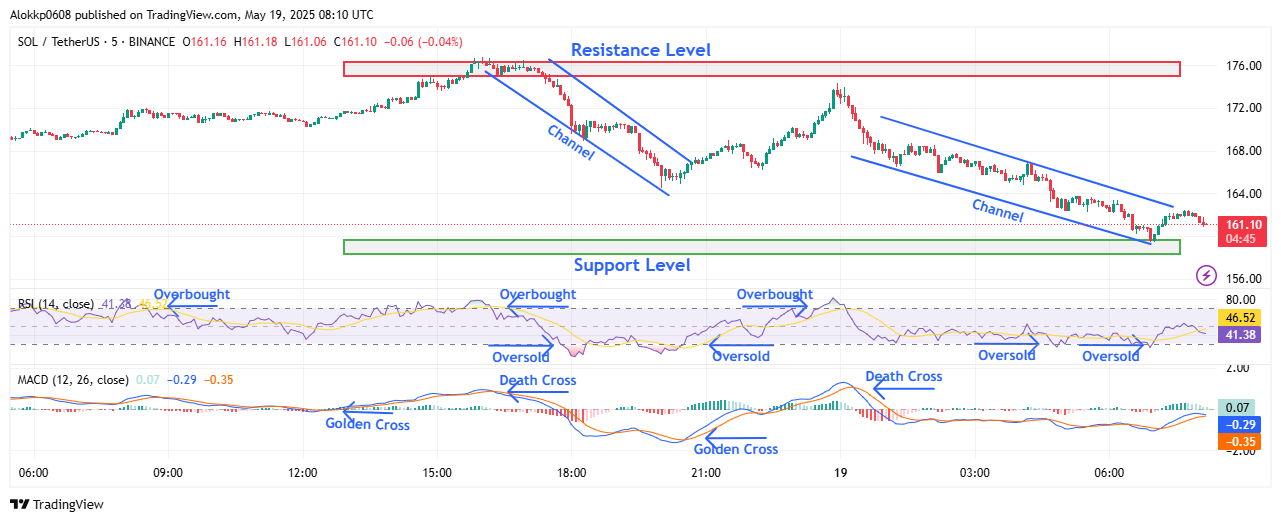
From 15:45 UTC to 20:00 UTC, SOL price entered a descending channel and fell sharply from the resistance zone to $164. This downtrend aligned with an RSI dip into oversold territory and a MACD death cross, signaling bearish momentum. Notably, price briefly stabilized near $164 before reversing. Between 20:00 UTC and 23:55 UTC, buyers stepped in, forming a clean upward channel that brought the price back toward $174.25. MACD confirmed the reversal with a golden cross, and RSI pushed back toward the overbought zone, showing renewed short-term strength.
Buyers Lose Grip After Late SOL Recovery Attempt
Following the rebound to $174.25, the SOL price failed to maintain bullish pressure. From 23:55 UTC onward, the price started trending lower again within a clearly defined descending channel. This downtrend persisted well into May 19, suggesting a lack of sustained buyer follow-through. RSI dipped repeatedly into oversold territory between 01:00 UTC and 07:00 UTC, while MACD triggered another death cross, reinforcing bearish pressure. Soon afterwards, by 07:00 UTC, the price ultimately tested the key SOL support zone at $160, which had held during previous late-April consolidation phases.
The price tested the $160 support, then started a very weak bounce to a high of $162 by 07:40 UTC, not showing volume or strength in the reaction. While this suggested buyers were attempting to defend the support zone, the RSI only slightly recovered from oversold levels and stayed below neutral. The MACD histogram showed signs of bottoming, but no new crossover had formed by the end of the chart. Overall, the recovery attempt appeared tentative and reactive rather than driven by conviction, keeping near-term trend bias tilted to the downside.
Struggling to Reclaim Ground After SOL Support Test
As of the latest chart data around 08:00 UTC, SOL price trades near $161.10, still hovering just above its support level. While holding $160, the coin remains in a short-term bearish channel. The RSI is starting to lift from oversold conditions, but is still muted, and the MACD histogram is shrinking. There may be a chance of a bullish crossover, but only if the price can make a base. A failure to have a decent bounce from support at the $160 area shows sentiment is still weak. Until SOL breaks above $165–$167, upside prospects will remain limited in the near term.
SOL Momentum Faces Key Test Near $165
Solana’s price structure suggests fading momentum after a failed breakout and repeated support test near $160. The short-term outlook remains neutral to bearish unless buyers reclaim $165 with volume. The $160–$158 range remains a critical SOL support zone to monitor. Resistance lies at $167 and more firmly at $174–$175. RSI is recovering from oversold but still below neutral, while MACD shows potential for a crossover but hasn’t confirmed yet. A sustained move above $165 could reset bullish sentiment, but for now, momentum remains constrained and reactive rather than directional.
Solana (SOL) Price Analysis of May 23, 2025
The Solana price action today, from the start of trading to 06:40 UTC, shows an early bullish breakout from the $179.45 support level. Price climbed steadily after 00:15 UTC, establishing higher lows and higher highs (HLs and HHs) in a rising trend channel. The SOL breakout from the initial resistance zone at $181.90 happened by 01:24 UTC. Momentum remained strong, pushing price into a new uptrend structure above a revised support at $182.90. MACD confirmed the move with a golden cross at 00:42 UTC, while RSI briefly entered the overbought zone, reflecting buyer dominance in this early session.

SOL/USDT M-1 Chart, Analyzed by Alokkp0608, published on May 23rd, 2025.
From 01:30 UTC to 03:30 UTC, SOL price maintained a tight uptrend, forming multiple HHs as it advanced toward the new resistance at $185.30. The uptrend was well-supported by continued bullish MACD alignment, but RSI showed signs of slowing momentum after peaking. Price movement stayed above the $182.90 support, confirming it as a short-term floor. A rejection at $185.30 occurred at 02:38 UTC, marked by a MACD death cross and an RSI pullback, signaling potential exhaustion. This began a sideways consolidation phase just below resistance, where buyers struggled to extend gains.
Consolidation Below Resistance, Then Bearish SOL Breakdown
Between 03:30 UTC and 04:30 UTC, SOL price action transitioned into a sideways channel, with repeated attempts to reclaim $185.30 failing. This consolidation phase showed multiple LHs, signaling weakening bullish conviction. At 04:03 UTC, SOL broke down from the $185.25 area, confirming a shift into a downtrend. The move triggered a MACD death cross by 04:05 UTC, and RSI dipped into oversold territory, further validating a bearish shift. Price sliced through the $182.90 support level, which had previously held as a strong base.
From 04:30 UTC to 06:30 UTC, a clear bearish structure unfolded. SOL printed consecutive LLs and LHs while descending toward $180.10. The $182.90 level flipped into resistance. Multiple failed recovery attempts were capped near $182.20–$182.50. RSI entered oversold conditions again around 05:30 UTC, which matched a new leg lower. Despite a golden cross on MACD near 06:25 UTC, price momentum remained muted, suggesting possible bearish continuation or bottoming out near current levels. Volume declined during this phase, showing hesitation from both buyers and sellers.
Rebound Attempt Off Support Zone Around $180.10
In the final minutes leading up to 06:40 UTC, SOL price bounced modestly from a newly formed support zone around $180.00–$180.10. The move coincided with an MACD golden cross at 06:25 UTC, providing some technical encouragement. RSI also rebounded from oversold, now hovering near 54.50. While these signs hint at a potential short-term bottom, the recovery remains unconfirmed as the price still trades well below key resistance at $182.90. Unless price reclaims the previous SOL breakdown level, this rebound may only be corrective. Traders should watch for strength above $182.00 to confirm a momentum reversal.
SOL Holds Key Support But Faces Resistance at $182.90
The Solana price momentum has turned neutral after an early uptrend gave way to a sharp downtrend and a weak rebound. Price now consolidates near $180.95, just above the key support at $180.10. Secondary support sits at $179.45. Resistance levels to monitor are $182.00 and $182.90. For buyers to regain control, SOL must close above $182.90 with supporting volume. MACD’s golden cross at 06:25 UTC could build bullish traction, but only if RSI sustains its rise and price forms higher lows. If support at $180.10 breaks again, bears may push toward the $179.45 level next. Caution warranted below $182.00.
Solana (SOL) Price Analysis of June 11, 2025
The Solana price action today shows early downside momentum that found footing near $163.90 before shifting direction. SOL opened with a sharp dip starting around 00:17 UTC, marked by a MACD death cross and a steady move toward the $163.90 support level, which it hit by 00:42 UTC. This zone held firm despite RSI briefly dipping toward oversold. By 00:46 UTC, a MACD golden cross and a sharp bounce signaled the start of a new uptrend. Prices pushed past $165.45 resistance by 02:08 UTC, setting a higher high and confirming bullish control, albeit briefly.
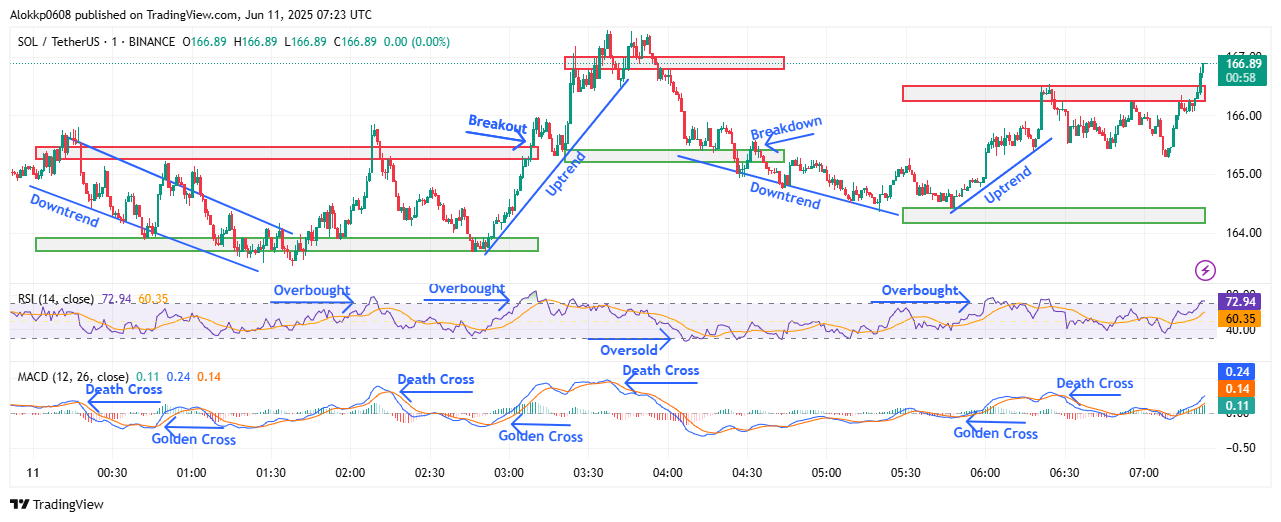
SOL/USDT M-1 Chart, Analyzed by Alokkp0608, published on June 11th, 2025.
That upside run stalled almost immediately, as a new death cross on MACD at 02:16 UTC aligned with rejection at the breakout level. Prices reversed hard, retesting the $163.90 zone again by 02:53 UTC. This bounce was stronger, driven by a new golden cross and a higher low (HL) formation. What followed was a breakout through the prior resistance and entry into a fresh uptrend channel. SOL surged past $165.42 and hit $166.85 by 03:35 UTC, registering a new higher high (HH) before stalling once more. RSI reached overbought territory at the peak, indicating short-term exhaustion.
Consolidation and Pullback Within Tight Ranges
The SOL price rally lost steam after 03:35 UTC as a new MACD death cross and RSI pullback triggered a correction. By 04:37 UTC, prices had broken below the $165.42 support, ending the earlier uptrend and confirming a lower low near $164.40. This breakdown pushed SOL into a downward structure that lasted until around 05:48 UTC. The MACD printed a golden cross at this point, and RSI reversed from neutral levels. These signals supported a new bounce off the $164.40 support, with SOL forming a higher low and beginning a fresh climb toward the $166.25 resistance band.
The uptrend between 05:48 UTC and 07:00 UTC was less aggressive but still structurally valid. SOL prices gradually formed a series of higher lows and higher highs while approaching the $166.25 resistance. However, from 06:21 UTC to 07:18 UTC, the price faced multiple rejections at the $166.25 level. Despite a MACD death cross at 06:29 UTC, the price didn’t break down sharply. RSI hovered near the overbought threshold multiple times, suggesting consistent buyer interest but also a lack of strong follow-through during this time.
SOL Breakout Attempt After Prolonged Resistance Hover
After nearly an hour of hovering just below $166.25, bulls finally gained momentum again. The breakout above $166.25 occurred around 07:21 UTC, breaking past the previous high to reach $166.89. This move capped off a slow but structurally bullish climb. RSI pushed decisively into overbought territory, reflecting intensified buying. MACD began to turn upward, although no fresh cross had occurred by the close of this chart. Importantly, this breakout happened after a clean sequence of higher lows, making the structure more reliable than earlier short-lived rallies.
SOL Reclaims Uptrend Structure With Eyes on $168
Solana’s price current momentum is leaning bullish after a decisive breakout past $166.25 resistance. The short-term projection suggests a potential continuation toward the $168–$169 range, provided $166.25 now acts as strong support. Momentum is constructive, supported by higher lows and a strong breakout structure. The key support levels are $164.40 and $165.42, while resistance now lies near $166.89 and potentially around $168. MACD is turning positive after the most recent death cross, and RSI remains in overbought territory, signaling strength but also the need to watch for short-term fatigue.
Solana (SOL) Price Analysis of June 16th, 2025
The Solana price action today shows a clear directional shift that began with downside pressure. The session opened in a minor downtrend within a range between $151 and $154. A clean breakdown of the $151 support level came by 01:15 UTC, forming a lower low. However, sentiment shifted quickly, a golden cross on the MACD at 01:19 UTC coincided with price flipping into an upward structure. From there, SOL broke above resistance at $154 by 01:38 UTC, entering a strong upward channel. RSI moved into overbought by 01:45 UTC, confirming buying momentum. Price formed both HH and HL within the move.
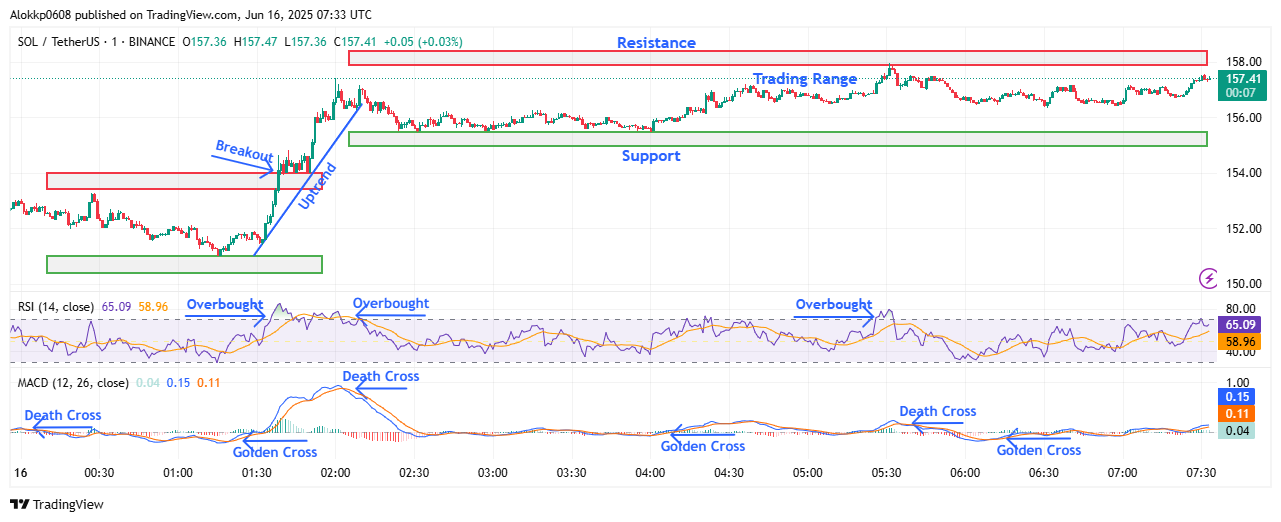
SOL/USDT M-1 Chart, Analyzed by Alokkp0608, published on June 16th, 2025.
From 01:45 UTC to 02:03 UTC, SOL price continued its bullish run, reaching $157.41. That level marked the session high and created a new resistance zone between $157.40–$157.90. A support zone formed between $155.00–$155.45 as the uptrend cooled off. A death cross occurred on the MACD right at 02:03 UTC, signaling weakening momentum. Price began to retrace and hit the new support near $155.45 by 02:31 UTC, forming a higher low relative to earlier consolidation. RSI dropped from overbought but held above the midline, suggesting a pause rather than a reversal. This set the stage for range-bound activity.
From Momentum Cooldown to New Attempted Rally
Between 02:30 UTC and 04:01 UTC, SOL price hovered around the $155.45 support, showing signs of indecision. During this stretch, Price carved out a broad base with several failed attempts to push lower, forming multiple HLs. RSI moved sideways, reflecting balanced buying and selling pressure. At 04:01 UTC, a golden cross on the MACD aligned with a price pickup, sparking a minor rally. Price rose into the $156.80 zone by 05:00 UTC, approaching the upper resistance again. Although volume remained thin, the structure leaned bullish due to persistent higher lows and recovering momentum.
From 05:00 UTC to 05:34 UTC, the SOL price rally faced stiff resistance near $157.90. Despite reaching the upper bound of the established range, SOL couldn’t push through. A rejection occurred at 05:31 UTC, followed quickly by a MACD death cross at 05:34 UTC. This confirmed fading bullish strength. RSI also reversed from the overbought line once more, marking the third rejection near that zone. A lower high was established, which hinted at short-term exhaustion and signaled the beginning of a sideways structure. The price then started to consolidate below resistance.
Rejection at Key Resistance Zone Near $157.90
From 05:34 UTC to the end of the session at 07:32 UTC, SOL entered a consolidation phase within a tight $156.40–$157.90 range. Several small pushes tested resistance but lacked the momentum to break it. Support near $156.40 proved strong, holding up across multiple retests. RSI floated between 58 and 65, signaling limited directional strength. MACD showed minor golden and death crosses during this window but stayed relatively flat, matching the range-bound structure. Price repeatedly made shallow lower highs, suggesting buyer hesitation. Still, the underlying structure remained healthy due to continued defense of the mid-range support.
SOL Facing Stiff Resistance as Momentum Cools Under $158
The Solana price’s recent rally lost steam after facing heavy resistance at $157.90, keeping bulls capped for now. Momentum appears neutral to slightly bullish as long as price stays above the $155.00–$155.45 support zone. However, failure to break above $157.90 could trigger a short-term pullback toward the $154.00–$155.00 area. RSI is hovering just below overbought, reflecting caution rather than conviction. Meanwhile, MACD shows reduced separation, suggesting that momentum is thinning out. A clean breakout above $157.90 is needed to retest higher levels like $159.50. If bulls falter, watch $156.40 as the immediate pivot in the next session’s opening move.


