
Solana (SOL) has become a major high-throughput blockchain because of its rapid transactions and developing DeFi status. The Solana price, being involved in trading with USDT, usually follows the larger market patterns. In this technical analysis, we look at important chart patterns and support/resistance points. And indicators such as RSI and the moving averages to understand the direction that SOL may be headed regarding price. The market has also been known to be very volatile. Hence, learning the patterns of these rallies and falls could assist traders in knowing where to enter the market. How much risk to take and the current trends.
Solana Price Analysis of August 13, 2025
On August 13, 2025, Solana began the day in a range before breaking upward on a golden MACD crossover. Forming an expanding triangle. A downside breakout at 04:10 IST, supported by a death crossover. Failed to sustain, leading to another expanding triangle with resistance at $195. This resistance broke at 08:05 IST, triggering a channel that later broke down at 10:30 IST. Subsequent Solana price action formed a downward expanding triangle, which broke upward at 12:30 IST into another expanding triangle. This final pattern failed to resolve, evolving into a range that marked the day’s high at $202.71, signaling strong but cautious momentum.

Chart 1: SOL/USDT M5 Chart, Analysed by vallijat007, published on TradingView, August 13, 2025
- Solana price formed a range. The range broke out to the upside, supported by a golden crossover of MACD. Pushing Solana price to the upside and forming an expanding triangle pattern.
- The expanding triangle pattern broke out to the downside at 04:10 IST, supported by a death crossover of MACD. But the breakout failed, and Solana price formed another expanding triangle pattern. This pattern created a resistance area at $195.
- The resistance broke out to the upside at 08:05 IST, supported by a golden crossover of MACD. Leading to the formation of a channel. The channel broke out to the downside at 10:30 IST, supported by a death crossover of MACD. Formed a downward-moving expanding triangle pattern.
- The expanding triangle pattern broke out to the upside at 12:30 IST, supported by a golden crossover of MACD. Formed another expanding triangle pattern. This pattern failed to break out to either side and formed a range. This marked the high for the day at $202.71.
Solana ETF Progress and Market Dynamics Show Bullish Momentum
The possible approval of Solana’s ETF is also highly demanded recently, since seven lead asset managers, namely Fidelity, VanEck, and Grayscale, submitted amended ETF-S-1 forms of Solana ETFs to the SEC because the company asked for final revisions to the filings until mid-August. This procedural development suggests that a green light may soon come through, and this time, it may be a game-changer as far as institutional investment is concerned regarding Bitcoin ETFs’ massive asset inflows. The proof-of-stake structure improves the regulatory issues of Solana over Ethereum, which creates a certain advantage for this project during the SEC evaluation.
In addition to institutional involvement, active retail activity is demonstrated in altcoins with such indicators as record Google query interest and a significant reduction in Bitcoin Majesty. Solana had recently surpassed Ethereum in its trading volume since it represented a high speculative tendency due to its increased volatility. Nonetheless, despite this spike, Solana is still nowhere near its previous all-time high, meaning that there can be an opportunity to see some price growth on the basis of more speculative turnover.
Technically, the price of Solana had printed a bullish inverse head-and-shoulders formation upon shattering an important downward trendline. RSI and MACD are momentum indicators that confirm that an uptrend exists, with essential support and target levels being defined. Although profit-taking around the $200 level is to be expected in the short term, the ETF development and the strong market dynamics could increase the Solana price, assuming the cryptocurrency can support its prices during volatility associated with regulatory developments.
ETF Hype and Technical Strength Drive Solana’s Setup:
The actions of Solana reflect an increase in bullish sentiment with regard to its possible ETF listing, with institutional giants such as Fidelity and VanEck being ever nearer to the regulatory green pass. This saw Bitcoin ETF-like inflows that could go into Solana, which is boosted by retail interest and increasing altcoin market share. Technically, Solana has violated one of the significant downward trendlines, confirming an inverted head and shoulders pattern with the bullish signals of the RSI indicator and the MACD. Maintaining above $200 support is critical towards continuing the upside risks to higher levels. Although near-term profit taking is a risk, the mixture of ETF momentum, robust technicals, and expanding trading volume should carry Solana to additional gains should regulatory results go well.
Solana Price Analysis of July 15, 2025
Solana price showed notable intraday volatility, beginning with a high of $165.35 before retreating into a downward-moving channel. Despite a brief upside breakout at 00:55 IST, momentum weakened, and the price dropped again, forming a converging triangle. After failed breakout attempts and consecutive RSI drops below 30 at 06:40 and 08:45 IST, Solana hit the low of the day at $158.17. A weak recovery followed, but another range breakdown at 13:05 IST signaled bearish pressure. Technical indicators reflect market indecision, while external factors, including rising institutional backing, point to a possible reversal if momentum returns.
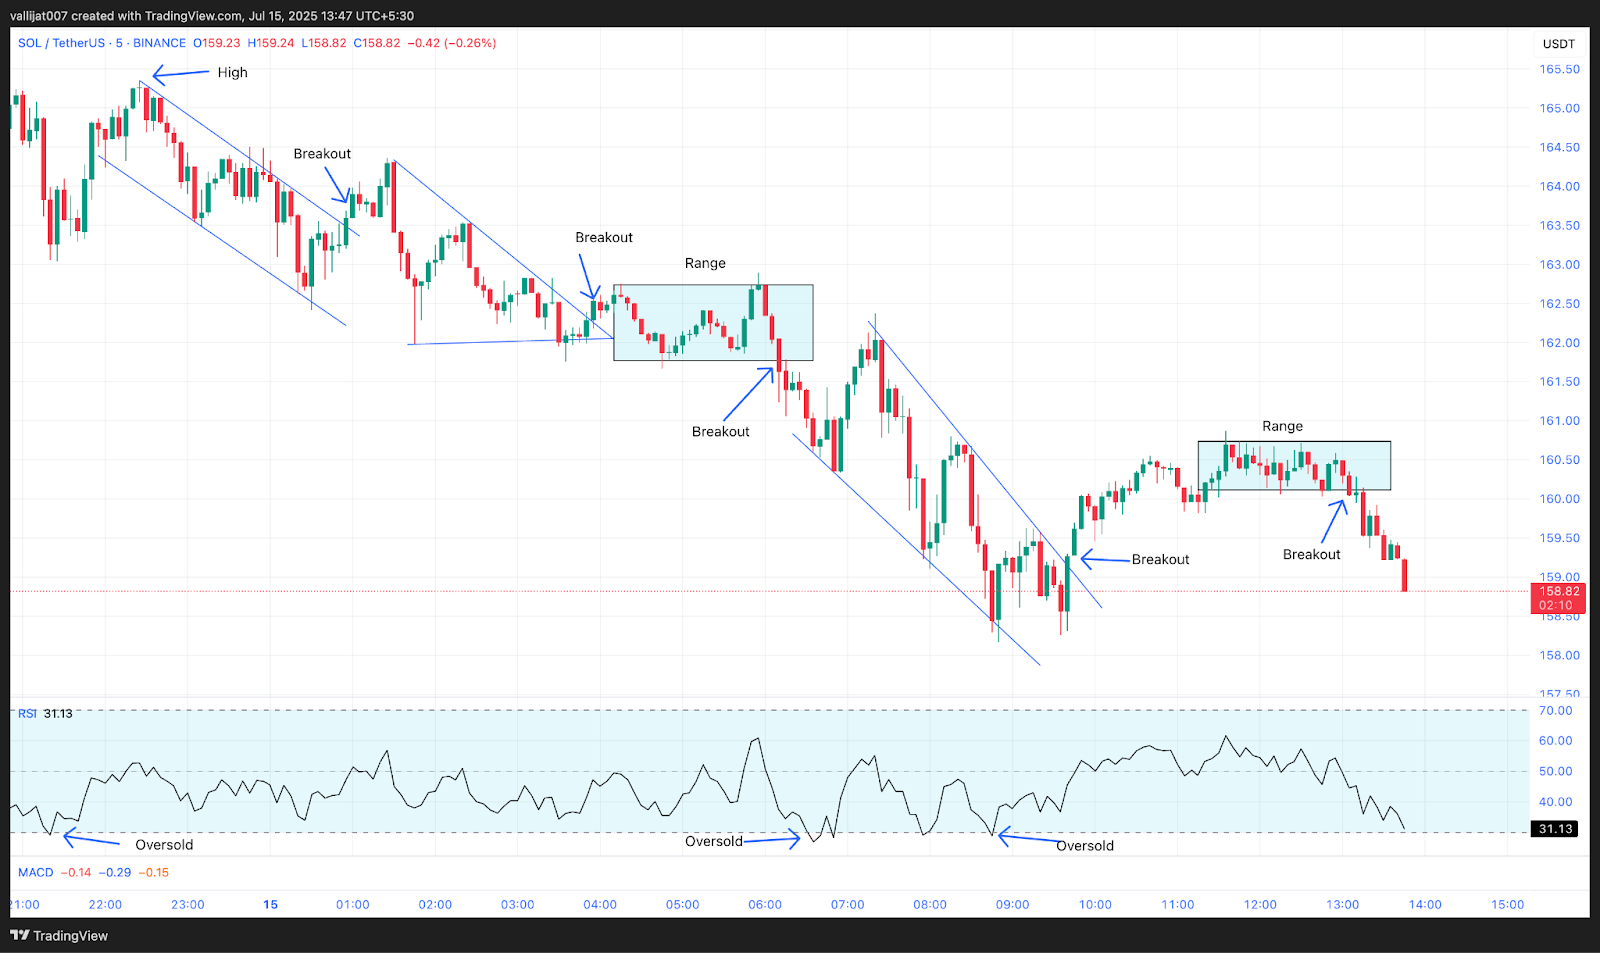
Chart 1: SOL/USDT M5 Chart, Analysed by vallijat007, published on TradingView, July 15, 2025
- The Solana price marked the high for the day at $165.35 and formed a downward-moving channel.
- The channel broke out to the upside at 00:55 IST, but the breakout was weak.
- Price moved to the downside again and formed a converging triangle pattern.
- The converging triangle pattern tried to break out to the upside at 03:55 IST. But the momentum was weak, and the price formed a range.
- The range tried to break out to the downside at 06:10 IST.
- Price spiked to the downside and formed a downward-moving channel, marking the low for the day at $158.17.
- The channel broke out to the upside at 09:40 IST, the price spiked to the upside, and another range developed.
- The range broke out to the downside at 13:05 IST.
Solana Gains Momentum with Corporate Backing and Regional Adoption
Solana (SOL) also remains a favorite among institutions since Upexi invested heavily in the blockchain to the tune of half a billion dollars. This major investment confirms corporate belief in the scalability and sustainability of Solana as a top Layer 1 platform. These investments would also expedite their adoption, growing the demand for SOL as an investment and utility token.
With the growing ecosystem of Solana, the Kenya-based NDT token made its debut on the network, which is another push towards the promotion of blockchain in a developing country. This gesture may bolster the presence of Solana on the African continent so that localized financial solutions can be provided and more real-world application takes place.
This bullish mood is projected in the market; the Solana price was up 2.63% during the past 24 hours to $160, whereas the trading volume increased 57.63% to $5.83 billion. The increased trading volume indicates more confidence among investors in terms of major positive changes developed.
Supported by the institution, regionally adopted, and with a robust price momentum, Solana is doubling down on its claim to being a high-tier blockchain. The further use of high-speed and low-cost infrastructure by more enterprises and countries may cause the SOL to grow continuously in terms of utility and market value.
Institutional Interest and Global Adoption Fuel Solana’s Long-Term Trajectory
Along with a positive uptrend in profitability and well-developed institutional backing, Solana price is seeing significant growth on the basis of code-related technical weaknesses in the short term, as well as price instability. The $200 million policy of Upexi in Solana reaffirms the belief in the company’s infrastructure, and the introduction of the NDT token in Kenya demonstrates its increasing importance in developing economies. There was a 57.63 percent increase in the volume of trade in the last 24 hours, and that reflected an interest by investors. The basic strength of Solana is constantly increasing as more regions and more businesses are joining its scalable and efficient network.


