

If you want to invest in or buy the Starknet token and wonder what the right price to start accumulating Starknet is, then you are in the right place. As we go through the analysis, we will determine different patterns and how Starknet reacts to them. We will also see support and resistance, which is a good area for any instrument to buy or sell. Without any further delay, let’s dive into Starknet price analysis and explore different opportunities arising from it.
Starknet Price Analysis of May 10, 2025
Starknet opened the session with early weakness, marking the low for the day near the $0.1500 zone. Price action then formed an expanding triangle, which broke down sharply but lacked sustained selling. A brief recovery led to a range breakout, but the momentum was short-lived. A downward trendline followed, and another failed upside breakout confirmed reduced bullish interest. Eventually, a converging triangle formed and broke to the downside, only to quickly reverse. Buyers regained control briefly, pushing price up to the day’s high near the $0.1800 level before another sharp reversal capped off a volatile session.

Chart 1: STRK/USDT M5 Chart, Analysed by vallijat007, published on TradingView, May 10, 2025
Starknet price formed an upward-moving expanding triangle pattern and found the low for the day at $0.1531. Often related to growing volatility, this pattern broke out to the downside at 13:55 UTC, reinforced by a death crossover of the MACD. Though the breakout produced a severe downward spike, selling momentum swiftly vanished, and the STRK price stabilised inside a narrow range.
Supported by a golden crossover of the MACD, the range broke to the upside at 17:15 UTC. Price rose briefly on the upside, but the breakout lacked continuation. Instead, a downward-moving trendline started to materialize, mirroring declining bullish momentum. The trendline broke to the upside at 20:50 UTC later in the session, once again supported by a golden crossover of the MACD. This breakout, however, also produced little movement, and no spike followed. Price action, instead, coiled into a converging triangle pattern and set a resistance level at $0.1765.
Bullish Push to $0.1810: High of the Day
The converging triangle broke to the downside at 04:05 UTC, supported by a MACD crossover. However, the downside breakout failed to hold. The Starknet price quickly recovered, and an expanding triangle pattern emerged. This pattern led to a bullish push, marking the high for the day at $0.1810. The expanding triangle eventually broke to the downside at 09:05 UTC on 10 May 2025, supported by a death crossover of the MACD. The market is now at a key inflection point.
Should the downside breakout succeed and be backed by volume and momentum, the price might drop more toward the $0.1600 level, which may serve as a major support zone. But if the breakout fails and purchasers return, Starknet might bounce and reach for the $0.1800 level, close to the high seen earlier in the day.
A string of unsuccessful breakouts demonstrated Starknet’s indecision and temporary volatility. Before taking directional positions, traders should look for confirmation of the breakout. With momentum signals such as MACD and RSI pointing the way on the strength of the breakout, key levels at $0.1600 and $0.1800 will probably determine the following significant movement.
Will Starknet Break the Gridlock?
Starknet’s current price action reflects choppy conditions and failed follow-through on both sides, hinting at growing indecision. The expanding triangle that just broke down may lead to a deeper drop if selling volume increases. In that case, the $0.1600 level could serve as the next critical support zone. However, if buyers defend this level and regain momentum, the STRK price could retest the $0.1800 high. Traders should be cautious of false breakouts and rely on confirmation through MACD and RSI. Until a clear breakout occurs, Starknet is likely to remain trapped in a volatile, range-bound environment.
Starknet (STRK) Price Analysis of May 15, 2025
Starknet has demonstrated persistent bearish pressure throughout the session, with a series of consistent downside breakouts and little sustained recovery. After forming a downward-moving channel and marking the day’s high, the STRK price broke lower, reinforced by repeated death crossovers of the MACD. Despite occasional signs of oversold conditions indicated by the RSI, any attempt at recovery lacked follow-through and was quickly reversed. The price continued to spike lower through multiple ranges and channels, solidifying the downward structure. Breakouts have largely hit their targets, pointing to strong trend behavior, with each failed rebound reinforcing the prevailing bearish sentiment.
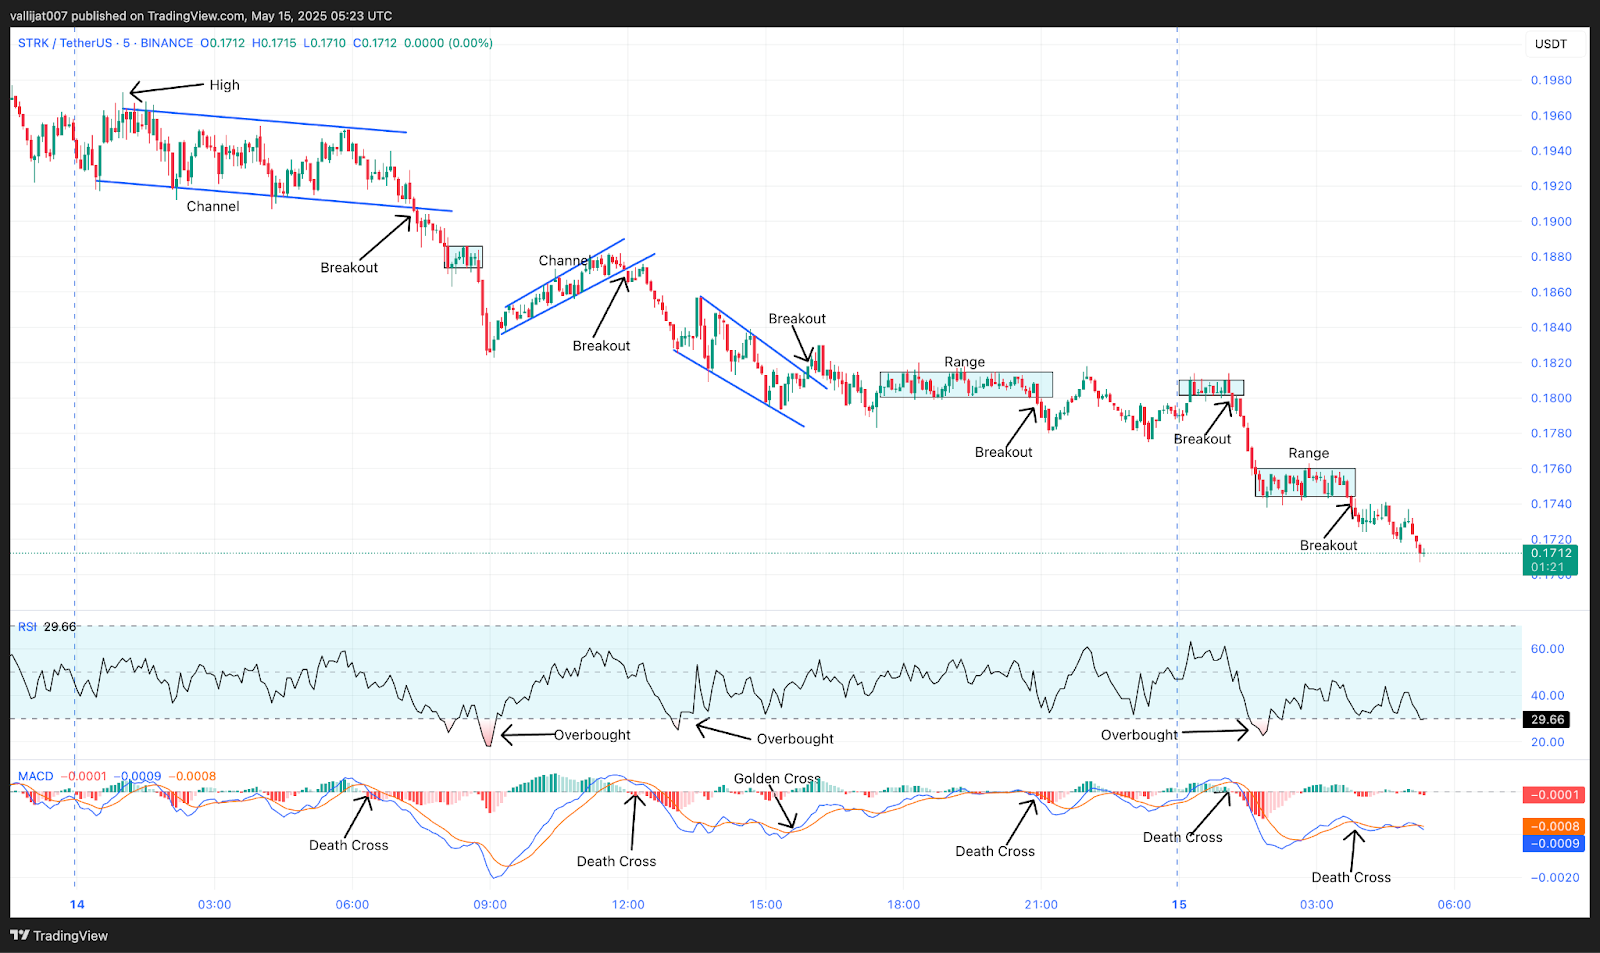
Chart 2: STRK/USDT M5 Chart, Analysed by vallijat007, published on TradingView, May 15, 2025
The Starknet price formed a downward-moving channel, which already marked the high for the day at $0.1973. The downward-moving channel broke out to the downside at 07:20 UTC, supported by a death crossover of MACD. Price spiked to the downside and formed a minor range. The minor range again broke out to the downside at 08:45 UTC, supported by a death crossover of MACD. Price spiked to the downside but failed to form downward momentum, and an upward-moving channel appeared in the price.
Make-or-Break Levels: 0.1600 Target vs. 0.2000 Reversal Zone
At 08:55 UTC, RSI dropped below the level of 30, indicating an oversold market condition, suggesting a reversal or at least a pullback. The upward-moving channel broke out to the downside at 12:00 UTC, supported by a death crossover of MACD. Price spiked to the downside and formed a downward-moving channel. At 13:05 UTC, RSI again dropped below the level of 30, indicating an oversold market condition, suggesting a reversal or at least a pullback. The downward-moving channel broke out to the upside at 15:55 UTC, supported by a golden crossover of MACD, but the upside Starknet breakout soon failed and reversed.
Price formed a narrow range with a resistance area at $0.1815 and a support area at $0.1800. The range broke out to the downside at 20:55 UTC, supported by a death crossover of MACD. Starknet price spiked to the downside but failed to form a downward trend. Price again rebounded to the level of $0.1815. Another minor range appeared in the Starknet price, which again broke out to the downside at 01:10 UTC on 15th May 2025, supported by a death crossover of MACD. Price spiked to the downside and formed another range.
At 01:40 UTC, RSI again dropped below the level of 30, indicating an oversold market condition, suggesting a reversal or at least a pullback. The range again broke out to the downside at 03:45 UTC, supported by a death crossover of MACD. If the breakout succeeds, then the Starknet price may drop to the level of $0.1600, and if it fails, then the price may rise to the level of $0.2000. Price shows strong downward momentum, and there is a high chance that the STRK price may drop further before any rebound happens.
Starknet Slips, Bearish Trend Still Dominant
Starknet price remains in a firm downtrend, with multiple downside breakouts confirming strong selling momentum. RSI has consistently signaled oversold conditions, but recovery efforts have been weak and short-lived. Starknet breakouts from each range and channel have generally succeeded in driving prices lower, reflecting high conviction from sellers. The current setup suggests a potential continuation of this trend unless a clear reversal signal, supported by volume and momentum indicators, emerges. Traders should remain cautious and avoid premature long positions. If the latest breakdown holds, further declines remain likely before any meaningful rebound or consolidation phase develops.


