

Stellar coin showed a mixed session, fluctuating between key support and resistance levels without sustaining a trend. The price broke down after marking a high near $0.294, but no clear downward channel developed. Instead, a converging triangle formed and eventually broke lower, reaching a support zone near $0.281. Oversold signals from RSI and a Golden Cross in MACD fueled a short-lived recovery attempt, creating resistance at $0.286. Later in the session, the price spiked upward but failed to hold gains, forming an expanding triangle that broke to the downside. Stellar’s structure reflected classic trading range behavior with volatile swings. Let’s look at Stellar’s price analysis to see how it reacted to different patterns.
Stellar Price Analysis for April 28, 2025
After marking the day’s high at $0.294, Stellar formed a range, which broke out to the downside at 01:00 UTC, supported by a Death Cross of MACD. Price spiked to the downside but failed to form a downward-moving channel. Instead, a converging triangle appeared, which broke out to the downside at 03:50 UTC, supported by a Death Cross of MACD. Price dropped to the level of $0.281 and formed a support area there. At 05:10 UTC, RSI dropped below the level of 30, indicating oversold market conditions and suggesting a reversal or at least a pullback in price. At 05:50 UTC, a Golden Cross appeared in the MACD.

Chart 1: Analysed by vallijat007, published on TradingView, April 28, 2025
Both RSI and MACD suggested higher prices. Stellar price moved to the upside and formed a resistance zone at $0.286. A converging triangle appeared in the price of Stellar, which broke out to the upside at 17:50 UTC, supported by a Golden Cross of MACD. Price spiked to the upside and formed an expanding triangle pattern. In the meantime, RSI moved above 70, indicating overbought market conditions and suggesting lower prices. The expanding triangle broke out to the downside at 21:05 UTC, supported by a Death Cross of MACD. Price dropped and marked the low for the day at $0.278.
Will $0.290 Resistance Hold or Break?
Stellar’s previous failed breakout at the support level of $0.281 suggests higher prices, and Stellar tried again but failed to surpass the level of $0.290, which now acts as a psychological level for Stellar’s price. Traders and investors should be cautious around these two critical support and resistance levels of $0.281 and $0.290, respectively. Stellar is currently in a trading range. Before taking a decisive Stellar breakout trade, traders and investors should be cautious about Stellar’s price action.
Stellar Stuck Between Critical Levels
Stellar coin remains trapped between key levels, with $0.281 as strong support and $0.290 as psychological resistance. Failed Stellar breakouts on both sides indicate that traders hesitate to commit to one side without clear momentum. Breaking even above $0.290 could lead to higher moves, while a decline below $0.281 could result in greater selling pressure. Stellar will remain volatile within this range until then. Waiting for breakout confirmation should be prudent for traders who want to enter directional trades. RSI and MACD both indicate a market that is still in search of significant momentum in either direction.
Stellar Price Analysis for April 30, 2025
Stellar experienced mixed price action through a sequence of technical patterns, beginning with an upward-moving channel that marked the high near $0.2851. A Death Cross in MACD triggered a breakdown at 02:00 UTC, followed by a converging triangle that also broke lower. RSI dipped below 30, signaling oversold conditions. A Golden Cross at 13:25 UTC supported an upside Stellar breakout, but Stellar returned to range behavior, oscillating between $0.2800 and $0.2820. Eventually, the support zone broke, leading to the formation of an expanding triangle near session close. Let’s take a look at Stellar price analysis to see what happened on the chart.
Stellar’s Technical Moves with Breakouts and Patterns
An upward-moving channel appeared in the price of Stellar, which marked the high for the day at $0.2851. The upward-moving channel broke out to the downside at 02:00 UTC, supported by a Death Cross of MACD. Price spiked to the downside and formed a converging triangle. The converging triangle again broke out to the downside at 04:35 UTC, supported by a Death Cross of MACD. In the meantime, at 02:45 UTC, RSI dropped below the level of 30, indicating oversold market conditions.

Chart 2: Analysed by vallijat007, published on TradingView, April 30, 2025
Stellar formed a range, which tried to break out to the downside at 08:30 UTC but failed to create a spike. Instead, more trading range behavior appeared in Stellar. A downward-moving channel appeared in the price, which broke out to the upside at 13:25 UTC, supported by a Golden Cross of MACD. Price spiked to the upside and formed a range of $0.2820, with support at $0.2800. Stellar price tried to break below the support area at 17:00 UTC, but the downside Stellar breakout failed, and the price again returned to its trading range between the support and resistance. The support finally broke at 20:10 UTC, supported by a Death Cross, and the price formed an expanding triangle pattern.
Stellar Pulls Back to Support After Short-Lived Rally
In the early hours, a range appeared in Stellar, which broke out to the upside at 02:15 UTC, supported by a Golden Cross of MACD. Stellar price spiked to the upside and formed an upward-moving channel, a conventional pattern for a strong trend. However, the upward-moving channel broke out to the downside at 05:45 UTC, and the XLM price spiked to the downside, marking the low at $0.2751 and creating a support zone at $0.2755. If the support holds, then Stellar may rise to $0.2825. If the support fails, then the XLM price might drop to the level of $0.2700.
Stellar Eyes Key Support at $0.2755
Initially, the Stellar price escaped from its tight price area to the upper side, where an ascending trend channel formed until its downward breakout happened at 05:45 UTC. During this session, the market dropped to reach a new low point at $0.2751 while creating support at $0.2755. Stellar would move to $0.2825 if its current support level remains intact. The reduction of support enables the price to reach a potential new low at $0.2700. Trend data indicates that prices will migrate into a period of market consolidation. Entrance into trades should wait for confirmation when executing near support and resistance levels.
Stellar (XLM) Price Analysis for May 2, 2025
Stellar formed a downward-facing converging triangle pattern, which broke out to the downside at 03:55 UTC, supported by a Death Cross of MACD. XLM price spiked to the downside and formed a small range, marking the day’s low at $0.2700. Price then broke out to the upside from the range at 05:05 UTC, supported by a Golden Cross of MACD, but soon dropped again to $0.2705 and formed another range.
This new range broke out to the upside at 07:05 UTC, also supported by a Golden Cross, showing strong buyer conviction. Price spiked upward and formed another range, which also broke out to the upside at 09:45 UTC, again supported by a Golden Cross of MACD. Stellar price continued higher and formed an expanding triangle pattern. In the meantime, RSI moved above 70, indicating overbought market conditions and suggesting a pullback in the ongoing upward move.

Chart 3: Analysed by vallijat007, published on TradingView, May 2, 2025
The expanding triangle marked the high of the day at $0.2805. The pattern broke out to the downside at 13:35 UTC, supported by a Death Cross of MACD, but the downside XLM breakout failed, and the price reversed to the upside. Later in the day, a range appeared, which broke out to the downside at 20:00 UTC, supported by a Death Cross of MACD. However, the price spiked without forming a clear channel. Another range developed, which again broke out to the downside at 23:00 UTC, supported by a Death Cross of MACD.
Trading XLM’s Chop Zone: How to Navigate False Breakouts
The Stellar price spiked lower and formed a small range, which broke out to the upside at 00:20 UTC on 2 March 2025. Price moved upward from this small range, and on a pullback, another range formed, which also broke out to the upside at 02:20 UTC, supported by a Golden Cross of MACD. Price spiked to $0.2795, followed by another pullback and range formation. At 02:55 UTC, RSI moved above 70, again indicating overbought conditions and suggesting a reversal or a pullback.
The latest range broke out to the downside at 04:30 UTC, supported by a Death Cross of MACD. If the downside XLM breakout succeeds, the XLM price may drop to $0.2730. If that support also fails, the price may fall further to $0.2700, where buyers could step in. However, if the downside breakout fails, Stellar could mark a new high above $0.2800 and rise to $0.2900.
Overall, Stellar is moving in a pattern of breakouts followed by quick reversals, reflecting a lack of clear momentum in either direction. Breakouts, both up and down, are struggling to develop into sustained trends. This kind of price behavior suggests a consolidation phase with high intraday volatility. Traders should be cautious of fakeouts and focus on confirmed signals with volume support. To move out of this chop zone, Stellar must break past $0.2805 decisively or drop below $0.2700 with follow-through. Until then, short-term trading setups within the range remain more reliable than directional bets.
Stellar Consolidates with Volatility Near Key Support and Resistance
Stellar price trades in a volatile consolidation phase between support at $0.2700 and resistance near $0.2805. Multiple breakout attempts, both up and down, have struggled to maintain momentum, despite confirmation from MACD signals. Overbought RSI levels have repeatedly triggered pullbacks, while strong buying near support keeps the price afloat. A successful downside breakout could target $0.2730 and $0.2700. Conversely, if bulls regain control and invalidate the latest bearish signal, Stellar may break above $0.2805 and push toward $0.2900. Until then, range-bound movement is likely, with key levels offering critical guidance for short-term trades.
Stellar (XLM) Price Analysis of May 6, 2025
Daily data showed Stellar reached a top of $0.2700 and followed an expanding triangle pattern that predicts high volatility and possible trend changes. At 10:00 UTC, the triangle broke to the downside, supported by a death cross on the MACD, triggering a sharp drop and the formation of a downward-moving channel. At 10:45 UTC, RSI fell below 30, indicating oversold conditions and hinting at a pullback. The pullback occurred within the same channel, which later broke upward at 16:15 UTC on a golden cross of the MACD. Stellar price showed a brief upward movement as it approached the $0.2640 Stellar resistance level.

Chart 4: XLM/USDT M5 Chart, Analysed by vallijat007, published on TradingView, May 6, 2025
Stellar formed an expanding triangle pattern, which marked the high for the day at $0.2700. The expanding triangle broke out to the downside at 10:00 UTC, supported by a death crossover of MACD. Right after breaking through the resistance level, the Stellar price drops, creating a downward channel, which often reveals extended bearish market forces. In the meantime, at 10:45 UTC, RSI dropped below the 30 level, indicating oversold market conditions. The market position implied both a potential market turning point and a short-lived dip. The pullback manifested within the same downward-moving channel.
XLM’s Bullish Breakout Stalls at $0.2640 — Can Bulls Push Higher?
Eventually, the channel broke out to the upside at 16:15 UTC, supported by a golden crossover of MACD, signaling bullish momentum. XLM price experienced an upward surge until it hit a resistance point at $0.2640. A new resistance zone emerged for traders between $0.2600 and $0.2640. Selling pressure tends to accumulate within these price areas. The area around $0.2550 established itself as a crucial support zone accessible to traders regarding potential market moves downward.
At 08:15 UTC on 6th May 2025, the Stellar price attempted to break the $0.2550 support to establish a new trend. Price rejection occurred following the downside breakout attempt, which resulted in a low daily close of $0.2543. The next significant market shift will depend on RSI and MACD detecting momentum shifts. Two levels of Stellar resistance stand between price ascension: $0.2600, followed by $0.2650.
A substantial breakout of these levels might generate signals to rechallenge the $0.2700 peak. The XLM price breaking below the $0.2550 support level with strong downward momentum will lead towards the $0.2500 levels. Stellar traded inside a well-defined range, yet risk indicators demonstrate neutral market signals. The price movement analysis based on RSI and MACD data will provide essential information about upcoming significant price changes. Breakouts that surpass support or resistance with strong momentum signal the upcoming trend direction to traders.
Stellar’s Pivotal Moment: Can Bulls Push Past $0.2650 Resistance?
Stellar price maintains a restricted trading area between the $0.2550 support level and two resistance points at $0.2600 and $0.2650. When the price tried but failed to drop beneath $0.2550 support, it reached a low at $0.2543, indicating buying pressure in the area. A successful price recovery beyond $0.2600, followed by a breakthrough of $0.2650, could lead to a potential reexamination of the $0.2700 high. A definitive price descent below $0.2550 would trigger a movement toward the $0.2500 zone. Mixed trading signals from RSI and MACD require traders to hold off on making directional trades until a clear price breakout occurs.
Stellar (XLM) Price Analysis of May 19, 2025
Stellar’s price action throughout the session was dominated by short-lived trends and erratic breakouts, resulting in a choppy, range-bound market environment. The day started with a failed downside breakout from an upward-moving channel, followed by a brief rally that again reversed. A sequence of alternating channels, ranges, and triangle formations shaped the market, each move confirmed by MACD crossovers and frequent RSI extremes. Despite multiple spikes in both directions, most breakouts lacked follow-through. Even overbought and oversold RSI signals produced only brief responses, underscoring weak market conviction and a lack of sustained directional momentum.
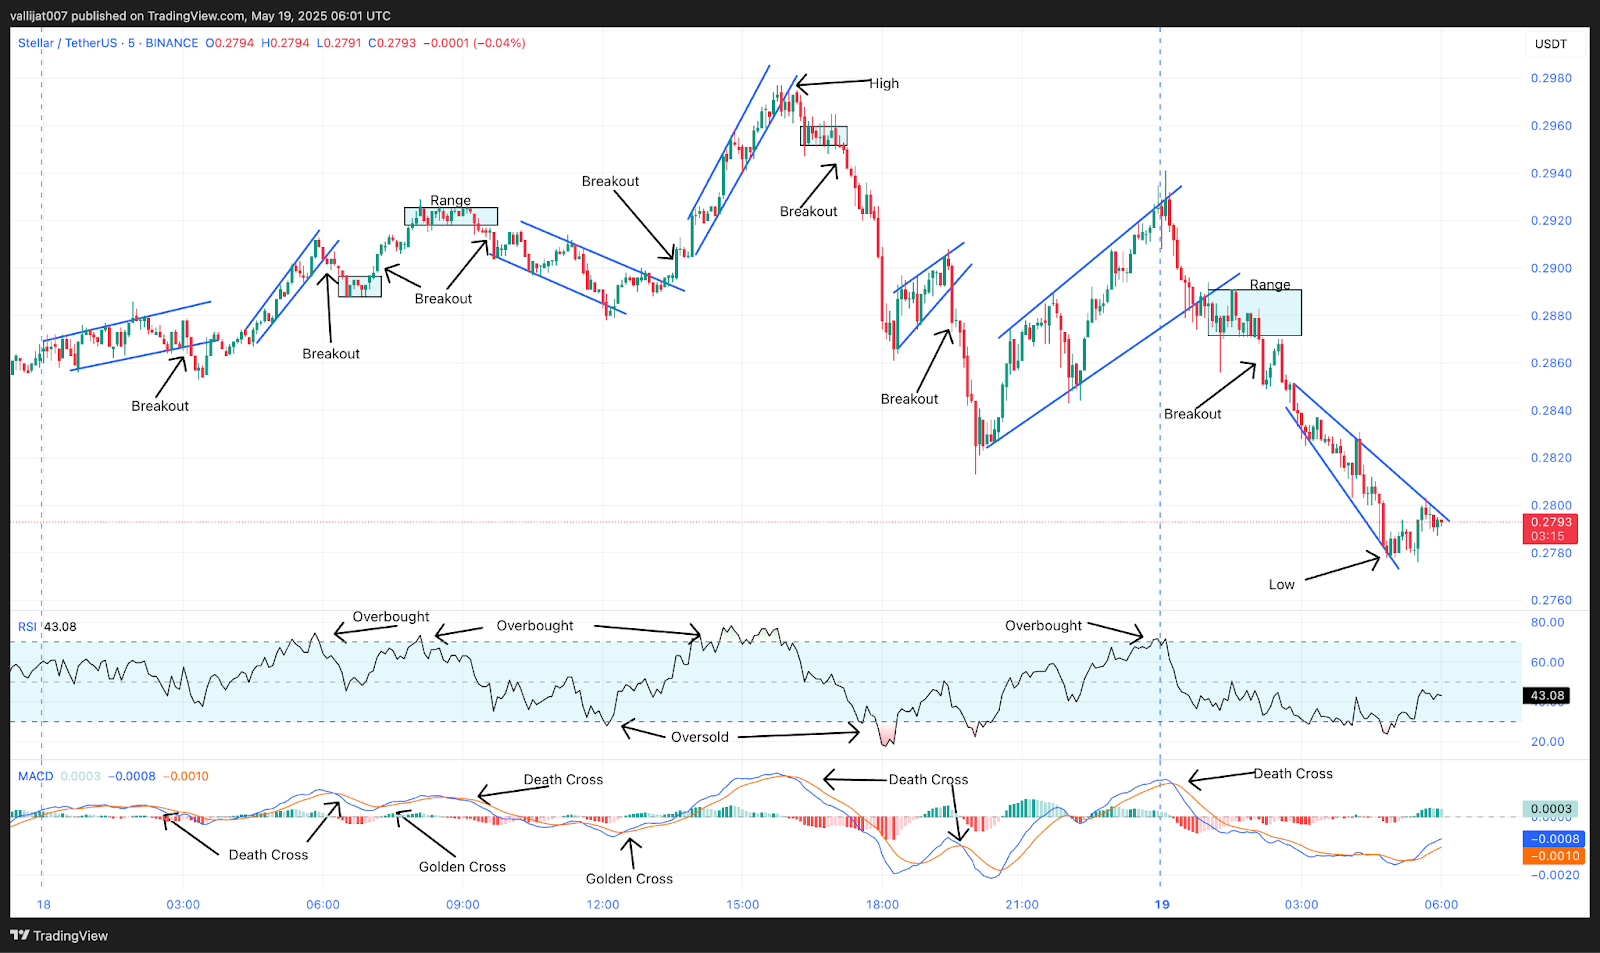
Chart 5: XLM/USDT M5 Chart, Analysed by vallijat007, published on TradingView, May 19, 2025
An upward-moving channel appeared in Stellar price, which broke out to the downside at 03:10 UTC, supported by a death crossover of MACD, but the price failed to form a downward trend. Instead, the price rose to the upside and formed another upward-moving channel. The upward-moving channel again broke out to the downside at 06:05 UTC, supported by a death crossover of MACD. Price spiked to the downside and formed a minor range. The minor range broke out to the upside at 07:10 UTC, supported by a golden crossover of MACD. The Stellar price spiked to the upside and formed another range.
Oversold Bounce at $0.2778, Temporary Relief or Trend Reversal?
In the meantime, at 08:05 UTC, RSI moved above the level of 70, indicating an overbought market condition, suggesting a reversal or at least a pullback. The range broke to the downside at 09:20 UTC, supported by a death crossover of MACD, forming a downward-moving channel. The downward-moving channel broke out to the upside at 13:35 UTC, supported by a golden crossover of MACD. Stellar price spiked to the upside and formed an upward-moving channel. The upward-moving channel marked the high for the day at $0.2977. The channel broke out to the downside at 15:50 UTC, supported by a death crossover of MACD.
Price spiked to the downside and formed a minor range. The minor range again broke out to the downside at 17:10 UTC. Price dropped and formed a converging triangle pattern. In the meantime, at 18:00 UTC, RSI dropped below the level of 30, indicating an oversold market condition, suggesting a reversal or at least a pullback. The converging triangle pattern broke out to the downside at 19:30 UTC, supported by the death crossover of MACD. XLM price spiked to the downside but did not sustain the momentum, and an upward-moving channel appeared in the price.
The upward-moving channel pushed the RSI above the level of 70 at 23:50 UTC, suggesting overbought market conditions. The upward-moving channel broke out to the downside at 00:40 UTC on 19th May 2025, supported by a death crossover of MACD. Price failed to form a spike; instead, a range appeared. The range broke out to the downside at 02:10 UTC, supported by a death crossover of MACD. Price spiked to the downside and formed an expanding triangle pattern, which marked the low at $0.2778.
Stellar Coin Slides as Choppy Patterns Dominate
Stellar coin closed the session with price action marked by failed trends, frequent reversals, and a gradual downward drift. Despite several golden and death crossovers of MACD and repeated RSI overbought/oversold readings, neither bulls nor bears maintained control for long. The final downside breakout from an expanding triangle marked the session’s low, reflecting bearish undertones beneath the surface volatility. Until the Stellar price decisively breaks out from the broader consolidation range with volume and momentum, Stellar is likely to remain unpredictable. Traders should stay alert for false signals and prioritize confirmation before acting, as the current XLM price behavior favors short-term range setups over trend-following strategies.
Stellar (XLM) Price Analysis of May 23, 2025
Stellar price action reflected a highly volatile and technical session, with several clean formations and breakouts driven by MACD and RSI signals. After marking the low for the day at $0.3029, the price established a support zone and began recovering through a converging triangle pattern. A golden MACD crossover signaled the breakout, leading to a series of bullish structures, including ranges and channels, most of which broke to the upside. However, overbought RSI conditions at multiple points triggered pullbacks, and later in the session, price failed to hold higher levels, retreating into a new range below resistance at $0.3060.
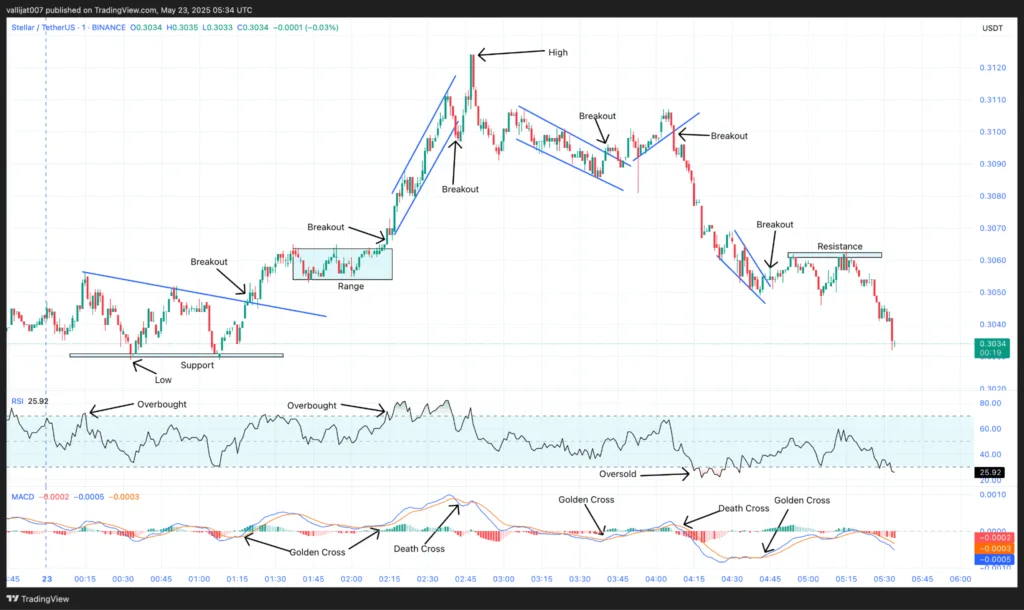
Chart 6: XLM/USDT M1 Chart, Analysed by vallijat007, published on TradingView, May 23, 2025
Stellar coin marked the low for the day at $0.3029 and created a support area at the level of $0.3030. A downward-moving trendline also appeared in the Stellar price, transforming the pattern into a converging triangle pattern. The converging triangle pattern broke out to the upside at 01:20 UTC, supported by a golden crossover of MACD. Price spiked to the upside and formed a range. The range broke out to the upside at 02:14 UTC, supported by a golden crossover of MACD. Price spiked to the upside and formed an upward-moving channel.
Weekend Caution: Low Volatility Limits Breakout Potential
At 02:17 UTC, RSI moved above the level of 70, indicating overbought market conditions, suggesting a reversal or at least a pullback. The upward-moving channel broke out to the downside at 02:41 UTC, supported by a death crossover of MACD, but the downside breakout failed, and the price marked the high for the day at $0.312. After marking the high, the price dropped and formed a downward-moving channel. The downward-moving channel broke out to the upside at 03:41 UTC, supported by a golden crossover of MACD, but failed to form a spike.
Instead, an upward-moving trendline appeared in the XLM price. The trendline broke out to the downside at 04:07 UTC, supported by a death crossover of MACD. Price spiked to the downside and formed a downward-moving channel. In the meantime, at 04:20 UTC, RSI dropped below the level of 30, indicating oversold market conditions, suggesting a reversal or at least a pullback. The downward-moving channel broke out to the upside at 04:45 UTC, supported by a golden crossover of MACD.
Stellar Price spiked to the upside and formed a resistance area at the level of $0.3060. If the price fails to break the resistance area, then the Stellar price may drop to the level of $0.3000. If it breaks to the upside, then the price may rise to the level of $0.3150. Traders and investors should be cautious before placing a breakout trade, as the world market will be closed soon for the weekend, because of which there will be low volatility and momentum needed for the successful breakout.
Stellar Consolidates Below Resistance Ahead of Weekend Lull
Stellar coin has shown signs of short-term bullish momentum, but upside momentum appears to be stalling near the $0.3060 resistance. Repeated golden MACD crossovers supported multiple rallies, yet overbought RSI readings and failed follow-through on upward breakouts suggest the trend may be losing steam. As the weekend approaches and market participation dips, traders should exercise caution; false breakouts are more likely in low-volume environments. A confirmed break above $0.3060 could open the door toward $0.3150, while failure to hold may send the XLM price back toward the $0.3000 support area. Until then, range-bound behavior is likely to persist.
Stellar (XLM) Price Analysis of May 24, 2025
Stellar price began the session with a bounce off the daily low at $0.2840, gradually building upward momentum through a series of bullish structures. The XLM price action was supported by multiple golden MACD crossovers, which helped fuel upside Stellar breakouts from channels and ranges. However, momentum frequently stalled, and overbought RSI readings hinted at short-term exhaustion. Despite intermittent pullbacks, sellers failed to gain lasting control. After holding support at $0.2897 and weathering several false breakdowns, Stellar eventually pushed past resistance at $0.2910, marking the high for the day at $0.2915.
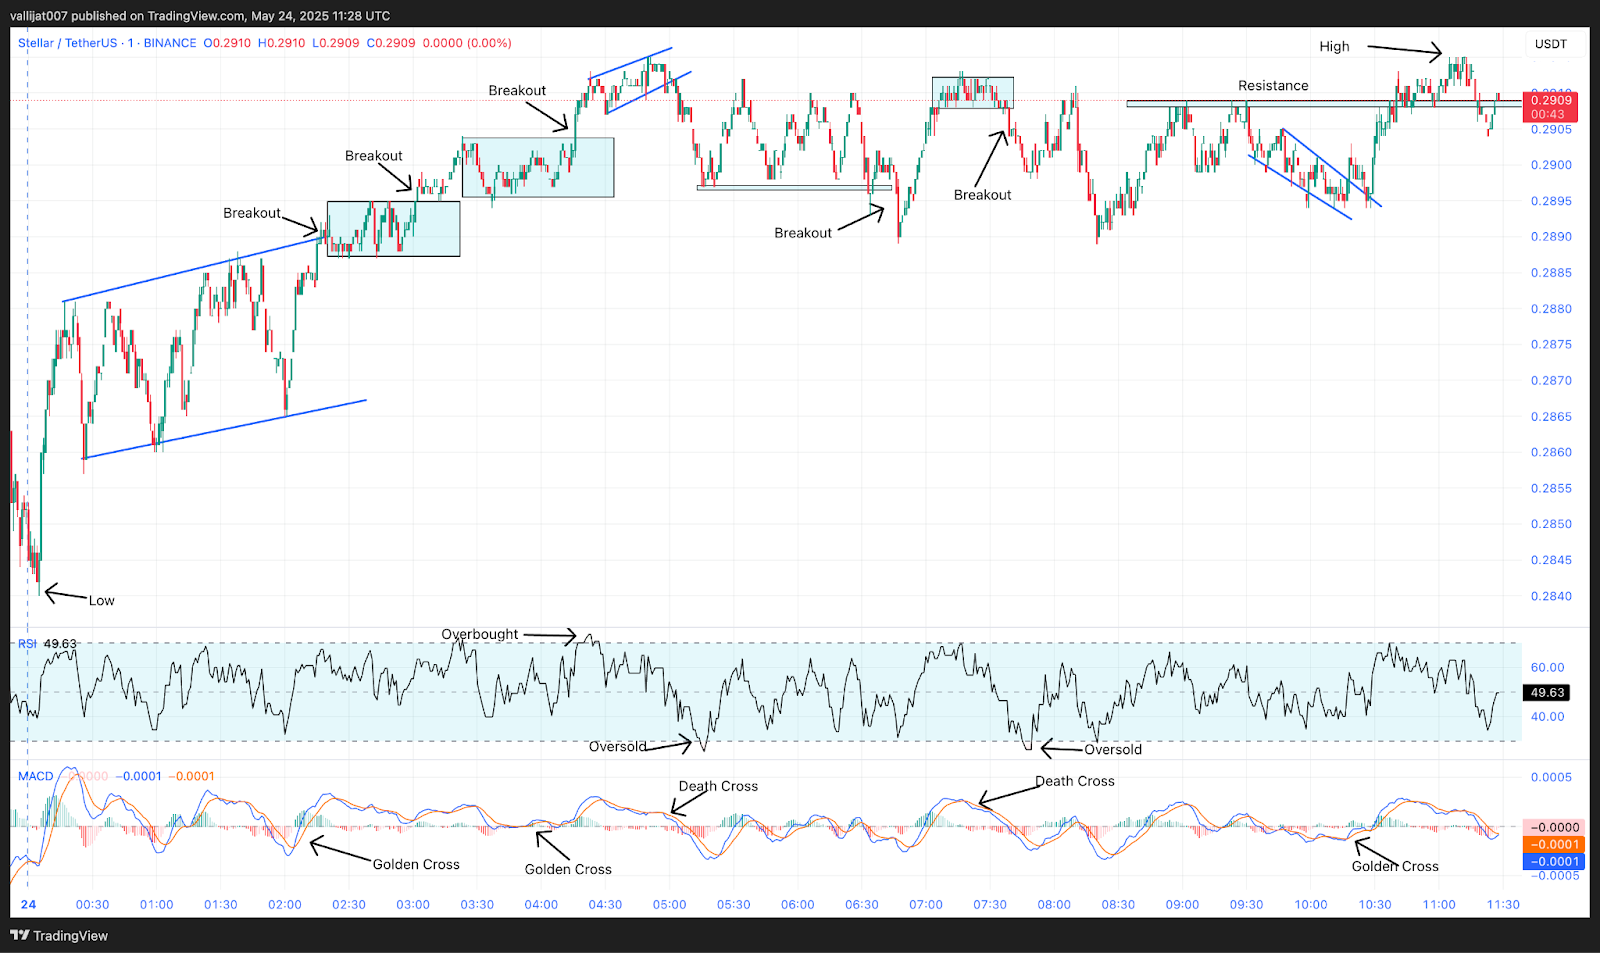
Chart 7: XLM/USDT M1 Chart, Analysed by vallijat007, published on TradingView, May 24, 2025
Stellar marked the low for the day at 0.2840 USD. After marking the low, the price bounced to the upside and formed an upward moving channel. The upward-moving channel broke out to the upside at 02:17 UTC, supported by a gold crossover of MACD, but the price failed to form a spike. Instead, a range was developed.
Channel Breakout Sets Up $0.3000 Target
The range broke out to the upside at 03:02 UTC, supported by a gold crossover of MACD. Stellar price spiked to the upside and formed another range. In the meantime, at 03:20 UTC, RSI moved above the level of 70, indicating overbought market conditions, suggesting at least a pullback. The second range again broke out to the upside at 04:15 UTC, supported by a gold crossover of MACD. XLM price spiked to the upside and formed an upward-moving channel. The upward-moving channel broke out to the downside at 04:58 UTC, supported by a death crossover of MACD. Price moved to the downside and formed a support area at 0.2897 USD.
In the meantime, at 05:15 UTC, RSI dropped below the level of 30, indicating oversold market conditions, suggesting at least a pullback. The range broke out to the downside at 06:47 UTC, supported by a death crossover of MACD, but the downside Stellar breakout soon failed, and the price rose to the upside and formed another range. The range broke out to the downside at 07:39 UTC, supported by a death crossover of MACD. Stellar price spiked to the downside but failed to form a downward channel.
Instead, price rose to the upside and formed a resistance area at 0.2910 USD. Price failed to break the resistance and formed a downward moving channel. That downward-moving channel broke out to the upside at 10:18 UTC, supported by a gold crossover of MACD. Price spiked to the upside, breaking the resistance and marking the high for the day at 0.2915 USD. If the breakout succeeds, then the price may rise to the level of 0.3000 USD. If the breakout fails, then the Stellar price may drop to the level of 0.2800 USD.
Stellar Eyes Breakout Continuation Amid Choppy Moves
Stellar price displayed a bullish structure throughout the session but struggled with consistency in momentum. Most upward breakouts were modest, while downside moves repeatedly failed to develop into trends. The breakout above $0.2910 resistance, supported by a golden MACD crossover, sets a bullish tone going forward. If the breakout sustains, Stellar could target the $0.3000 level. However, failure to hold above recent highs may bring a retest of the $0.2800 area. With RSI signals frequently flashing extremes, traders should remain cautious and wait for confirmation before acting on directional trades. Momentum remains fragile, but bullish bias persists for now.
Stellar (XLM) Price Analysis May 30, 2025
Stellar coin began the session with a burst of bullish momentum, breaking out of a consolidation range and forming an expanding triangle. Bullish MACD signals supported the upward movement, while RSI crossed into overbought territory, hinting at a potential pullback. Despite this, the Stellar price continued to climb, establishing an upward-moving channel before marking its daily peak. As the rally lost strength, a downside breakout occurred, though it failed to produce a clear trend, leading to further range-bound activity. Continued pressure eventually pushed the Stellar price lower, triggering a sequence of bearish patterns and MACD death crossovers. Oversold RSI readings hinted at recovery potential.
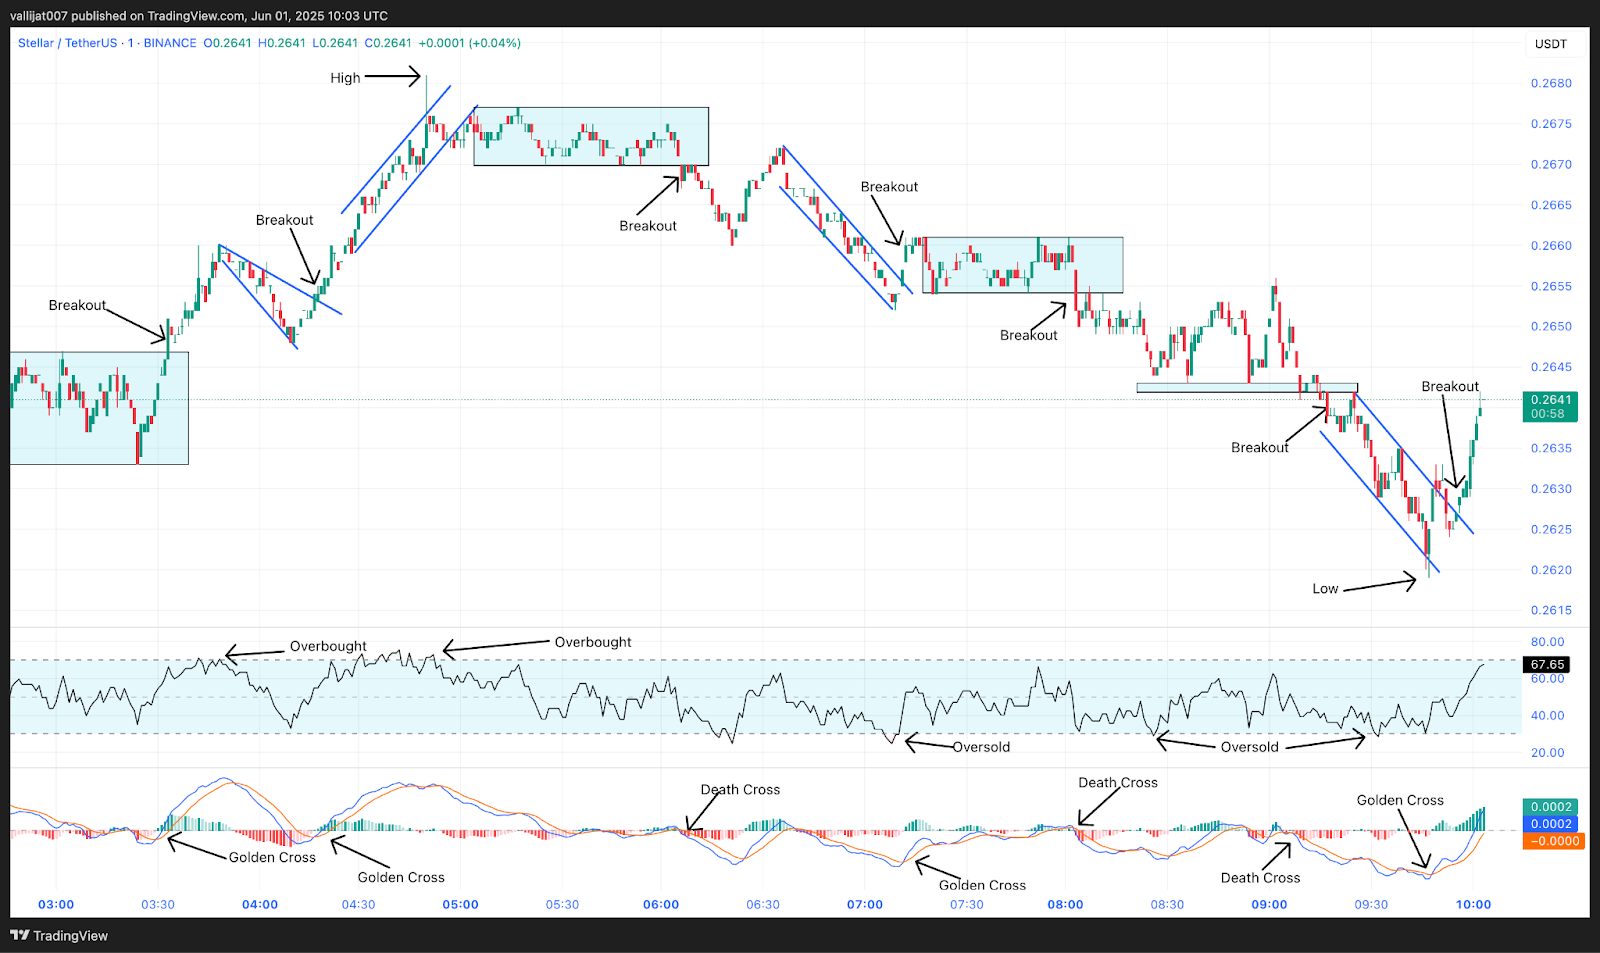
Chart 8: XLM/USDT M1 Chart, Analysed by vallijat007, published on TradingView, June 1, 2025
Stellar price formed a range, which broke out to the upside at 03:33 UTC, supported by a golden crossover of MACD, and formed an expanding triangle pattern. In the meantime, at 03:45 UTC, RSI moved above the level of 70, indicating overbought market conditions, suggesting a reversal or at least a pullback. The expanding triangle pattern broke out to the upside at 04:17 UTC, supported by a golden crossover of MACD, and formed an upward-moving channel.
Overbought RSI Rejects Rally at $0.2681 High
At 04:50 UTC, RSI again moved above 70, reinforcing overbought conditions. The upward-moving channel marked the high for the day at $0.2681. The upward-moving channel broke out to the downside at 04:58 UTC, supported by a death crossover of MACD, but failed to form a downtrend, and instead a range developed. The range broke out to the downside at 06:05 UTC, supported by a death crossover of MACD, and formed a downward-moving channel.
At 07:07 UTC, meanwhile, RSI fell beneath the 30 threshold, pointing to oversold market conditions and suggesting a reversal or at least a pullback. Supported by a MACD golden crossover, the down-moving channel broke out to the upside at 07:11 UTC to create a range. The range broke out to the downside at 08:04 UTC, supported by a death crossover of MACD, and formed a support area at the level of $0.2642.
The support broke to the downside at 09:17 UTC, supported by a death crossover of MACD, and formed a downward-moving channel. The channel marked the low for the day at $0.2620. The downward-moving channel broke out to the upside at 09:56 UTC, supported by a golden crossover of MACD. If the breakout succeeds, the Stellar price may rise to the level of $0.2700. If the breakout fails, the XLM price may drop to the level of $0.2600.
Stellar Coin Momentum Capped by Choppy Conditions
Stellar price action reflected a tug-of-war between short bursts of bullish momentum and persistent bearish pullbacks. Initial gains were capped by overbought RSI readings, while downside moves accelerated with MACD death crossovers. However, follow-through on both ends remained limited, typical of a market struggling to find direction. The late-session recovery shows buyers are still present, but breakout trades remain unreliable. Until the XLM price breaks out of key zones with conviction, traders should treat both bullish and bearish setups with caution in this sideways market.
Stellar (XLM) Price Analysis June 15, 2025
What characterized the Stellar price action on June 15 was a succession of upwards and downwards movements and tight technical patterns. Session saw it begin on a very positive note as the strong force moved channels upwards, touching the day’s high of $0.2610. The latter action in prices was a series of channel and range breakout test, where MACD crossovers and RSI signals were numerous indicators that a reversal was coming. Sellers have been able to curtail the upsurge regardless of numerous bullish pushes that showed the RSI to rise above 70. The low of the day was fixed at 0.2529, marking the intraday volatility, and a challenge of maintaining the direction of the current trend. The price dynamics of Stellar trend pointed at uncertainty and numerous unsuccessful breakouts.
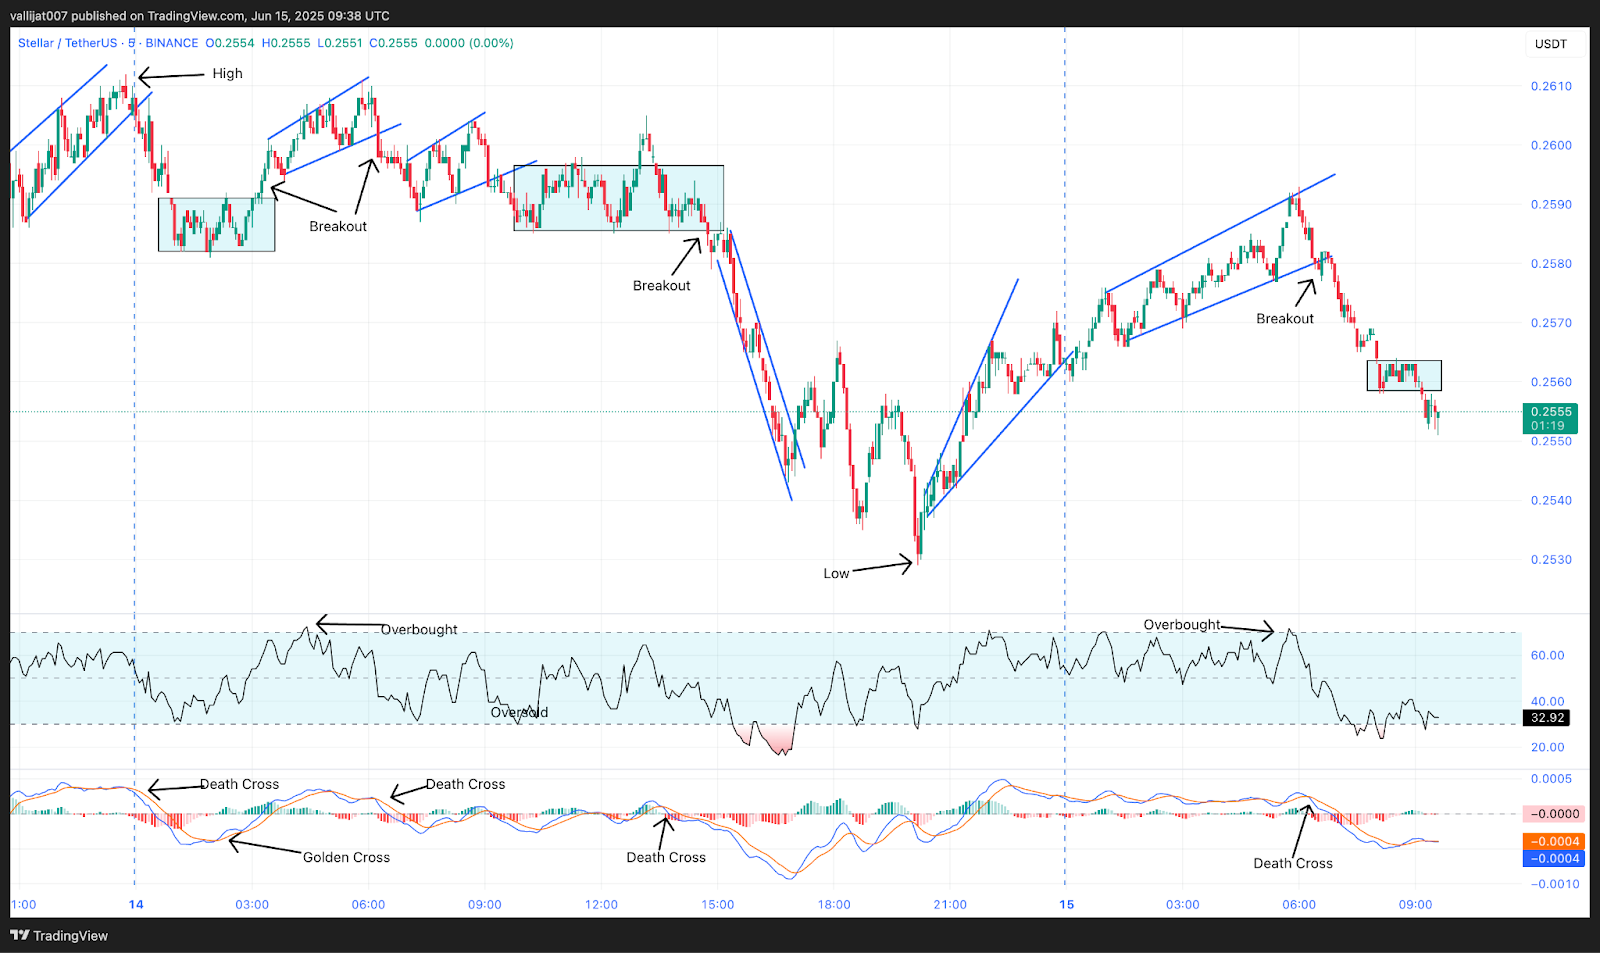
Chart 9: XLM/USDT M5 Chart, Analysed by vallijat007, published on TradingView, June 15, 2025
Stellar price formed an upward-moving channel, which marked the high for the day at $0.2610. The upward-moving channel broke out to the downside at 00:00 UTC, supported by a death crossover of MACD, and formed a range. The range broke out to the upside at 03:15 UTC, supported by a golden crossover of MACD, and formed another upward-moving channel. This upward movement pushed RSI above the level of 70 at 04:25 UTC, suggesting overbought market conditions and a possible reversal or at least a pullback.
Daily Low Established at $0.2529 Following Failed Reversal
The upward-moving channel broke out to the downside at 06:15 UTC, supported by a death crossover of MACD, and formed another upward-moving channel. The second upward-moving channel broke out to the downside at 09:05 UTC, supported by a death crossover of MACD, and formed a range. The range broke out to the downside at 14:45 UTC, supported by a death crossover of MACD, and formed a downward-moving channel. Oversold market conditions at 15:55 UTC suggested at least a pullback as RSI sank under the 30 level.
Supported by a golden MACD crossover, the channel opened to the upside at 17:05 UTC but lost its upward momentum, and XLM price fell to the downside, hitting the day’s low at $0. 2529. Price developed an expanding triangle pattern after the low was marked. Supported by a death crossover of MACD, the growing triangle pattern erupted to the disadvantage at 00:05 UTC on 15th June 2025, but the downside breakout failed and XLM price rose to the upside, therefore creating an upward-moving channel.
RSI reached above the 70 level at 05:50 UTC, pointing to overloaded market circumstances and perhaps a reversal or at least a pullback. Supported by MACD’s death crossover, the upward-moving channel broke out to the downside at 06:25 UTC, hence forming a range. The range broke out to the downside at 09:15 UTC, supported by a death crossover of MACD. If the breakout succeeds, the Stellar price may drop to the level of $0.2500. If the breakout fails, the price may rise to the level of $0.2600.
$0.2610 High to $0.2529 Low: Failed Breakouts Signal Weak Trend Continuation
Stellar price trading behavior revealed a market struggling with commitment in either direction. While price did make attempts to break higher, most upward-moving channels eventually broke down, with RSI readings above 70 leading to immediate reversals. The expanding triangle and repeated range formations offered no clear trend resolution, and even when momentum briefly returned, it failed to carry forward. The Stellar trend bottomed at $0.2529 before another upside attempt failed again. The repeated failure of breakout structures, especially post-RSI extremes, suggests that Stellar remains in a choppy, indecisive phase. Unless price breaks convincingly past support or resistance, sideways consolidation is likely to continue.
Stellar (XLM) Price Analysis July 10, 2025
Reflecting a volatile session marked by both bullish breakouts and overbought signals, Stellar price movement on July 10, 2025, showed. A range formation at the low of $0.2571 started the day, which broke to the upside and started a succession of upward-moving channels. Despite repeated RSI overbought signals and intermittent pullbacks, the Stellar price retained upward momentum. It ultimately reached the daily high at $0.2989 within a sharp rally phase before encountering resistance and retracing. Multiple MACD crossovers fueled breakout attempts, making it a technically active trading day with alternating bullish and bearish formations throughout the session.

Chart 10: XLM/USDT M5 Chart, Analysed by vallijat007, published on TradingView, July 10, 2025
Stellar price formed a range, which marked the low for the day at $0.2571. The range broke out to the upside at 04:05 UTC, supported by a golden crossover of MACD. Price spiked to the upside and formed an upward-moving channel. The upward-moving channel broke out to the downside at 06:30 UTC, supported by a death crossover of MACD, but the momentum was weak, and the price formed a support area at the level of $0.2640. Price then formed another upward-moving channel.
Daily High Reached at $0.2989 Prior to Channel Breakdown
The upward-moving channel broke out to the upside at 10:55 UTC, supported by a golden crossover of MACD. Price spiked to the upside and formed another upward-moving channel. At 11:50 UTC, RSI moved above the level of 70, indicating overbought market conditions, suggesting a reversal or at least a pullback. The moving channel broke out to the downside at 13:30 UTC, supported by a death crossover of MACD, and a range developed. The range broke out to the upside at 15:15 UTC, supported by a golden crossover of MACD. Price spiked to the upside and formed an expanding triangle pattern.
Supported by a MACD death crossover, the expanding triangle pattern broke out to the downside at 16:15 UTC, and a range formed once more. Supported by a death crossover of MACD, the range broke out to the downside at 20:15 UTC, then established a support area at $0.2850. RSI was over 70 at 20:00 UTC on 10th July 2025, which pointed to overbought market conditions and implied a reversal or at least a pullback.
Price formed a moving expanding triangle pattern, which pushed RSI below 30 at 04:05 UTC, indicating oversold market conditions. The expanding triangle pattern broke out to the upside at 05:30 UTC, supported by a golden crossover of MACD. Price spiked to the upside and formed an upward-moving channel. The upward-moving channel marked the high for the day at $0.2989. The channel broke out to the downside at 10:00 UTC, supported by a death crossover of MACD.
Stellar Hits $0.2989 High but Pullback Looms After Overbought Signals
Stellar price ended the day on a strong note by touching $0.2989, but the accompanying overbought RSI readings and a subsequent breakdown from the final upward-moving channel suggest buyer fatigue. After the first spikes, several optimistic breakthroughs showed signs of weakness as their momentum quickly faded. While $0.2989 serves as major resistance, the $0.2850 and $0.2640 levels functioned as temporary backups. Should Stellar maintain above $0.3000, it might try to revisit the high; otherwise, failure to hold above $0.3000 may trigger greater corrections. Traders should carefully watch RSI and MACD indications for indications of a prolonged reversal or continuous bullish momentum.


