

Are you thinking about jumping into SUI but unsure where it’s headed? This analysis breaks down the latest moves to help you decide. After starting April 28th on a weak note, SUI quickly reversed into an uptrend, only to fake out near $3.80 resistance. What looked like a SUI breakout turned into a pullback, and now the price is moving sideways. Let’s dive into the details to see if SUI is gearing up for a bounce or something more profound.
SUI Price Analysis of 29th April, 2025
The SUI price action on a 5-minute chart on April 28th exhibits early recovery from the previous day’s downtrend. After opening with bearish sentiment, SUI reversed around 01:45 UTC, forming a clear ascending channel. This upward momentum held strong into the 09:00 UTC zone, marked by multiple RSI overbought conditions and a gradual rise toward the $3.78–$3.80 resistance level. Bullish MACD crossovers fueled momentum, but volume failed to confirm SUI breakout strength. By 11:05 UTC, the SUI price pierced above resistance in a sharp push, creating a fake breakout that lacked sustained buying.

Chart 1, Analyzed by Alokkp0608, published on April 29th, 2025.
Between 12:00 UTC and 15:00 UTC, the SUI price collapsed from the breakout, sharply reversing into a descending channel. Selling pressure increased, and RSI shifted from neutral to oversold across multiple readings, while MACD turned bearish with multiple death cross signals during this window. Price dipped to a low near the $3.45–$3.46 support level by around 16:30 UTC. This level provided temporary buying interest and a mild bounce attempt, but momentum indicators remained weak. MACD’s bearish divergence stayed intact, and volume didn’t confirm any aggressive reversal in this zone.
Between 18:00 UTC and 00:00 UTC, the SUI token attempted to consolidate and rebound from support. Despite weak upward attempts, it failed to retest the mid-resistance zone of $3.64–$3.66 and remained trapped in a sideways channel. The RSI oscillated around 40–50, showing hesitation, and the MACD showed alternating weak golden and death crosses without strong follow-through. The lack of momentum above $3.60 and repeated failure to reclaim that zone hinted at accumulation or indecision. The SUI Price volatility narrowed, and market participants awaited a directional bias in the next session.
SUI Price Outlook: What Lies Ahead for SUI Token?
Between 00:00 UTC and 06:00 UTC on April 29th, SUI’s sideways price action continued to hold above $3.45 support, showing signs of potential base formation. Another brief RSI dip into oversold was met with small-scale buying, keeping the price range intact. However, multiple MACD death crosses persisted during minor rallies, indicating sellers were still defending upside moves. As long as the $3.45 zone holds, a potential short-term rally toward $3.60 remains viable, but failure to reclaim $3.64 could invalidate upward structure and retest $3.42–$3.40. The current setup favors consolidation unless volume steps in decisively.
Consolidation or Breakdown Ahead?
The SUI token shows signs of hesitation, caught in a tight consolidation range between $3.45 and $3.64. Although it’s holding above the key support at $3.45, bullish momentum remains weak, as shown by persistent MACD death crosses and a subdued RSI that reflects market indecision. Multiple failed attempts to reclaim the $3.60–$3.64 resistance zone suggest sellers are still in control near the top of the range. However, if buyers manage to hold the support level and volume increases, we could see a push toward $3.66–$3.70. Conversely, if $3.45 breaks down, it could open the door to a deeper dip toward $3.40 or even $3.36. SUI appears to be waiting for a catalyst to break this deadlock.
SUI Price Analysis of May 1st, 2025
The SUI price action on a 5-minute chart over the past 24 hours began within a tight sideways consolidation between $3.50 and $3.605, lasting until around 12:00 UTC on April 30. This low-volatility phase reflected market indecision, with volume tapering off and RSI hovering near the midline. As the narrow band failed to break higher, pressure mounted. Post-12:00 UTC, sellers gained control, initiating a steep downward push that pierced intermediate supports and continued until the SUI price touched the key support level at $3.30. MACD also confirmed this downtrend with a clear bearish crossover, signaling intensified momentum to the downside during this leg of the move.

Chart 2, SUI/USDT M-5 Analyzed by Alokkp0608, published on May 1st, 2025.
Following the support test at $3.30, a recovery took shape just before 14:00 UTC. This new uptrend was defined by sharp, frequent intraday swings that tested trader conviction. Although the SUI token began climbing upward, each surge above $3.40 encountered quick rejections or minor pullbacks, limiting strong follow-through. Between 15:00 UTC and 21:00 UTC, bulls attempted to reclaim territory, struggling around the $3.48 to $3.52 zone, while MACD shifted gradually into a golden cross range. RSI also trended upward, but frequently reversed near the overbought region, suggesting momentum lacked stability. Despite the choppy structure, SUI eventually reached $3.54 by 23:10 UTC, marking a modest recovery.
Volatility Returns as Key Levels Approach
On May 1, with the start of the new trading day, SUI price action reverted to a sideways phase between 00:00 UTC and 08:40 UTC, consolidating just under $3.55. This range held firm, with resistance at $3.57 capping each small breakout attempt. During this period, RSI flattened again near 50, and MACD lines drew closer, hinting at an impending shift in momentum. The price continued to coil, forming higher lows across the band, suggesting bullish undertones beneath the calm surface. The tight structure eventually gave way as accumulation pressure built around $3.56, setting the stage for a decisive upward break later in the session.
By 08:45 UTC, the SUI token climbed steadily upward, forming a clean ascending structure. A substantial spike around 10:15 UTC broke above the resistance at $3.620, a key level that previously rejected multiple upside attempts. Volume surged alongside the breakout, confirming buying conviction. MACD sharply widened in the bullish zone, while RSI shot into overbought territory above 70, both signs of strong momentum behind the SUI breakout. The rally extended briefly toward $3.65 before stabilizing, with buyers trying to defend the breakout level as new short-term support. The breakout structure now requires validation through sustained trading above $3.620.
SUI Bulls Eye New Ground Above Resistance
The most recent price action confirms the SUI breakout above $3.620, following hours of coiling action below the level. Buyers now appear intent on building a higher base above this critical resistance turned support, with the SUI token oscillating between $3.63 and $3.65. Volume remains elevated, showing sustained interest post-breakout. However, the rising RSI above 70 indicates potential overextension, while MACD remains in a strong bullish posture without signs of divergence. A minor pullback to retest $3.620 would be constructive for continuation. Traders should watch for consolidation above $3.620 or another bullish impulse targeting the $3.68 to $3.70 zone.
Breakout Confirmation or Bull Trap at $3.620
The SUI breakout over $3.620 shows a significant momentum shift, but now it is time to hold that price. The uptrend is still intact, and MACD continues to signal a strong bullish continuation. Also, the RSI is pushing deep into overbought territory. A healthy consolidation over $3.620 would be required to continue towards $3.70 or higher.. However, failure to maintain this support could trigger a drop back toward $3.55 or even $3.48. Bulls must defend the recent gains to confirm trend strength. Momentum is currently favoring the upside, but overbought RSI signals caution as SUI price approaches the upper bound of this recovery rally.
SUI Price Analysis of May 29, 2025
The SUI price action today exhibits a sharp recovery from early lows, followed by shifts in range and directional changes. Price began near the $3.5670 support zone, forming a strong uptrend by 00:17 UTC after a golden cross on the MACD. It broke through resistance at $3.6088 by 00:48 UTC, reaching a high of $3.6462 by 01:00 UTC. A short-lived rejection led to a dip back to the breakout level around $3.6088 by 01:25 UTC. Despite RSI entering overbought territory briefly, bullish pressure returned later. This early structure created a higher high (HH) while preserving higher lows (HL) support for now.

SUI/USDT M-1 Analyzed by Alokkp0608, published on May 29, 2025.
From 01:30 UTC to 03:00 UTC, the SUI price moved sideways and then initiated another rally. Momentum picked up again at 02:25 UTC with a golden cross on the MACD. A new support zone formed near $3.6292, with resistance tested at $3.6755. Price briefly tagged this level around 02:57 UTC but immediately pulled back, triggering a death cross by 02:58 UTC. RSI again touched overbought before reversing sharply, suggesting exhaustion. The structure flipped from a series of higher highs into a lower high (LH) as price broke support by 04:15 UTC. The breakdown sent the coin into a downtrend with a local low of $3.5620.
SUI Price Rally Rebuilds in Uptrend Channel
Between 04:30 UTC and 06:00 UTC, the Sui token shifted into a new uptrend. The MACD signaled a golden cross at 04:50 UTC, and RSI exited oversold territory, supporting the SUI recovery. Price reclaimed $3.6000, then formed consistent HLs as it trended higher. The short dip around 05:47 UTC toward $3.6088 was quickly absorbed, showing resilience. Support remained stable around $3.6000, while resistance reformed near $3.6600. The uptrend channel held a tight structure with no significant violations, and buyers kept control. A second golden cross around 06:11 UTC confirmed bullish continuation, helping push the price back toward the key resistance zone.
From 06:00 UTC to 07:15 UTC, the SUI price maintained its steady climb within the uptrend channel, gradually approaching the $3.6600 resistance zone. Price tapped the upper range around 07:00 UTC but couldn’t clear it. Multiple tests between 07:00 UTC and 07:15 UTC confirmed this as a strong rejection zone. The RSI again hovered near overbought, which, combined with fading MACD histogram bars, signaled weakening momentum. An LH formed near $3.6600 while the price hovered above short-term support. Failure to breach this resistance marked a potential stalling point. This set the stage for a moderate pullback from recent highs.
Moderate Pullback from Resistance Near $3.66
After 07:15 UTC, the SUI price began a controlled descent, slipping out of its rising structure. The fall from $3.6600 to $3.6393 marked a short-term lower high and a break in bullish rhythm. While no steep crash occurred, the momentum clearly faded. RSI cooled toward neutral, and the MACD began compressing, hinting at a potential cross-over but offering no clear reversal yet. The $3.6292 level could serve as immediate support, with further strength near $3.6000. If price stabilizes here, it may attempt a fresh SUI breakout. But if this weakness persists, SUI risks revisiting lower supports, particularly around the $3.5670 region.
SUI Recovery Faces Headwinds Near Resistance
SUI price currently trades at $3.6393, with momentum slowing after a strong recovery earlier in the session. The immediate structure leans neutral-bullish, though rejection at $3.6600 signals caution. Key support levels are $3.6292 and $3.6000, while resistance remains firm at $3.6600 and $3.6755. The RSI has returned to mid-range levels after repeated overbought touches, and MACD has flattened following two golden crosses during the rally. Unless bullish momentum reignites soon, price may consolidate or pull back further. For now, the uptrend structure remains intact but vulnerable if $3.6000 fails. This analysis covers price action from the start of May 29 to 07:54 UTC.
SUI Price Analysis of June 3rd, 2025
The SUI price action today shows early consolidation between the $3.330 support and $3.350 resistance. Between 00:00 UTC and 01:00 UTC, the price ranged narrowly in this band before breaking out at 01:20 UTC. This breakout marked the start of a sharp climb, with the price forming a series of higher highs (HH) and higher lows (HL) as it approached $3.390. RSI briefly entered overbought territory, confirming strong bullish momentum. Meanwhile, MACD printed a golden cross around 00:09 UTC, reinforcing the upward bias. However, an early death cross at 00:26 UTC hinted at weakening undercurrents before the rally took full form.
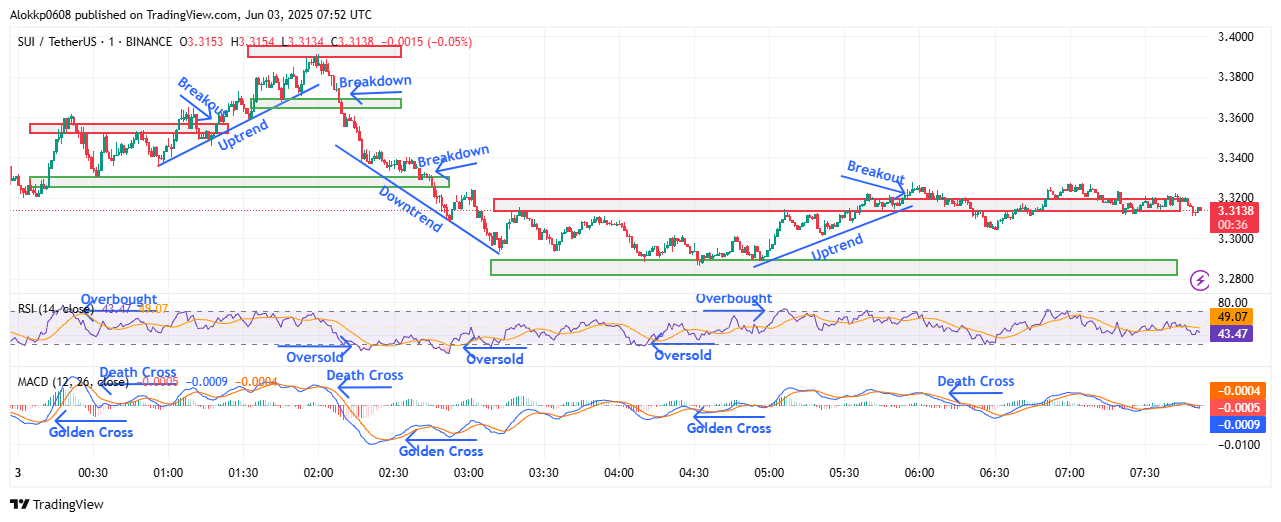
SUI/USDT M-1 Analyzed by Alokkp0608, published on June 3rd, 2025.
From 01:20 UTC to 02:30 UTC, the SUI price peaked near $3.388 and then reversed sharply. The breakdown below $3.364 by 02:09 UTC confirmed a lower high (LH) and triggered a steep downtrend. Price continued falling and breached the earlier support of $3.330 by 02:45 UTC, settling into a new range between $3.289 and $3.313. This downtrend was supported by a MACD death cross near 02:02 UTC and an RSI dip into oversold territory around 02:30 UTC, validating bearish pressure. A golden cross followed at 02:28 UTC, but upside attempts remained capped by persistent lower highs and weak RSI recovery.
Failed Recovery Attempt Then Consolidation
Between 02:45 UTC and 04:57 UTC, the SUI price hovered tightly in a horizontal band from $3.289 to $3.313. Despite two MACD golden crosses during this window, bullish momentum was limited. The structure showed multiple higher lows but no convincing higher highs, suggesting accumulation rather than trend reversal. RSI briefly entered oversold zones twice, but both rebounds lacked follow-through. Resistance remained firm near $3.313, which served as a rejection zone multiple times. This prolonged sideways behavior underlined indecision, with the price unable to reclaim earlier breakdown levels despite technical attempts to shift upward.
A stronger bullish wave began forming from 04:57 UTC onward. Price pushed up from the $3.289 support, forming higher lows and successfully breaking above the $3.313 resistance by 05:54 UTC. This breakout, backed by a MACD golden cross, looked promising but lacked continuation. By 06:02 UTC, a sharp dip toward $3.304 followed, invalidating the earlier breakout momentum. RSI spiked into overbought just before the breakout and sharply recoiled afterward. The failure to hold above $3.313, combined with a fresh MACD death cross at 06:02 UTC, marked the return of downward pressure despite the short-lived uptrend attempt.
False Breakout Above Resistance Stalls Bullish Momentum
Following the brief breakout and rejection, the price remained range-bound between $3.304 and $3.320 through to the chart’s end at 07:50 UTC. While price hovered slightly above the $3.313 level, the structure was flat, and no new higher highs developed. The overall tone remained neutral to slightly bearish, as multiple failed breakouts were not met with rising volume or strong RSI surges. MACD lines flattened with no clear crossover, suggesting a stall in both bullish and bearish momentum. Support near $3.304 held, but resistance just under $3.320 turned sticky. Buyers appeared hesitant, and sellers lacked aggression, keeping price action muted.
SUI Price Faces Weak Momentum Near Mid-Range Levels
SUI token currently shows a fading bullish bias after repeated failures to sustain gains above $3.313. Momentum has stalled near the mid-range zone of $3.304–$3.320. Key support levels are now seen at $3.304 and $3.289, while resistance is set at $3.320 and $3.350. MACD signals are weakening, with the most recent death cross capping upside attempts. RSI hovers near neutral (43–49), reflecting indecision and lack of strong directional force. Unless a breakout above $3.320 occurs with volume and RSI strength, SUI may continue to consolidate or retest lower supports.
SUI Price Analysis of June 9, 2025
The SUI price action today shows a tightly contested market marked by multiple intraday swings and trend shifts. Price opened within a broad consolidation phase between the $3.2150 support level and the $3.2400 resistance level. Early price moves were indecisive, with repeated golden and death crosses between 00:26 UTC and 01:40 UTC reflecting tug-of-war dynamics. A brief breakout above $3.2400 around 01:28 UTC failed to hold, forming a Lower High (LH), and by 02:25 UTC, SUI rolled into a distinct downtrend. The RSI briefly tapped overbought before retreating, while MACD showed momentum fading through a death cross at 02:25 UTC.
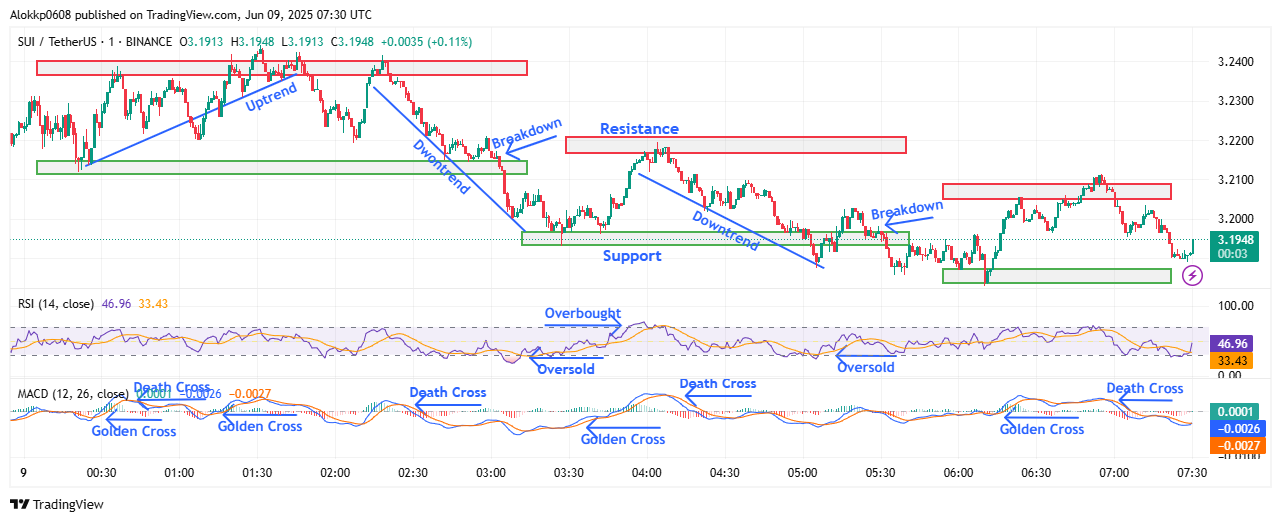
SUI/USDT M-1 Analyzed by Alokkp0608, published on June 9th, 2025.
Between 02:25 UTC and 03:30 UTC, bearish momentum took over, pushing price through the initial support at $3.2150 and confirming a breakdown by 03:03 UTC. SUI then established a new lower structure with SL and RL around $3.1965 and $3.2170, respectively. A Lower Low (LL) formed at $3.1965 by 03:28 UTC before a golden cross on MACD sparked a short-lived recovery. Despite RSI nearing oversold, the recovery couldn’t pierce above the $3.2170 resistance. This zone acted as a firm ceiling, maintaining the lower-high pattern and signaling weakening bullish attempts.
Sharp Breakdown Followed by Weak Recovery Attempts
From 04:00 UTC to 05:30 UTC, SUI price action stayed trapped in a lower range. The earlier rejection at $3.2170 formed another LH, and by 04:08 UTC, MACD confirmed a death cross while the price began descending. A sharp breakdown below $3.1965 occurred by 05:32 UTC, as bearish pressure intensified. This established a new SL near $3.1875. During this phase, RSI entered oversold territory, bouncing briefly but failing to indicate strong accumulation. The chart also showed a series of Lower Highs and Lower Lows, cementing the short-term downtrend. MACD momentum diverged slightly but remained below the signal line until the golden cross at 06:13 UTC.
The bounce from the $3.1875 support area between 06:00 UTC and 06:58 UTC gave bulls a moment of relief. A golden cross on the MACD at 06:13 UTC coincided with price pushing up toward $3.2050, forming a short Higher Low (HL) at the start of this move. RSI climbed out of oversold, pushing toward neutral. Price managed a brief breakout over $3.2050 at 06:52 UTC, but it was not sustained. Just six minutes later, a death cross re-emerged on MACD, signaling fading bullish pressure. The structure formed a new LH around $3.2100 before sellers stepped in again.
Rejection at $3.2100 Hints at Fading Momentum
From 06:58 UTC to the end of the chart at 07:31 UTC, SUI token resumed a gentle decline, retracing most of its earlier gains. The inability to hold above the $3.2050–$3.2100 resistance zone points to a lack of follow-through from bulls. This rejection area has now acted as resistance twice in a short span, increasing its technical relevance. RSI trended downward, approaching the midline, while MACD stayed weak and crossed bearish again. The current structure shows another LH forming, reinforcing the idea of a fading bullish push and a potential continuation of the earlier downtrend unless fresh buying appears near key supports.
SUI Price Testing Support Zone Amid Fading Rebounds
SUI price is back near its $3.1940–$3.1875 support zone, with momentum looking shaky. Unless buyers reclaim $3.2050 with volume, the pressure may return to the downside. The momentum remains mildly bearish after the recent rejection near $3.2100. Key support lies at $3.1875, followed by $3.1720 if the SUI breakdown continues. Resistance levels to watch are $3.2050 and $3.2170. RSI is hovering near neutral but leaning weak, while MACD shows repeated short-term death crosses, signaling indecision but favoring bears. If this structure holds, SUI may revisit support again before any attempt to reclaim lost ground.
SUI Price Analysis of June 30th, 2025
The SUI price action today shows a mostly bearish trend marked by frequent rejections at resistance levels and lower lows forming throughout. Price opened above $2.850 but quickly entered a steep decline around 00:31 UTC, triggering a death cross on the MACD. This move led to a test of the $2.850 support, which briefly held but was ultimately broken by 02:57 UTC. RSI dipped into oversold during the breakdown, aligning with selling pressure. A quick golden cross followed at 03:31 UTC, sparking a recovery to $2.8435, but the rally stalled at resistance, establishing that level as the session’s first clear RL.

SUI/USDT M-1 Analyzed by Alokkp0608, published on June 30th, 2025.
Between 03:45 and 05:37 UTC, the SUI token moved within a descending channel, printing lower highs and lower lows. The rejection from $2.8435 confirmed a structural lower high (LH), and the price declined again to break support at $2.820 by 04:45 UTC. This confirmed another LL around $2.810. While the RSI never returned to oversold, momentum was still clearly bearish. A golden cross appeared at 05:37 UTC as prices attempted to rebound. However, the bounce lacked strength, and MACD flattened out quickly, suggesting only temporary buying interest. The $2.8310 level soon emerged as a short-term LH by 06:35 UTC.
Persistent Downtrend and Support Retests Below $2.810
A fresh death cross at 06:35 UTC marked the beginning of another downturn. This time, the price broke below the $2.810 support, establishing a new SL around $2.7810 by 06:40 UTC. A quick golden cross at 06:55 UTC followed as the price bounced to retest the $2.810 RL but failed to hold above. The inability to reclaim prior support turned resistance solidified bearish control. RSI briefly dipped into oversold during the breakdown but quickly rebounded, consistent with the minor uptick that followed. Yet, no HL was formed during this bounce, keeping the structure weak and vulnerable to deeper tests of support.
Between 07:52 and 09:00 UTC, the SUI price entered a choppy sideways range between $2.7810 and $2.8100, unable to break either boundary with conviction. Multiple MACD signals appeared, a death cross at 07:52 UTC, followed by two golden crosses, highlighting indecision and fading momentum. RSI hovered between 45 and 55, reflecting a balanced but uncertain sentiment. Despite several intrabar spikes, no new HH or HL formed. Instead, the price maintained tight clustering near the lower end of the range, suggesting buyers were defensive and lacked the strength to drive a breakout above the RL.
Rejection at $2.810 Keeps Bulls on the Sidelines
In the final 30 minutes of the chart, SUI hovered near the $2.7921 mark, showing minor strength but failing to reclaim key resistance. The price oscillated between $2.790 and $2.800, still under the short-term RL of $2.810. A golden cross formed on the MACD, yet the histogram showed limited expansion, hinting at weak follow-through. RSI floated around the neutral 52 zone but showed no spike to suggest renewed momentum. The overall structure remains flat and range-bound with no clear HL or breakout. The $2.7810 support zone held, but only barely; any retest may risk a clean breakdown.
SUI Momentum Weakens Below Resistance Amid Tight Range Trading
SUI token continues to trade below critical resistance at $2.810, and without a decisive higher low or volume-backed breakout, the trend remains weak. Momentum appears neutral to slightly bearish, given the repeated rejection at $2.810 and inability to form higher highs. Key SLs now lie at $2.7810 and $2.7600, while RLs are clustered at $2.810 and $2.8435. MACD has seen several golden crosses, but most lacked strength or follow-through. RSI has stayed mostly in the 45–55 zone, reflecting hesitation. If $2.7810 breaks, downside toward $2.750 could open up. Otherwise, a reclaim of $2.810 would be the first step toward reversal.


