

The RENDER token has been making waves lately with its sharp price moves and quick swings throughout the day. When paired with USDT, the Render coin often behaves unpredictably, which is why many traders rely on technical analysis to stay ahead. In this breakdown, we will analyze the RENDER price action, identifying indications such as price patterns, support and resistance levels, as well as take signals from other indicators like the RSI and MACD. While no analysis will tell us what will happen next, these indications help traders to make sense of what is happening now and what might happen next in this fast-moving market.
Render Price Analysis For July 13, 2025
The RENDER price analysis shows strong intraday volatility with clear phases of consolidation, recovery, and channel-based movement before flattening out near resistance. Between 00:00 and 01:30 UTC, the RENDER coin traded in a tight range between $3.66 and $3.69. The RSI was around 50, indicating neutral pressure, while the MACD lines were flat.
From 01:30 to 02:15 UTC, the RENDER price entered a slight downtrend. Candles dipped below $3.66 and hit intraday lows near $3.63. However, RSI didn’t breach the oversold zone, signaling limited bearish strength. Between 02:15 and 03:00 UTC, the Render token reversed the move and started climbing inside an upward channel.
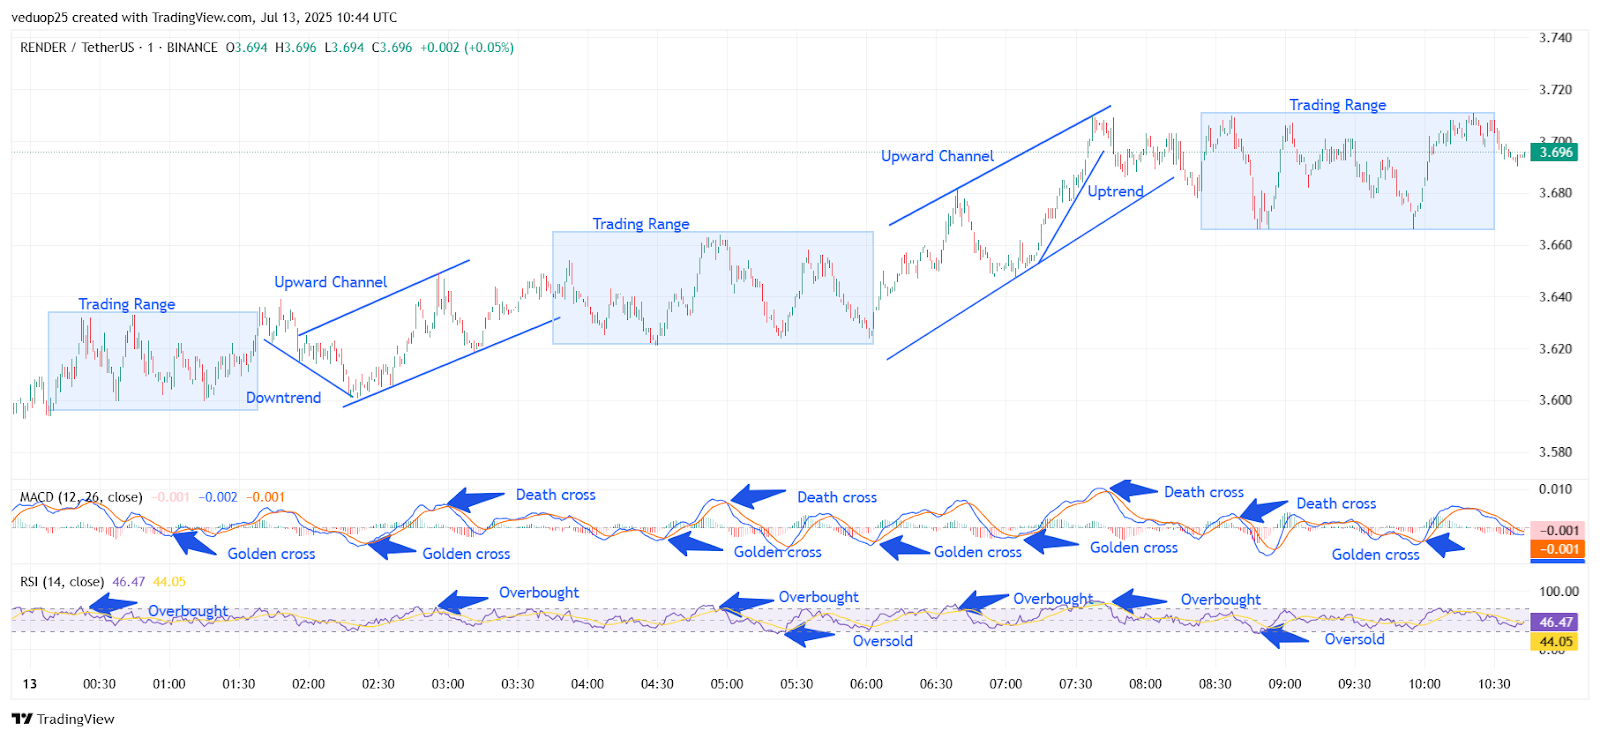
Chart 1- RENDER/USDT M1 Chart, Analysed By Anushri Varshney, Published on TradingView, July 13, 2025
A golden cross appeared on the MACD as the price broke above $3.66. By 03:00 UTC, the RENDER price reached $3.69 again. RSI pushed near 70, briefly tagging the overbought zone. From 03:00 to 04:30 UTC, the coin entered a fresh consolidation. Price stayed locked between $3.68 and $3.71, forming a mid-range trading box. Multiple golden and death crosses occurred during this sideways zone, showing indecision. RSI floated between 45 and 65 with no extremes.
RENDER Price Slides 1.9% from $3.73 to $3.66 Before Entering Tight Range
Between 04:30 and 06:00 UTC, the Render price picked up pace again, rising inside a clean upward channel. It made higher highs and higher lows, climbing from $3.68 to a high of $3.73. A steady uptrend formed near 05:30 UTC. MACD showed repeated golden crosses during this rise, while RSI tapped the overbought zone twice, confirming strong bullish momentum.
From 06:00 to 08:00 UTC, the RENDER coin lost steam. It dropped from $3.73 to $3.66, breaking the lower band of the previous channel. The RSI fell sharply to oversold at 07:45 UTC. A death cross on MACD confirmed the short-term reversal. Between 08:00 and 10:30 UTC, the Render token moved into another sideways phase between $3.66 and $3.71.
Several golden and death crosses occurred without clear direction. RSI fluctuated without hitting any extreme levels. Price action stayed choppy and directionless through this period. As of the last visible candle at 10:30 UTC, the RENDER price trades around $3.696 with weakening momentum. It remains inside a short-term trading range. A breakout above $3.71 may set the next directional leg, while $3.66 remains key short-term support.
RENDER Coin Holds Firm Within Narrow Range After Volatile Swings
The RENDER price shows strong upward movements followed by heavy consolidation. The token displayed a well-formed upward channel mid-session, rising from $3.66 to $3.73 before losing steam. This move was supported by repeated golden crosses on the MACD and overbought RSI levels. However, a sharp correction followed, pulling the Render coin back to the $3.66 zone. Despite the volatility, the price remained steady within a small $0.05 range during the latter hours, likely giving some sign of short-term stability.
Short-term momentum indicators are still exhibiting some cooling off from extremes, with RSI flattening and MACD losing some momentum as bulls and bears fight for control. The RENDER token is currently costing approximately $3.696, very close to the upper limit of the current trading range. A move above $3.71 might set off the next breakout, while any move down below $3.66 may indicate selling has returned. Momentum remains neutral and is awaiting further direction.


