

If you want to invest in or buy the Tezos token and wonder what the right price to start accumulating Tezos is, then you are in the right place. As we go through the analysis, we will determine different patterns and how Tezos reacts to them. We will also see support and resistance, which is a good area for any instrument to buy or sell. Without any further delay, let’s dive into Tezos price analysis and explore different opportunities arising from it.
Tezos Price Analysis of May 10, 2025
Tezos opened the session on a strong note, marking the daily low near the $0.590 level before bouncing into a consolidation range. This range broke out to the upside early in the session, supported by a golden crossover of the MACD. The move led to the formation of a resistance zone around $0.625. Despite RSI reaching overbought levels, buyers retained control. A converging triangle followed, also breaking to the upside, confirming bullish sentiment. Tezos continued climbing, broke out of a new range at $0.625, and spiked to its daily high, reflecting a solid trend-driven session with limited downside action.

Chart 1: XTZ/USDT M5 Chart, Analysed by vallijat007, published on TradingView, May 10, 2025
At $0.591, the Tezos price set the day’s low. A range developed upward at 06:20 UTC, supported by a golden crossover of the MACD following the formation of this support. The Tezos breakout sent the price soaring, creating a resistance zone at $0.625. Meanwhile, the RSI soared over the 70 level, indicating overbought market circumstances and suggesting a possible reversal or at least a correction. Buyers maintained control of the trend despite this signal.
New High at $0.653: Sustained Buying Pressure in Control
A converging triangle pattern then appeared in the price action, with resistance once again at $0.625. The triangle pattern eventually broke out to the upside at 20:50 UTC, supported by a golden crossover of the MACD. This Tezos breakout confirmed sustained bullish momentum and led to another price spike. Following this move, the XTZ price entered a new consolidation phase, forming a range. This range broke out to the upside at 05:50 UTC, again supported by a golden crossover of the MACD. Price spiked higher and marked the high for the day at $0.653.
Tezos has demonstrated strong trending behavior throughout the session, characterized by a series of bullish breakouts and consistent upside spikes. The RSI repeatedly hitting or hovering near the 70 level further confirms the presence of sustained buying pressure. While this signals strength; it also warns of potential exhaustion, as markets rarely remain overbought for extended periods without a corrective phase.
If the bullish trend continues and momentum remains intact, Tezos could aim for the next psychological resistance near $0.670 or $0.700. On the other hand, if the Tezos price starts to pull back, the previous resistance levels at $0.625 and $0.610 may now act as support. Traders should monitor RSI for potential bearish divergence and MACD for any weakening momentum. As long as the XTZ price stays above key support levels and continues forming higher highs, the bullish structure remains intact. However, a consolidation phase or brief correction could be healthy for the next leg up.
Can Tezos Sustain the Momentum?
Confirmed by frequent bullish breakouts and high RSI readings, Tezos is presently displaying obvious trend continuation behavior. The Tezos price could rise toward higher resistance zones close to the $0.670 to $0.700 range if momentum stays strong. Still, a short-term correction or consolidation is conceivable with RSI consistently flagging overbought circumstances. As critical support levels, traders should keep an eye on earlier breakout areas, especially $0.625 and $0.610. These levels will help us assess how strong trends are in upcoming sessions. The bullish pattern is still in place as long as Tezos remains above these supports and the MACD stays favourable. A pause might serve as the foundation for yet another powerful ascent leg.
Tezos (XTZ) Price Analysis of May 15, 2025
The Tezos coin has exhibited a clear bearish trend throughout the session, with most breakouts, especially to the downside, reaching their targets. The price initially broke out upward from a converging triangle but failed to maintain momentum, quickly slipping into a range that broke down. This breakdown triggered a sequence of bearish structures, including a downward-moving channel and failed upside recoveries. Despite a few golden MACD crossovers and oversold RSI conditions, upward attempts lacked follow-through. Each rally was met with renewed selling pressure, pushing the price lower and establishing new ranges, while overbought and oversold RSI signals highlighted the ongoing tug-of-war between temporary bounces and dominant bearish momentum.
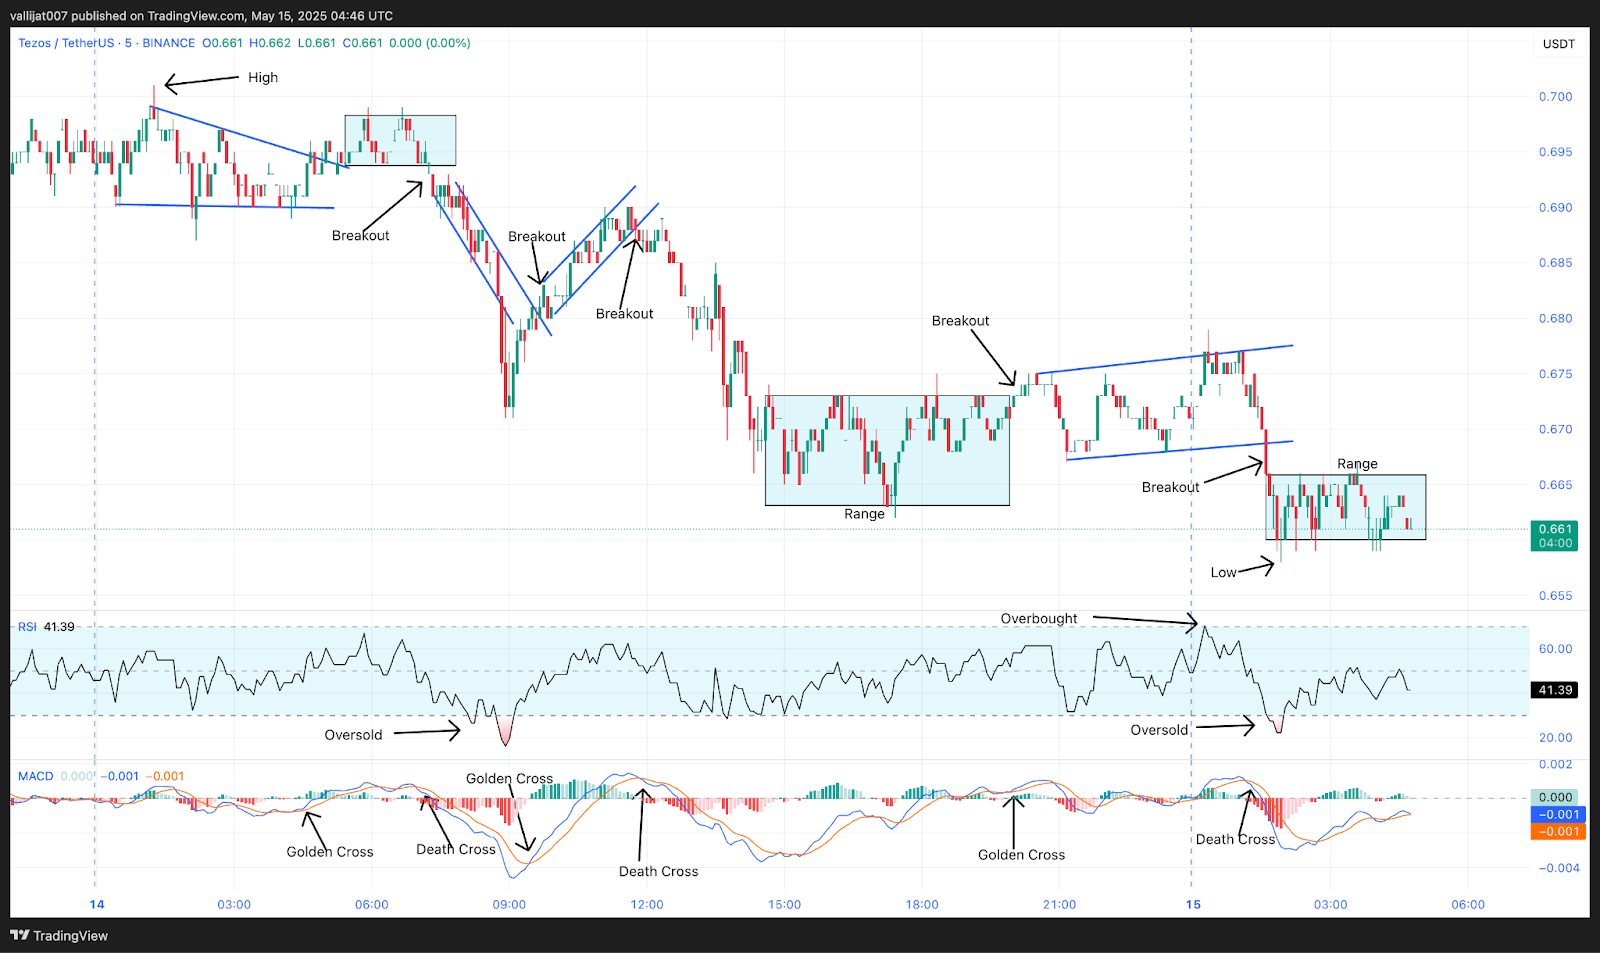
Chart 2: XTZ/USDT M5 Chart, Analysed by vallijat007, published on TradingView, May 15, 2025
The Tezos price formed a converging triangle pattern, which already marked the high for the day at $0.700. The converging triangle pattern broke out to the upside at 05:00 UTC, supported by a golden crossover of MACD. The XTZ price failed to form an upside trend; instead, a range appeared in the price. The range broke out to the downside at 07:20 UTC, supported by a death crossover of the MACD. The Tezos price spiked to the downside and formed a downward-moving channel.
Critical Thresholds: 0.600 Breakdown vs. 0.700 Reversal Potential
At 08:50 UTC, RSI dropped below the level of 30, indicating oversold market conditions, suggesting a reversal or at least a pullback. The downward-moving channel broke out to the upside at 09:45 UTC, supported by a golden crossover of MACD. The Tezos price spiked to the upside and formed an upward-moving channel, but the price did not sustain, and the upward-moving channel broke to the downside at 11:50 UTC, supported by a death crossover of MACD. The XTZ price spiked to the downside and formed a range.
The range tried to break to the upside at 20:10 UTC, supported by a golden crossover of MACD, but the upside breakout failed, and price formed an upward-moving channel. In the meantime, at 00:15 UTC on 15th May 2025, RSI moved above the level of 70, indicating overbought market conditions, suggesting at least a pullback. The upward-moving channel broke to the downside at 01:35 UTC, supported by a death crossover of MACD. The Tezos price spiked to the downside, marking the low at $0.658 and forming a range.
At 01:45 UTC, the RSI dropped below the level of 30, indicating oversold market conditions, suggesting at least a pullback. If the range breaks to the downside, then the price may drop to the level of $0.600, and if the range breaks to the upside, then the price may reach the level of $0.700. The price shows a bearish trending behavior, with most of the breakouts reaching their target price. There are high chances that the price may fall further before rebounding to the upside or may consolidate, as after a strong trend, usually a consolidation phase follows.
Trend vs. Consolidation: Preparing for XTZ’s Next Phase of Tezos Coin
The Tezos price remains under heavy bearish pressure, with most downward breakouts following through and upside attempts repeatedly failing. The current structure suggests sellers are firmly in control, with any rallies quickly fading. RSI has dipped into oversold territory, hinting at a possible short-term rebound, but momentum remains weak. If the current range breaks to the downside, the price could slide further toward key support. However, if buyers can reclaim control, a return toward previous highs is possible.


