

Are you watching the TIA Coin closely after yesterday’s sharp breakout and sudden drop? The Celestia price saw strong movement through the $3.00–$3.40 range but failed to hold its highs, creating an uncertain setup for today. With the TIA price moving sideways and struggling to reclaim momentum, traders are waiting for a clear breakout or breakdown to shape the next trend. Support at $3.10 remains solid, while resistance at $3.25 is starting to cap any upward moves. If you’re tracking TIA’s next move, let’s look at what the chart is showing right now.
Celestia (TIA) Price Analysis of May 11, 2025
The TIA price analysis over the last 24 hours shows a highly active session with multiple breakouts, clear trend shifts, and strong reactions around key levels. Starting early in the session near the $3.00 support zone, TIA held firm within a tight range before a breakout occurred just after 03:00 UTC. Following the breakout, Celestia’s price climbed steadily within an upward channel, reaching as high as $3.28 by around 06:00 UTC.
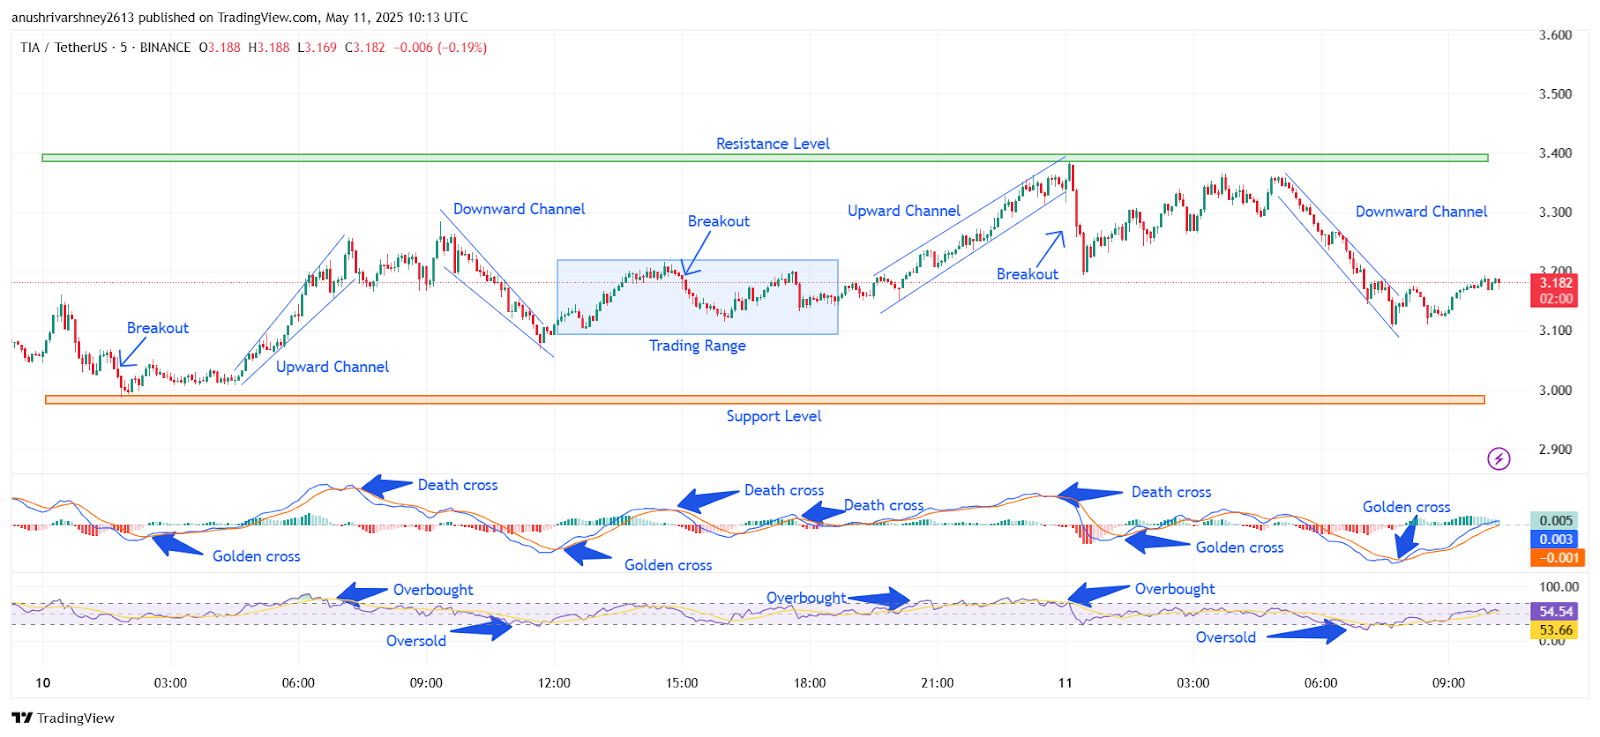
Chart 1- TIA/USDT M5 Chart, Analysed By Anushri Varshney, Published on TradingView, May 11, 2025
After peaking, TIA entered a downward channel, retracing towards $3.16 around 08:00 UTC. The drop was healthy and controlled, with RSI cooling off and MACD flattening. Support held here, and the price soon broke out again, pushing into a sideways trading range between $3.15 and $3.22 for the next several hours. From 11:00 UTC to 17:00 UTC, TIA Coin remained in consolidation mode. During this period, RSI stayed near neutral, and MACD flashed multiple golden and death crosses, reflecting indecision and low volatility. However, this calm set the stage for the next big move.
Around 18:00 UTC, the Celestia price broke out of the range and entered a new upward channel. Buying strength returned, driving the price to its daily high of $3.40 near 21:00 UTC. RSI again hit overbought levels, and another golden cross on the MACD confirmed bullish sentiment. However, this move met heavy resistance at $3.40, causing a sharp rejection shortly after. The rejection triggered a quick fall into a downward channel, with the price slipping back to $3.12 by 02:00 UTC.
TIA Price Faces Rejection at $3.25, Holds Steady Above $3.15
The TIA price today shows limited upward movement after facing rejection from the $3.25 resistance zone during early trading hours. TIA Coin is currently holding above the $3.15 support, trading in a narrow range. RSI remains neutral around 53, while the MACD shows weakening momentum, with a possible bearish crossover forming. The Celestia price has failed to continue the bullish momentum seen yesterday and is now showing signs of consolidation. If buyers fail to step in, the price could drift toward the $3.10 zone. For now, the trend is sideways with mild selling pressure.
Celestia Consolidates as TIA Struggles to Break Range
Over the past 24 hours, the TIA price moved through multiple breakouts and channels, forming clear zones of support at $3.10 and resistance at $3.40. While the Celestia price saw short-term strength, it failed to hold higher levels and is now consolidating. Today’s session shows the TIA Coin struggling to build momentum, with a rejection near $3.25 and sideways movement between $3.15 and $3.20. RSI and MACD suggest a neutral-to-bearish setup, which could lead to a retest of the lower support range. Traders should closely watch if the price can reclaim $3.25 or if it breaks below $3.10. A move outside this range will likely decide the next short-term trend. For now, the price remains in a pause phase, with no strong push from either buyers or sellers.
Celestia (TIA) Price Analysis of May 16, 2025
The TIA price analysis over the last 24 hours shows a clear struggle between bulls and bears, with no strong breakout in either direction. The Celestia price opened around $2.90 and started slipping into a steady downtrend during the early hours. By 06:00 UTC, TIA moved within a downward channel, falling from $2.90 to $2.75.
Between 06:00 UTC and 15:00 UTC, the TIA price traded sideways between $2.74 and $2.83. Several weak push attempts occurred near $2.81, but sellers quickly absorbed the move. Golden crosses formed on the MACD around 08:00 UTC and 11:00 UTC, yet volume remained too low for a breakout. RSI stayed below 50, briefly dipping into oversold around 09:00 UTC and again at 11:30 UTC, hinting at local bottom formations. Despite these signals, buyers failed to reclaim momentum, and price action stayed neutral.
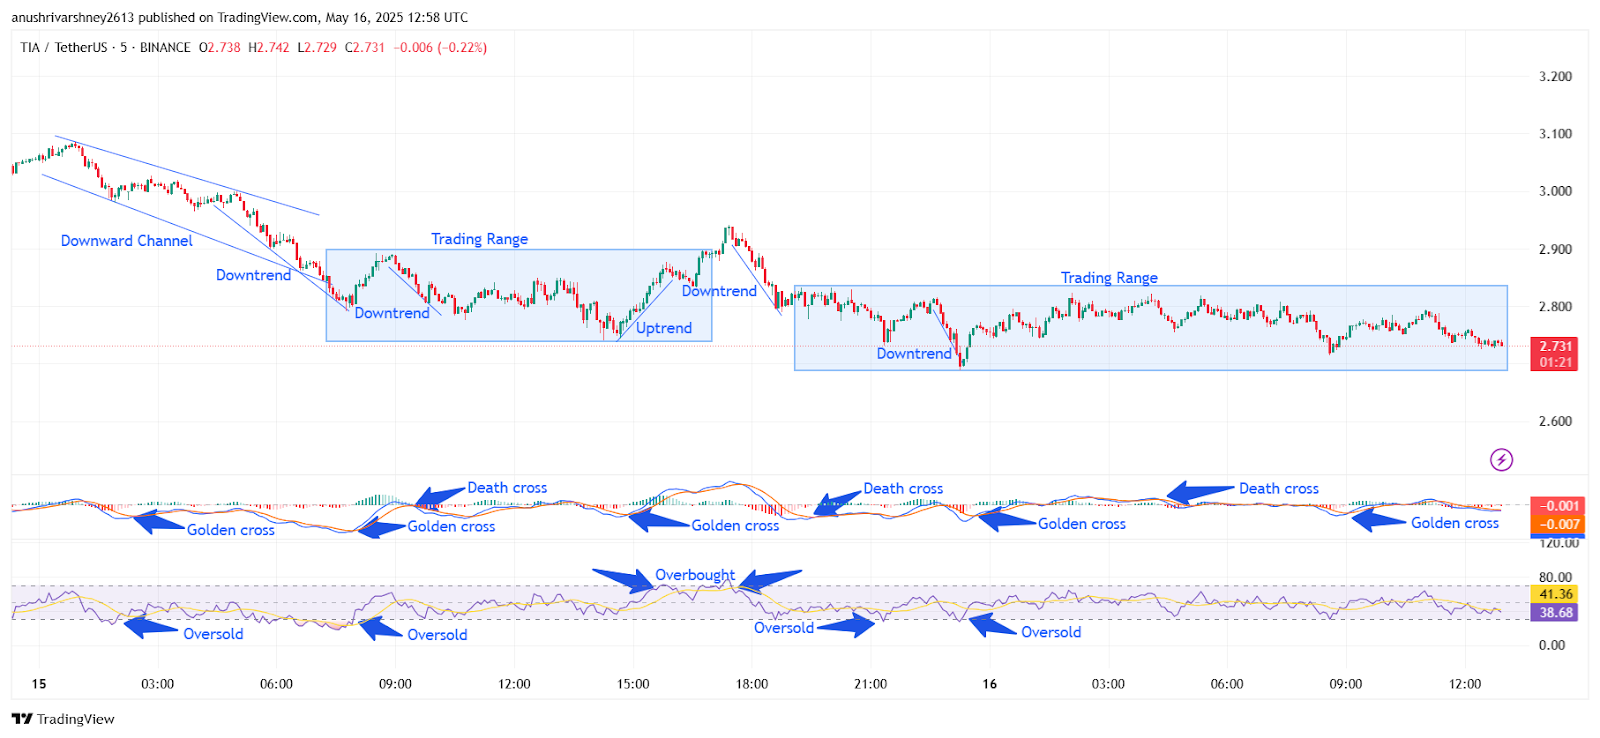
Chart 2- TIA/USDT M5 Chart, Analysed By Anushri Varshney, Published on TradingView, May 16, 2025
From 15:00 UTC to 17:30 UTC, a short uptrend finally kicked in. TIA climbed from $2.76 to $2.85 in a quick recovery. RSI crossed 70, showing an overbought condition, and the MACD gave another golden cross. But this bullish phase was short-lived. By 18:00 UTC, selling returned, and the Celestia price dropped to $2.75. A death cross on the MACD and an oversold RSI reading around 20:00 UTC confirmed that bearish momentum was still present. Overall, the Celestia price showed failed breakout attempts throughout the day. The key structure held steady with $2.74 as strong support and $2.83 blocking any upside move.
TIA Price Holds Between $2.74–$2.83 as Momentum Weakens
Today, the TIA price moved sideways within a narrow range between $2.74 and $2.83, showing minimal strength in either direction. Early attempts to break higher failed, and the Celestia price stayed neutral for most of the session. A golden cross formed around 06:00 UTC, but buying pressure didn’t follow through. RSI hovered near 40, in between oversold and overbought zones. MACD signals were weak, with the histogram near zero. No clear TIA breakout occurred, and the price continued to drift around $2.73 by midday. With momentum fading and no major trend visible, traders remain cautious. A break below $2.74 could lead to lower levels, while $2.83 is resistance for any bullish attempt.
TIA Awaits Breakout While Traders Stay on Sidelines
The Celestia price continues to move within a well-defined range, with no strong breakout in recent sessions. TIA price has encountered challenges near $2.83 and has bounced back up when it dips below $2.74, thereby keeping price action within a small range. RSI and MACD are neutral right now, showing that there is no clear movement up or down in prices. This type of move usually means traders are waiting for more prominent trends before deciding where to invest. A move over $2.83 could lead to a short-term TIA breakout and the chance of an attempt to reach the $2.90 level again. A fall below the $2.74 mark may increase selling, leading the coin towards $2.68. Traders pay close attention to any change in the direction or activity of buying or selling to predict the upcoming trend.
Celestia (TIA) Price Analysis For June 8, 2025
The TIA price analysis showcases a series of high-volatility moves, ranging from early bullish strength to sharp pullbacks and late-stage recovery. The session started with Celestia’s price trading near $2.016. From 00:15 UTC, TIA formed a clean upward channel, with prices climbing steadily toward $2.045. This rise was backed by a golden cross in the MACD and RSI staying above the neutral 50 zone, signaling buying pressure.
By 01:45 UTC, the upward momentum peaked, and a quick TIA breakout above $2.045 was met with strong resistance. Price failed to hold above that level and quickly dropped into a sideways trading range between $2.034 and $2.044. This range lasted from around 02:00 UTC to 03:45 UTC. During this phase, the MACD showed a series of short golden and death crosses, reflecting a lack of strong direction. RSI also hovered between 50 and 55, showing neutral momentum.
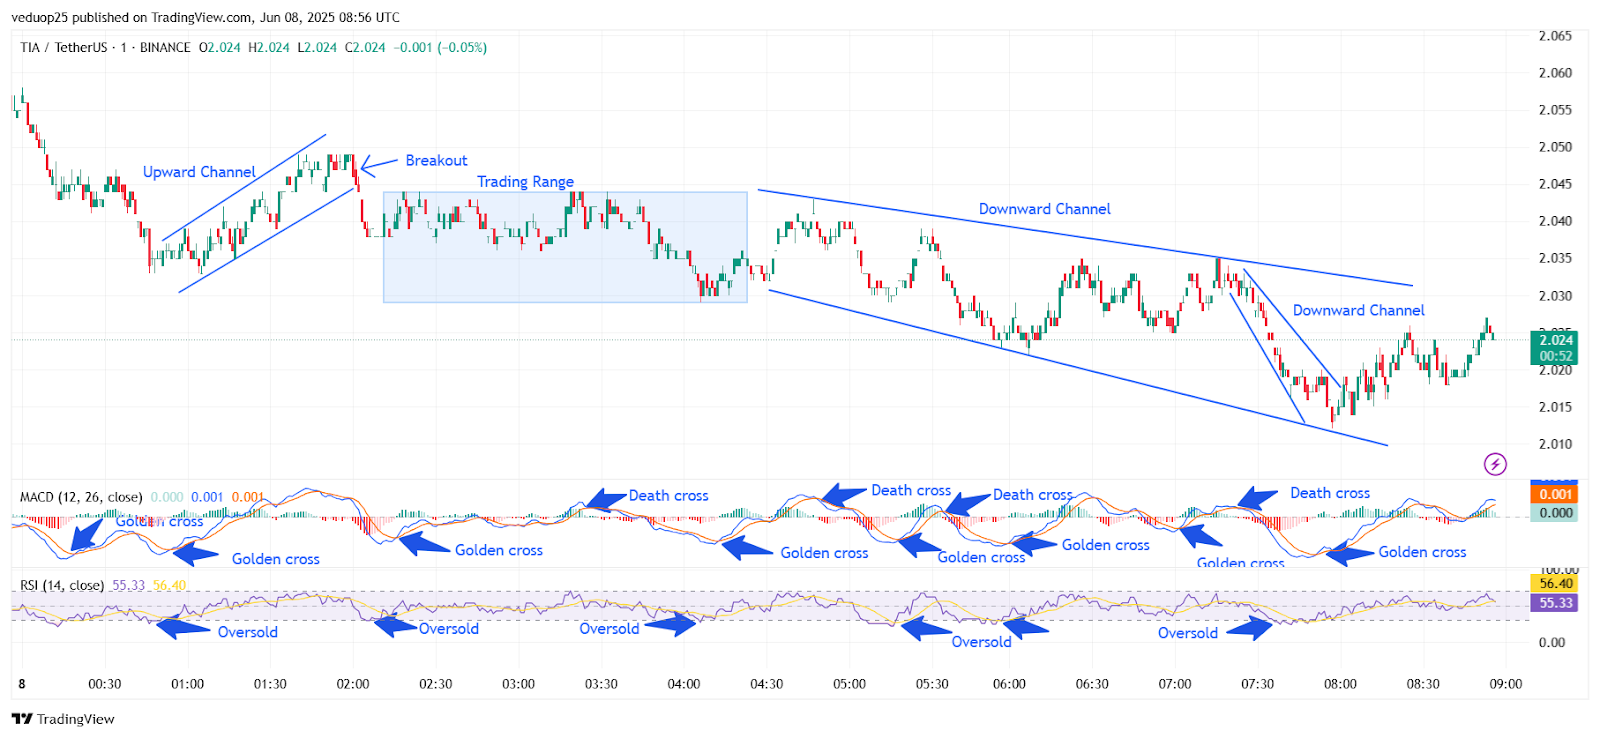
Chart 3- TIA/USDT M1 Chart, Analysed By Anushri Varshney, Published on TradingView, June 8, 2025
At around 04:00 UTC, the TIA price slipped below the lower range and entered a downward channel. This bearish shift was confirmed with a MACD death cross and a sharp RSI drop into oversold territory around 04:15 UTC. Price moved lower toward $2.025 by 05:00 UTC before attempting a short-lived recovery. However, another death cross followed on the MACD, sending the Celestia price lower again.
TIA Price Rebounds From $2.010 Low After MACD Golden Cross and RSI Recovery
Between 05:30 and 07:00 UTC, the price fluctuated inside a broader descending channel. The RSI touched oversold levels multiple times, while the MACD kept flipping, reflecting choppy trading conditions. By 07:30 UTC, TIA hit a session low near $2.010. At this point, RSI again entered oversold territory, and a MACD golden cross formed just after, hinting at a potential bottom.
From 08:00 UTC onward, the TIA price began to recover, breaking out of the smaller downward channel. A golden cross in the MACD added strength to the bounce, and the price climbed back toward $2.024. The RSI also moved back toward 55, signaling improving sentiment as the session neared.
TIA Holds Above Key Support as Momentum Attempts Recovery
The session saw the TIA price stabilize above $2.020 after reclaiming ground lost during earlier downward pressure. Despite facing back-to-back corrections through two descending channels, Celestia’s price showed resilience, especially after multiple RSI oversold readings triggered a short-term bounce. The MACD golden cross near the end of the session added weight to this rebound, suggesting buyers are stepping in gradually.
The $2.010 level has now emerged as a crucial support zone for TIA, while the $2.045 mark remains the key resistance to watch. A clean TIA breakout above this level could signal a stronger recovery phase. However, if momentum weakens again, the price might re-test lower supports. For now, the technical indicators lean neutral with a slight bullish tilt. Traders should watch for confirmation in the MACD direction and RSI strength to gauge the next move in Celestia price action.
Celestia (TIA) Price Analysis For June 11, 2025
The TIA price analysis shows a mix of sharp trend reversals, clean trading phases, and technical confirmations, with the Celestia price moving in and out of channels before ending in a bearish pullback. The day started with TIA entering a downward channel around 00:15 UTC. Selling pressure built up quickly, and the Celestia price dropped steadily toward $2.10. The RSI dipped below 30 during this move, signaling oversold conditions. Around 01:30 UTC, MACD printed a golden cross, suggesting a possible short-term recovery.
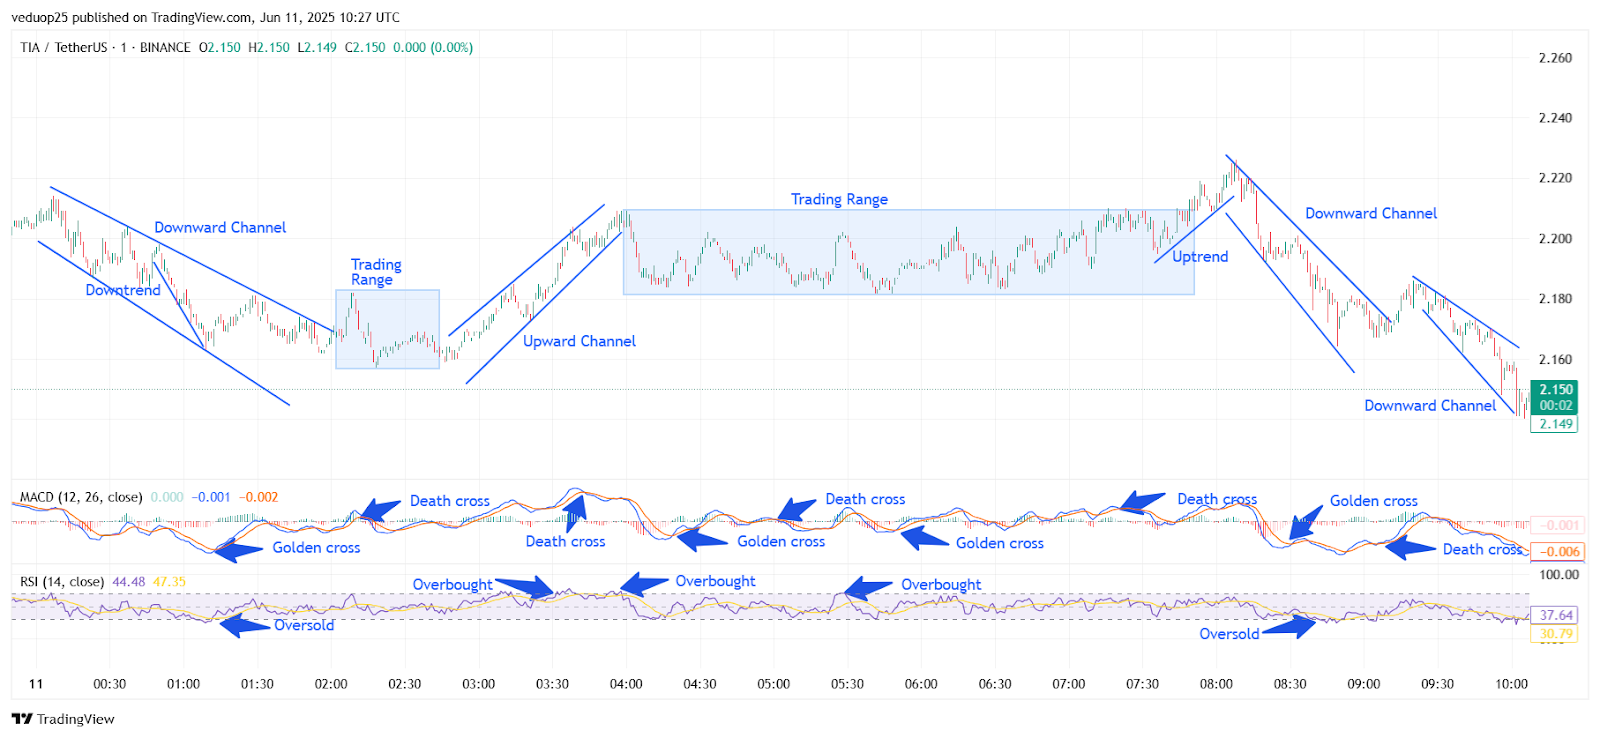
Chart 4- TIA/USDT M1 Chart, Analysed By Anushri Varshney, Published on TradingView, June 11, 2025
By 01:45 UTC, TIA price shifted into a small trading range, consolidating between $2.11 and $2.13. This sideways phase was brief, but it helped RSI recover slightly. Around 02:00 UTC, a breakout followed, leading to a sharp rise through an upward channel that extended to 02:45 UTC. The TIA price climbed above $2.18, and RSI hit overbought territory for the first time during this rally. A death cross on MACD formed at 02:35 UTC, showing early signs of momentum weakening. From 03:00 UTC to 06:45 UTC, the Celestia price entered a broader trading range between $2.17 and $2.22. During this time, RSI hovered between 60 and 75, signaling strong but cooling momentum. MACD flipped multiple times between golden and death crosses, showing mixed signals.
TIA Price Rejected at $2.23 High, Slips Back to $2.18
At 06:50 UTC, TIA showed a short-lived breakout, forming a new uptrend that pushed the price to a session high near $2.23. But the strength didn’t last long. Around 07:30 UTC, bears regained control and the market shifted into a downward channel. MACD showed a clear death cross, and RSI began to fall, reflecting renewed bearish pressure. Between 08:15 and 09:15 UTC, there was a minor recovery attempt, but price action stayed capped under $2.18.
A small descending wedge formed, which led into another downward channel starting at 09:30 UTC. RSI dropped back into oversold levels, and MACD flipped bearish again, confirming strong downside momentum. By 10:00 UTC, the TIA price hovered near $2.15, holding just above key short-term support. The resistance sits around $2.18, while $2.14 acts as the next crucial support level. Unless a clean TIA breakout occurs above the range, the bias remains slightly bearish.
Celestia Price Stalls After Failed TIA Breakout, Bearish Signs Remain
The chart highlights how the Celestia price struggled to sustain momentum after a short-lived TIA breakout attempt. Despite rising above $2.22 earlier in the session, the move lacked follow-through, and bearish pressure took over shortly after. Multiple MACD death crosses and repeated dips in RSI, including two oversold signals, confirmed the shift in trend. With TIA trading near $2.15 and stuck inside a downward channel, the outlook leans bearish unless bulls step in near the $2.14 support.
On the flip side, a strong move above $2.18 could open the door for another upside test toward $2.22. For now, traders should watch for fresh MACD signals and RSI behavior around the 30–50 band. Until a clean TIA breakout above resistance happens, the TIA price is likely to stay under pressure. Short-term volatility remains high, and caution is advised heading into the next session.
Celestia (TIA) Price Analysis For June 13, 2025
The TIA price analysis shows a complete technical cycle, from a sharp early selloff to a solid breakout recovery, followed by a long consolidation. The Celestia price began the session with a strong bearish trend that quickly gained momentum. By 02:30 UTC, the TIA price moved inside a well-defined downward channel, printing lower highs and lower lows. Each drop was met with weak recovery, confirming bearish dominance. During this time, the RSI dipped into oversold territory multiple times, especially around 00:45 and 02:15 UTC, signaling stretched selling pressure. On the MACD, a few early golden crosses tried to spark recovery, but the momentum wasn’t strong enough.
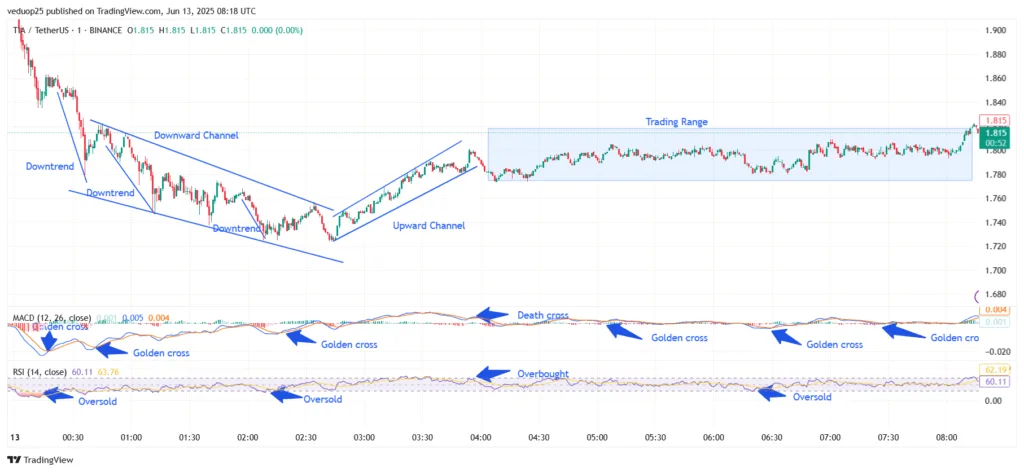
Chart 5- TIA/USDT M1 Chart, Analysed By Anushri Varshney, Published on TradingView, June 13, 2025
By 02:30 UTC, the price bottomed near $1.70 and started reversing. A clean TIA breakout from the downward channel followed, and an upward channel formed between 02:45 and 04:15 UTC. Buyers stepped in with strength, and the MACD flipped bullish with another golden cross, while the RSI climbed steadily above 60, even hitting the overbought zone near 03:45 UTC — a sign of growing bullish momentum.
TIA Price Stalls Below $1.84 as Celestia Enters Sideways Range
The Celestia price peaked close to $1.84 during this uptrend. But after 04:15 UTC, momentum began to fade. The TIA price entered a sideways trading range between $1.78 and $1.84. This range lasted from 04:30 UTC to the end of the session. During this time, the MACD gave mixed signals, printing back-to-back golden and death crosses, which reflected reduced volume and choppy movement. The RSI stayed between 55 and 65, signaling neutral sentiment with no strong trend.
Even when RSI briefly touched oversold again near 06:30 UTC, the price held steady above the $1.78 support zone. On the upper side, $1.84 acted as a cap, rejecting several breakout attempts. The TIA price stayed locked inside this box until the final hour when slight upward pressure returned without strong confirmation.
TIA Price Awaits Clear Signal After Sideways Drift
The TIA price spent most of the session consolidating between $1.78 and $1.84, showing signs of exhaustion after the earlier breakout. The Celestia price held firm above support despite weak momentum, as shown by the sideways RSI and indecisive MACD crossovers. This tight range suggests the market is waiting for a stronger trigger before making its next big move. Bulls tried to reclaim $1.84 multiple times, but each attempt lacked the volume and conviction needed for a clean TIA breakout.
On the downside, the $1.78 level continues to act as a solid support zone, catching each dip. Traders should watch for a confirmed breakout above $1.84 with a bullish RSI push above 70 and a fresh MACD golden cross. Until then, the TIA price remains range-bound, with the market sitting in a neutral stance and waiting for a clear breakout direction.


