

Are you considering investing in Toncoin(TON) and want a clear, data-backed view before moving? This TON price analysis breaks down everything you need to know, from recent price action to key support and resistance levels, plus essential shifts in momentum. Whether you’re eyeing a quick trade or planning a longer-term position, having a solid read on TON’s technical setup could give you a significant edge. Let’s dive in and see where Toncoin might be headed next. Let’s dive into how TON performed over the past sessions and what indicators reveal its next potential move.
TON Price Analysis of 28th April, 2025
On April 27, 2025, the price action of TON on a 5-minute chart shows a bearish opening with Toncoin falling into a descending channel. The price started to weaken between 00:00 and 03:00 UTC, slowly towards $3.30 around 02:00 UTC. During this stretch, the RSI hovered near oversold territory multiple times, confirming weakening momentum. Meanwhile, MACD signaled bearish sentiment with a series of death crosses in this range. Although a minor recovery surfaced after 02:00 UTC, it quickly transitioned into a narrow sideways channel between $3.30 and $3.34, limiting gains to 04:25 UTC as bullish pressure remained capped.

Chart 1, Analyzed by Alokkp0608, published on April 28th, 2025.
Between 03:00 UTC and 06:00 UTC, TON price once again turned bearish, breaking out of its sideways range into another descending channel. Steady selling pressure pushed the price downward, eventually testing the strong support zone at $3.21 by 17:30 UTC. RSI dipped into oversold regions multiple times, highlighting seller dominance. However, MACD began showing hints of bullish divergence around the lower support band, with a golden cross formation brewing. This technical hint prefaced a sharp reversal in momentum, setting the stage for a quick recovery toward resistance levels later in the session.
Between 18:00 UTC and 21:00 UTC, TON price staged a significant rebound, marked by a vertical spike at 19:20 UTC, which led to Toncoin breakout to the primary $3.34 resistance level by 19:55 UTC. The Toncoin price briefly stayed above this barrier but faced immediate profit-booking, triggering another decline. During the surge, RSI readings ventured into overbought zones, while MACD posted golden crosses across this phase, suggesting intense but short-lived bullish sentiment. By 22:05 UTC, bears regained control, forcing TON into another downward channel, retracing gains back toward the $3.21 support line into the early hours of April 28.
TON Price Outlook – What’s Next for Toncoin?
On April 28, from 00:00 UTC onwards, the TON price found solid footing near $3.21 and entered a fresh ascending channel from 02:10 UTC. This led to a strong rally toward the $3.34 resistance level again, momentarily breaching it around 08:05 UTC before slipping back under. During this recovery, RSI readings oscillated between overbought and neutral zones, while MACD showed mixed signals with intermittent golden and death crosses. As of now, Toncoin price is consolidating just under the $3.34 resistance, reflecting a cautious sentiment as bulls and bears battle for control near a critical technical threshold.
Toncoin Breakout or Another Rejection?
TON price is clearly at a crossroads as it hovers just below the key $3.34 resistance. Buyers have shown strength, but repeated rejections suggest sellers are still in the game. If TON can finally break and hold above $3.34, we could quickly see a push toward $3.38 and $3.42. However, a drop to $3.27 or even $3.21 isn’t off the table if the momentum fades again. The RSI and MACD indicators currently send mixed signals, so patience is key. Traders should watch closely whether TON can turn this consolidation into a real breakout. The next big move is building; whichever side wins is likely to be sharp.
Toncoin(TON) Price Analysis of April 30th, 2025
The TON price action on a 5-minute chart on April 29, 2025, began with a prolonged sideways path ranging between $3.24 and $3.30. This trading range held consistently from 00:00 UTC through to around 14:30 UTC. During this period, RSI hovered near neutral levels but showed brief dips toward 40, indicating weakening momentum. The MACD line crossed below the signal line around 03:00 and again near 09:00 UTC, suggesting bearish sentiment was building. Despite multiple minor rallies, the price failed to sustain above $3.30, reinforcing the upper boundary as a short-term resistance level.

Chart 2, Analyzed by Alokkp0608, published on April 30th, 2025.
From 14:30 UTC to around 23:00 UTC, TON price decisively exited its sideways trend and entered a well-defined downtrend channel. The Toncoin price began to decline from near $3.28 and gradually slid past the support region of $3.185. By 23:00 UTC, it finally reached lows of around $3.15 in a significant trend break. In the process, RSI dropped into oversold three times (about 16:30, 19:30, 22:00 UTC), reinforcing bearish behavior. The MACD made death crosses between 15:00 UTC and 22:00 UTC, while each wave of lower lows corresponded to the MACD. The selling was relentless.
TON Recovery and New Trend Structure
By 23:10 UTC on April 29, TON price began to show signs of a recovery, bouncing from the $3.15 support level. This initiated a short but steady rebound that transitioned into a stronger uptrend starting on April 30 at around 01:50 UTC. The Toncoin price consistently made higher and lower highs, forming an uptrend channel. Within this period, the RSI rose from below 30 to briefly hit overbought territory around 03:00 UTC, showing sharp bullish momentum. The MACD confirmed this uptrend with a golden cross just before 00:00 UTC, followed by a continued widening of the MACD histogram bars.
The UC continued strongly until around 05:00 UTC, with price peaking at $3.24, matching the earlier resistance seen on April 29. After this point, TON failed to break through the $3.24 barrier and entered a sideways drift. Between 05:00 and 09:00 UTC, price action became less directional, hovering between $3.21 and $3.24. RSI pulled back from overbought levels and hovered near 53, suggesting weakening buying pressure. A MACD death cross followed around 06:00 UTC, signaling that momentum was fading and a consolidation phase might be underway.
TON Price Outlook – What Lies Ahead for Toncoin?
During the most recent section of the chart, from 06:00 to 09:00 UTC, TON price exhibited low volatility with minor price fluctuations within a tight $3.22–$3.24 band. This period reflects typical post-uptrend consolidation, often forming before a breakout or a deeper retracement. RSI remained balanced near the midline, and MACD histogram bars diminished, indicating neutrality. Despite the earlier rejection near $3.24, the lack of heavy selling below $3.22 suggests buyers are still cautiously present. The Toncoin price behavior leans slightly bullish but awaits a clearer breakout signal to define the next direction.
TON Recovery Slows Near Resistance, Bulls Need Break Above $3.24 to Extend Rally
TON price appears poised for further upside if it can breach the $3.24 resistance convincingly, potentially targeting $3.28–$3.30 next. Momentum is currently neutral to mildly bullish, supported by the TON recovery from the $3.15 level and recent uptrend structure. Strong support remains near $3.18–$3.15, while resistance persists at $3.24 and $3.30. RSI’s recent overbought signal, followed by stabilization near 53, suggests room for another push. Meanwhile, the latest MACD death brings enthusiasm, hinting at needed consolidation. The market awaits a breakout, but bullish continuation remains favored unless price breaks below $3.18 support.
Toncoin(TON) Price Analysis of May 2nd, 2025
The TON price action on a 5-minute chart over the past 24 hours began with a short-lived downtrend channel on May 1, pulling the price from around $3.22 to the $3.13 region by 07:00 UTC. Buyers stepped in near this lower zone, helping to build momentum toward the $3.16 support area. A steady uptrend developed from that base and gradually lifted the price through minor pullbacks. By the 12:00–15:00 UTC window, Toncoin price reached close to the $3.24 region, testing minor resistance before briefly retreating again. RSI had previously signaled oversold near the $3.13 level and flipped to overbought around $3.23, aligning with this reversal.

Chart 3- Analyzed by Alokkp0608, published on May 2nd, 2025.
From 15:00 to 18:00 UTC, the Toncoin price dropped sharply from $3.22 to $3.16 in under 40 minutes, cutting through the prior uptrend. This bearish swing was short-lived as buyers reignited a fresh rally from the support level at $3.16. By 16:40 UTC, the rally reached $3.26, close to the identified resistance zone, before facing rejection. The RSI again touched overbought territory around this rejection, while MACD showed a brief golden cross near the start of the climb, followed by a weakening histogram just before the decline. This price rejection confirmed $3.26 as a strong near-term resistance.
A Range-Bound Pause Before a Breakout Attempt
Between 18:00 UTC and the new trading day on May 2, TON price consolidated in a sideways path between $3.195 and $3.230. Despite multiple MACD crossovers during this range, no sustained momentum was established. The RSI hovered mostly between neutral and slightly overbought, lacking substantial divergence or trend clues. Price repeatedly failed to break above $3.23, and a minor support held firm around $3.195, showing balanced pressure from buyers and sellers. This trading range acted as a reset phase following earlier volatility, with MACD histogram values staying minimal and RSI unable to trigger overbought or oversold signals with conviction.
As the new trading day began, the TON price emerged from the consolidation with renewed bullish momentum. During the 00:00–03:00 UTC window on May 2, the price climbed rapidly from $3.20 toward the resistance level again, briefly tagging $3.26 by 03:10 UTC. However, that level proved stubborn once more, leading to another rejection. RSI touched overbought right before the reversal, while MACD also printed a golden cross just ahead of the peak, indicating a bullish push, but quickly followed by a bearish histogram shift. This quick shift mirrored earlier failed breakout attempts, underlining $3.26 as a ceiling that continues to cap bullish extensions.
New Downtrend Reverses Short-Term Sentiment
After the rejection from $3.26, TON price entered a downtrend channel, declining steadily through the 03:00–06:00 and 06:00–09:00 UTC. It touched lows near $3.18 before attempting a minor rebound. This fall, RSI dropped into oversold territory briefly around 06:40 UTC before recovering, suggesting potential for a base formation. MACD showed multiple death crosses, confirming the bearish momentum, but the histogram began contracting as the price approached $3.18, hinting at seller fatigue. As of the last candle on the chart, the price bounced back above $3.20, potentially forming a short-term higher low and suggesting TON recovery signs.
Price Faces Resistance Headwinds Despite TON Recovery Attempts
TON continues to respect the $3.16 support and $3.26 resistance, creating a defined range for short-term traders. Momentum recently turned bearish after a rejection from the upper boundary, but buyers showed resilience at $3.18. With each significant swing, RSI has cycled between overbought and oversold, highlighting volatility but no clear directional dominance. MACD recently flipped from bearish to neutral, with the histogram flattening as the Toncoin price recovers. If TON sustains above $3.20, a retest of $3.26 is possible. However, a break below $3.18 may open the door toward $3.16 again. For now, momentum remains slightly bearish, but TON recovery signs are emerging.
Toncoin(TON) Price Analysis of May 06th, 2025
The TON price action over the last 24 hours shows an early continuation of the multi-day downtrend, followed by a sideways pause and a brief bullish breakout attempt. From 09:00-12:00 UTC, the Toncoin price steadily dropped within a downtrend channel, even reaching an intraday low of $2.973 by 10:45 UTC. This marked the first significant support interaction, and prices soon entered a sideways consolidation between the key resistance level at $3.020 and support near $2.940. The RSI dipped into the oversold zone during the fall, confirming bearish momentum, while the MACD printed a golden cross around 11:30 UTC, suggesting potential for reversal.
Chart 4- TON/USDT M5 Chart, Analyzed by Alokkp0608, published on May 6th, 2025.

From 12:00 to 18:00 UTC, TON price remained locked within this sideways path, oscillating in a tight band between $2.99 and $3.01. A temporary TON breakout was attempted near 18:50 UTC, pushing the price above $3.020, but this quickly reversed, forming a fake breakout pattern. The RSI entered overbought territory during this spike, indicating short-term buyer exhaustion, while the MACD line began curling down shortly after, leading to a bearish crossover. These indicator movements aligned with the rejection from resistance and hinted at a possible trap for late buyers during this false surge.
Shift to Uptrend and Resistance Struggles
From 18:00 to 00:00 UTC, TON price retested its lower levels and briefly dipped again to $2.978 before finding renewed support. A slow buildup of bullish momentum began in this phase. RSI recovered from near-oversold conditions, and a second golden cross emerged on the MACD at around 23:30 UTC, validating early bullish signals. By 00:45 UTC on May 6, price action confirmed entry into a new uptrend channel, with higher highs and higher lows gradually forming. Buyers started testing the $3.020 resistance zone again as volume increased modestly.
Between 00:00 and 06:00 UTC, the price executed a clean TON breakout above $3.020 around 04:25 UTC and touched a 24-hour high of $3.036. However, the move lacked follow-through strength. The RSI quickly re-entered the overbought region, while MACD momentum began to flatten. By 05:35 UTC, TON fell back below resistance, failing to establish a strong hold above the breakout level. This hinted at weakening bullish conviction and suggested the market still lacked the momentum needed for a sustained rally.
Price Hovers Below Resistance After Rejection
In the most recent stretch leading up to 09:00 UTC, Toncoin price made another attempt to reclaim the $3.020 resistance level around 06:45 UTC but again failed to hold. Prices slipped back toward $2.995, stabilizing in a narrow band just beneath the resistance ceiling. The RSI cooled off from its earlier overbought state and now hovers near the neutral zone. MACD formed a new bearish crossover, indicating reduced upward pressure. This behavior reflects growing hesitation among buyers, with the market likely awaiting clearer direction before initiating the next trend leg.
Bulls Need Strong Push to Reclaim Control
TON’s price appears trapped just below its $3.020 resistance ceiling after two failed breakout attempts. Momentum has shifted into neutral territory, with both buyers and sellers cautious. The RSI shows signs of exhaustion following back-to-back overbought signals, and the MACD now tilts bearish after its recent death cross. If TON price fails to reclaim $3.020 with conviction, a retest of $2.973 or even the broader $2.940 support zone remains possible. However, if bulls regain momentum with volume confirmation, a clean break above $3.036 could open the path toward $3.06 in the short term.
Toncoin(TON) Price Analysis of May 8th, 2025
The TON price action over the last 24 hours manifests a transition from a sideways path to a consistent uptrend. Between 09:55 and 12:55 UTC on May 7, the price moved within a tight consolidation zone between $3.030 and $2.997. A bearish fade followed as TON dipped below the support level, reaching $2.980 by around 16:25 UTC. During this phase, the RSI briefly dipped into the oversold territory, reflecting seller control. The MACD also confirmed bearish momentum with a death cross around 15:30 UTC, further reinforcing downward pressure before flattening into a neutral stance.
Chart 5- TON/USDT M5 Chart, Analyzed by Alokkp0608, published on May 8th, 2025.

From 12:55 to 18:55 UTC, TON price oscillated sideways around the $2.980 mark before initiating a gradual recovery. A moderate uptrend formed by 19:30 UTC, with price making a slow move back toward $3.030. RSI began rising steadily but remained neutral until a brief overbought spike near 00:00 UTC. MACD displayed a golden cross around 21:00 UTC, suggesting a subtle shift in momentum favoring buyers. However, price still faced friction at $3.032, highlighting that bulls had not fully regained control at this point.
Buyers Regain Control with Stronger Momentum
Between 00:55 and 03:55 UTC on May 8, the prices began a sharp Toncoin rally, breaking through the previous resistance at $3.060. This TON breakout transformed that level into a key support zone. The bullish surge was supported by a strong RSI breakout into the overbought region and a golden cross on the MACD, signaling confirmation of upward momentum. Buyers continued to dominate as the price formed a new uptrend channel toward the next resistance around $3.130. This marked a notable sentiment shift, backed by higher volume and consistent support holding above $3.060 during pullbacks.
Between 03:55 and 06:55 UTC, TON price advanced further, climbing toward $3.123 and momentarily stalling just under $3.130. The RSI entered overbought territory multiple times, hinting at exhaustion risks even as the uptrend held. MACD momentum started to flatten, followed by a death cross around 06:00 UTC, suggesting a potential short-term cooling phase. Despite this, buyers held ground above the new support. The lack of immediate rejection below $3.100 indicated that bulls were still present, though no further breakout occurred during this period.
Consolidation Near Resistance After TON Breakout
In the most recent 3-hour window from 06:55 to 09:55 UTC, TON price attempted another push toward $3.130 but failed to break it convincingly. Price moved sideways just below the resistance level, fluctuating slightly around $3.123. RSI dipped from overbought territory but stayed above midline levels, showing balanced sentiment. MACD stayed slightly bearish with its signal line above the histogram, confirming that bullish strength has softened but not fully faded. Price has respected the new support near $3.100, indicating consolidation rather than rejection. Market participants appear to be waiting for further signals before committing to the next direction.
Toncoin Rally Pauses Below Resistance as Bulls Eye Breakout
TON’s recent breakout shows bullish strength, but the price has stalled just under key resistance at $3.130. Momentum is still leaning bullish, but it is showing early signs of exhaustion. If $3.100 holds as support, TON could attempt another breakout above $3.130 toward $3.150. Failure to breach could lead to a pullback into the $3.060 zone. RSI is cooling from repeated overbought spikes, and MACD’s recent death cross hints at waning momentum. Still, the structure remains bullish as long as the price holds above $3.100. Expect a decisive move soon, either a TON breakout toward higher resistance or a reset into consolidation.
Toncoin (TON) Price Analysis of May 12th, 2025
The Toncoin price action over the last 24 hours shows a mix of structured recoveries and reactive pullbacks within a series of channels. Initially, TON price traded inside a mild uptrend channel, rising from a support level near $3.35 to a peak around $3.445 by 13:00 UTC before retracing. This early push followed prior bullish sentiment, but the price quickly returned to retest the $3.35 support, showing vulnerability. The RSI crossed into overbought territory during this first climb, while a death cross appeared on the MACD shortly after, confirming waning upward pressure and opening the door for short-term declines.
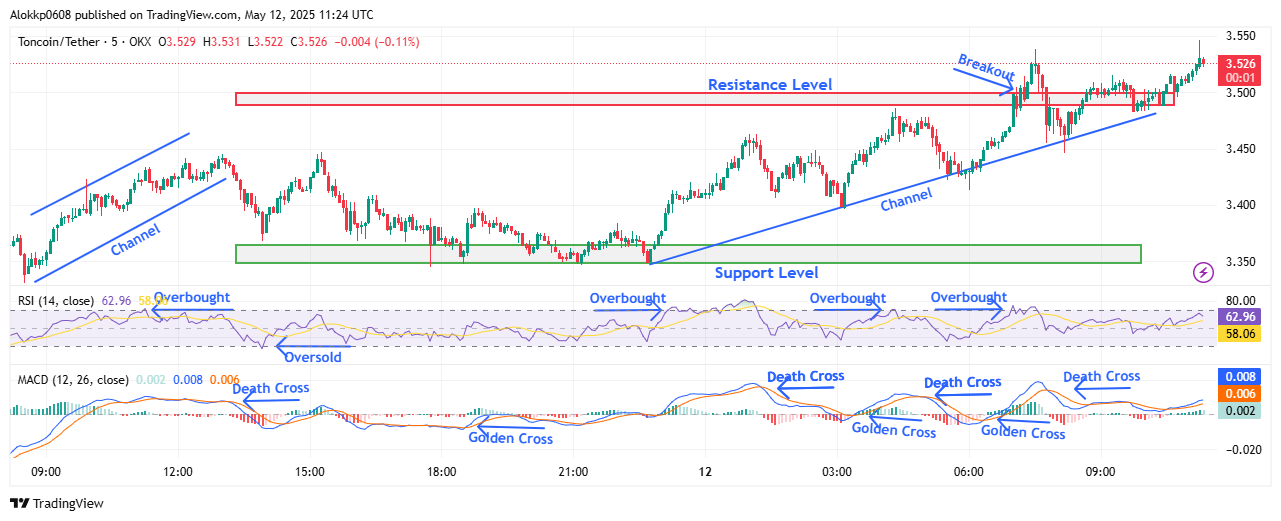
Chart 6- TON/USDT M5 Chart, Analyzed by Alokkp0608, published on May 12th, 2025.
During the 15:00–18:00 UTC interval, TON price rebounded again from $3.35 and re-entered another ascending channel, targeting the $3.50 resistance. However, it stalled near $3.447 and retraced once more toward the same support. Despite reaching near the resistance level, RSI didn’t sustain overbought territory and began dipping lower again. MACD during this window remained mixed, with alternating golden and death crosses, signaling indecision. This period established a back-and-forth rhythm between bulls and bears, with $3.35 continuing to act as a major support base and $3.50 a tough ceiling.
Buyers Regain Control After Mid-Session Struggles
From 18:00 to 21:00 UTC, Toncoin price consolidated tightly around the $3.35 level with low volatility, forming a horizontal base. This pause helped reset RSI, which hovered near neutral after earlier overbought phases. MACD showed a brief golden cross by 20:30 UTC, aligning with the start of the next rally. The price then broke out again into another ascending channel just before 21:00 UTC. As this trend accelerated, RSI began climbing steadily while MACD moved toward another bullish crossover. This recovery phase looked more sustainable, as price consistently made higher lows leading into the early morning hours.
Between 00:00 and 06:00 UTC on May 12, TON price finally broke through the $3.50 resistance in a clean TON breakout move at around 07:20 UTC. This bullish push peaked near $3.538 before a minor retracement below the resistance level. RSI again hit overbought conditions during the breakout, confirming strong buyer momentum. However, multiple death crosses followed on the MACD, suggesting reduced strength and the risk of another short-term dip. Still, the higher support formed just above $3.50 hinted at potential trend continuation if buyers stayed active.
Consolidation Near Resistance After TON Breakout
From 09:00 to the end of the visible chart, around 11:30 UTC, the Toncoin price showed signs of consolidation just above the key $3.50 level. Price hovered between $3.51 and $3.53, with upward spikes testing $3.538. RSI remained elevated but cooled slightly from its earlier overbought peaks. MACD showed a modest golden cross again during the latest rise above resistance, suggesting momentum was attempting a rebound. This recent phase marks a critical test of support-turned-resistance, and the ability of bulls to hold above $3.50 could determine the next direction.
Toncoin Bulls Look to Sustain Breakout Momentum Above $3.50
TON price is holding above the $3.50 resistance after a successful breakout, with momentum still moderately bullish. If buyers maintain control, a move toward $3.56 or even $3.60 is likely. Key support rests at $3.50 and then again at $3.44. RSI has retreated slightly from overbought levels but remains elevated, showing strength without exhaustion. MACD behavior is mixed; recent golden crosses indicate upside potential, but repeated death crosses suggest caution. Overall, the price structure favors the bulls, but only sustained movement above $3.54 can confirm further continuation. Watch for consolidation near resistance to resolve with volume direction.
Toncoin (TON) Price Analysis of May 14th, 2025
The Toncoin price action over the last 24 hours shows a mixed trend beginning with sideways movement near $3.28–$3.30. This consolidation, visible from 09:00 UTC to 14:45 UTC, followed a prior drop and formed a base near the $3.25 support. A clear bullish shift started after 14:45 UTC as prices rallied sharply within an upward channel. By 16:35 UTC, the coin broke through the key resistance level of $3.35, triggering a momentum burst. The RSI also entered the overbought zone during this breakout, confirming the strength of the move. MACD showed a golden cross, adding confluence to the bullish setup.
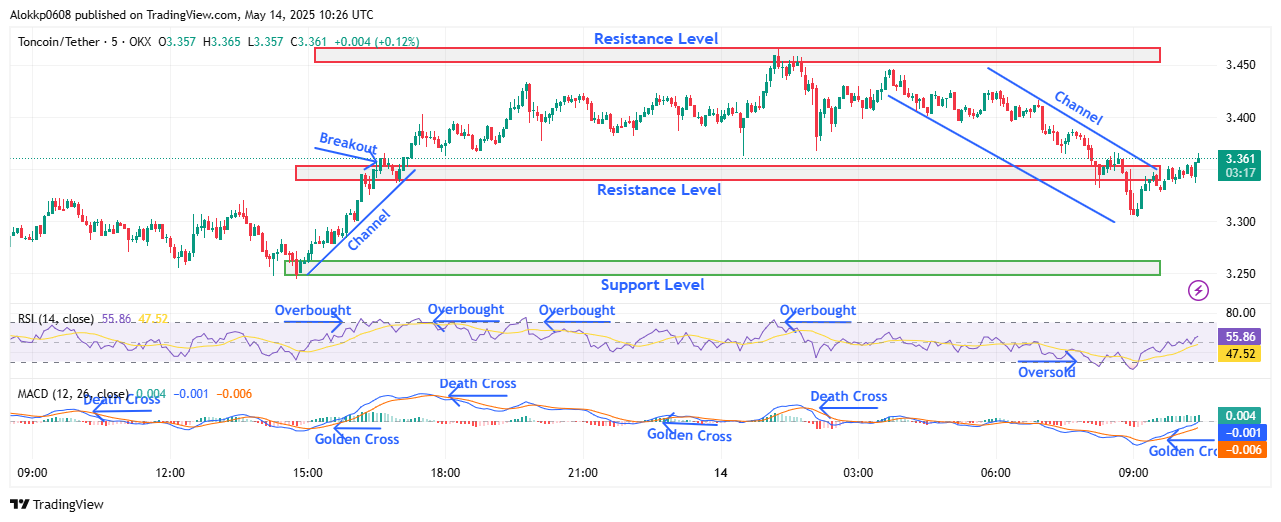
Chart 7- TON/USDT M5 Chart, Analyzed by Alokkp0608, published on May 14th, 2025.
TON Price climbed steadily to reach $3.43 by around 19:50 UTC, but bullish momentum cooled off. The coin then entered a tight sideways path between $3.39 and $3.42, holding ground above the $3.35 TON breakout zone. This range-bound behavior persisted till about 00:45 UTC on May 14. Notably, RSI hovered near the upper band during this phase, signaling consistent buyer strength. Despite the MACD showing a brief death cross, the price did not falter significantly, implying a healthy pause rather than a reversal. The $3.35 level acted as support through this phase.
Buyers Struggle to Sustain Gains Above New Resistance
A second upward push was seen between 00:45 and 01:15 UTC as TON price tested a fresh resistance level near $3.46. However, price was quickly rejected at this level and declined to $3.38, breaking below intraday support. This drop signaled waning momentum and loss of immediate bullish control. From 01:15 to 03:45 UTC, the coin hovered around $3.44 without reclaiming higher ground. RSI cooled off but remained above 50, indicating neutral sentiment. MACD remained flat, reflecting indecision among traders.
The sentiment sharply shifted after 03:45 UTC when Toncoin entered a steep downward channel. Prices fell through the prior $3.35 TON breakout level, touching a low near $3.30 around 08:55 UTC. RSI dipped into the oversold territory during the slide, confirming aggressive selling. MACD also confirmed the bearish control with another death cross. This decline erased nearly all the prior session’s gains and reintroduced the old resistance of $3.35 as a key short-term barrier.
Consolidation Near Resistance After Breakdown
Since touching $3.30, the TON price has shown mild recovery. A golden cross appeared on the MACD around 09:55 UTC, helping the coin edge back toward the $3.35 region. RSI has also rebounded from the oversold zone and now sits in neutral territory near 56. However, the price is still trading just below the earlier resistance zone. This recovery appears fragile, and unless TON clears $3.35 decisively again, the short-term outlook remains capped. The market seems to be recalibrating after the sharp drop, with limited directional conviction in the last hour of the session.
TON Faces Resistance Test at $3.35 Amid Fading Momentum
Toncoin price is at a pivotal point, trading near $3.35, a level that flipped from support to resistance. The recent golden cross on the MACD hints at possible bullish momentum, but it lacks strength without a decisive TON breakout. RSI’s rebound suggests buyers are attempting a comeback, though the earlier rejection from $3.46 caps expectations. If TON reclaims $3.35 with volume, it may retest $3.43–$3.46. However, failure here could drag it back to the $3.30–$3.25 support range. Momentum is currently neutral with fading bullish strength, and traders should watch the MACD signal strength and RSI slope closely.
Toncoin (TON) Price Analysis of May 22nd, 2025
The Toncoin price action today, from the start of trading to 10:50 UTC, shows a recovery from early consolidation to a bullish continuation phase. Between 00:30 UTC and 06:15 UTC, TON repeatedly tested a support level near $3.130 and a resistance level at $3.164. This 6-hour range was marked by sideways moves and mixed momentum. The RSI fluctuated without breaching extremes, while the MACD alternated between minor golden and death crosses, indicating indecisiveness. The overall structure during this phase formed a base with intermittent HLs and LHs, suggesting preparation for a potential breakout after several failed resistance tests.
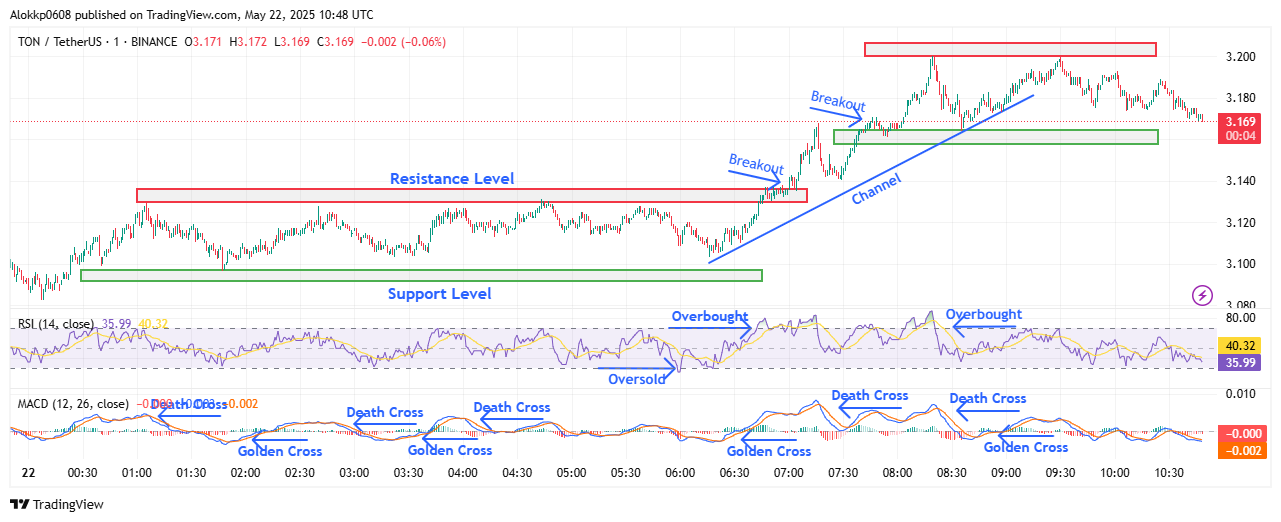
TON/USDT M-1 Chart, Analyzed by Alokkp0608, published on May 22nd, 2025.
From 06:15 UTC to 07:55 UTC, TON price shifted bullish with a breakout through $3.164, initiating a sharp rally that followed a clean uptrend channel. The price established a HH around $3.20 and multiple HLs along the way, confirming structure integrity. This move aligned with a golden cross on MACD at 06:22 UTC and an RSI rebound from oversold territory earlier. The steep rise showed commitment, with volume spikes confirming buying strength. After crossing $3.164, it briefly consolidated above this new support, showing the level had flipped from resistance to support, reinforcing the bullish structure.
TON Breakout Rally Followed by Short-Term Range
From 08:00 UTC to 09:30 UTC, the TON price began to fluctuate between the new support zone of $3.164 and a resistance cap near $3.20. The price registered LHs and LLs within this band, signaling a loss of breakout momentum. RSI readings hovered around overbought levels before cooling off, and MACD gave a death cross at 08:23 UTC, suggesting the momentum was weakening. Despite this, the structure didn’t break down, as buyers defended the new SL. However, the absence of follow-through buying above $3.20 suggested profit-taking and trader hesitation at higher levels.
From 09:30 UTC to 10:30 UTC, Toncoin price continued trading within the $3.164–$3.20 zone. The price formed a mini-range inside this band, with no fresh HHs, indicating consolidation. MACD saw alternating small golden and death crosses, while RSI stabilized just above the midline, neither showing overbought nor oversold pressure. The structure leaned neutral, with traders watching for a decisive move beyond $3.20 or below $3.164. Minor HLs within the channel showed some support, but the lack of increasing volume limited TON breakout potential. This phase looked like positioning before a larger move.
Weak Pullback After Local Top at $3.20
In the final 20 minutes, TON price retested the lower end of its range and closed at $3.169. Momentum faded after the rejection at $3.20, and the last leg down formed an LH below $3.19. MACD lines flattened just below the zero mark, while RSI declined but remained stable, hinting at a short-term cooldown rather than a full reversal. The structure held above the $3.164 support but lacked upside drive. If $3.164 fails, the next SL is the broader zone near $3.130. Upside potential remains valid only on a break and hold above $3.20.
TON Faces Cooling Momentum Below $3.20 Key Resistance
Toncoin’s price current structure shows short-term consolidation after a breakout, with momentum now neutral. Immediate SLs are $3.164 and $3.130, while resistance remains at $3.20 and $3.207. Unless $3.20 is cleared with volume, the upside is capped. RSI has cooled from overbought without hitting oversold, suggesting indecision. MACD, despite earlier bullish crosses, is now flatlining with brief death crosses, indicating hesitation. A confirmed break above $3.20 could revive bullish momentum toward $3.22. However, if $3.164 fails, a pullback to the $3.130 support zone is likely. Traders should wait for clearer confirmation outside this range.
Toncoin (TON) Price Analysis of May 26, 2025
The Toncoin price action today shows a volatile yet structured movement through multiple resistance and support zones. The session began with a sharp spike at 00:34 UTC following a golden cross on the MACD, lifting the price above the $3.00 support. However, this strength was short-lived as rejection near $3.012 caused a reversal. By 01:48 UTC, TON broke below $3.00, confirming a lower high (LH) and leading to a support retest around $2.975. RSI dipped briefly into oversold, and MACD followed with a death cross at 01:00 UTC, cementing bearish control through this stretch.
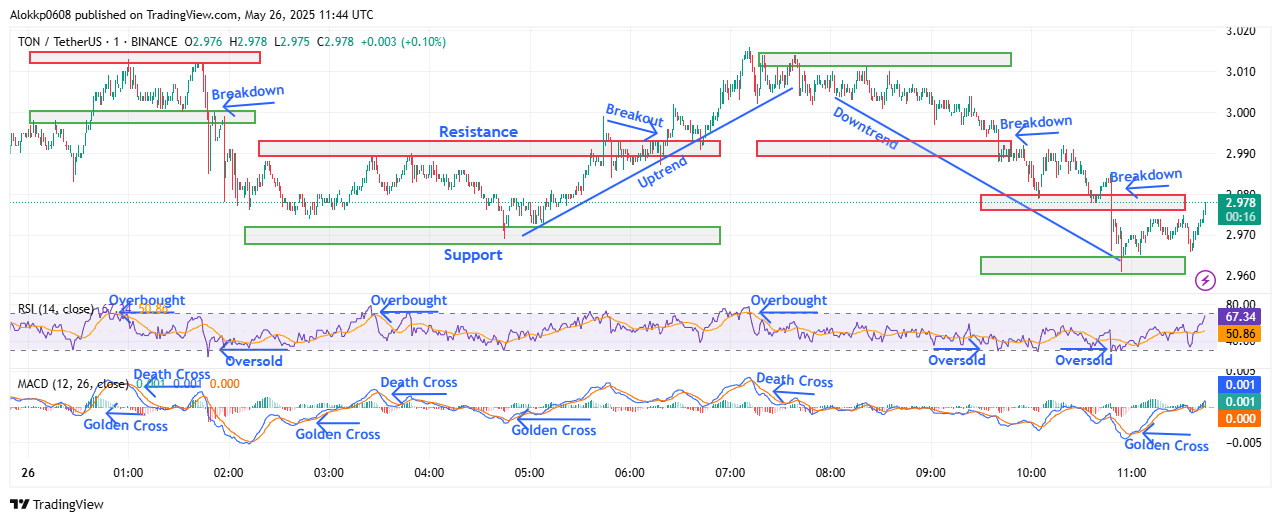
TON/USDT M-1 Chart, Analyzed by Alokkp0608, published on May 26th, 2025.
A minor recovery started between 02:00 UTC and 03:30 UTC, pushing TON price back toward the $2.990–$2.992 resistance zone. However, repeated rejection just below $2.990 confirmed this area as firm resistance. Despite a golden cross on the MACD at 02:40 UTC, RSI peaked near overbought again without confirming sustained strength. A new lower high formed around 03:30 UTC, followed immediately by a death cross, leading to another pullback. The resulting price drop reinforced $2.972 as a key support level, validating the short-term downtrend until a structural change began forming just after 04:30 UTC.
Breakout and Trend Shift Lead to New High
Between 04:48 UTC and 07:11 UTC, the TON price shifted into a bullish trend. A golden cross on MACD and steady higher lows indicated an uptrend forming, breaking above the $2.990 resistance at 06:22 UTC. The move confirmed a breakout structure as RSI surged to overbought. TON reached a session high of $3.016 by 07:11 UTC, marking a higher high (HH). But once RSI cooled and a death cross appeared at 07:13 UTC, the price entered a controlled downtrend. This sequence locked in $2.990–$3.012 as a valid resistance zone, with signs of fading upward momentum.
Downtrend TON Breakdowns Test New Support
A consistent lower high and lower low pattern emerged between 07:15 UTC and 10:00 UTC, marking a clear downtrend. The price fell from the $3.012 rejection area and broke down below the earlier support of $2.990 around 09:40 UTC. MACD remained in bearish territory with no strong reversal signal, and RSI entered oversold twice, confirming bearish dominance. Price eventually dropped to $2.961 by 10:54 UTC, its lowest level of the session. This stretch defined a new support zone at $2.961–$2.965, with resistance adjusted down to $2.980. Despite a slight recovery near 10:00 UTC, the trend remained fragile.
Golden Cross Recovery Shows Initial Strength
Just after 10:54 UTC, TON price began a small but sharp reversal. A golden cross on the MACD at 10:58 UTC supported this move, while RSI bounced firmly out of oversold, pointing to renewed buyer interest. The price quickly reclaimed the $2.965 support zone and pressed through the $2.972 intermediate level. As of 11:44 UTC, TON traded around $2.978, showing short-term higher lows and slight bullish divergence on MACD. While still below the $2.980 resistance cap, the bounce was notable for its volume and momentum. However, it has yet to confirm a new uptrend without breaking $2.980–$2.990.
Price Bounces Back But Faces Resistance Re-Test Near $2.980
Toncoin price appears to be attempting a recovery, but the recent rejection zone near $2.980–$2.990 remains a challenge. Momentum is cautiously bullish in the short term, supported by a fresh golden cross and a rising RSI, now heading toward neutral levels. For upside confirmation, TON must break and hold above $2.990. Immediate support lies at $2.965, followed by $2.961 as a key floor. If rejected again near $2.980, bearish pressure could return swiftly. Traders should watch the MACD for a clean bullish spread and the RSI for a move above 60 to validate further upside.
Toncoin (TON) Price Analysis of May 30th, 2025
The Toncoin price action today shows an early bearish impulse turning into volatile range behavior before a breakout-led recovery. Price opened near $3.370 and sold off quickly, forming a steep downtrend toward $3.315. A temporary rebound failed near $3.376, marking a clear lower high (LH) before renewed selling pressure dragged TON to a confirmed breakdown through the $3.315 support level by 03:25 UTC. RSI dipped into the oversold region around this breakdown, while MACD showed a death cross at the beginning of the fall and only started flattening out just before the breakdown.
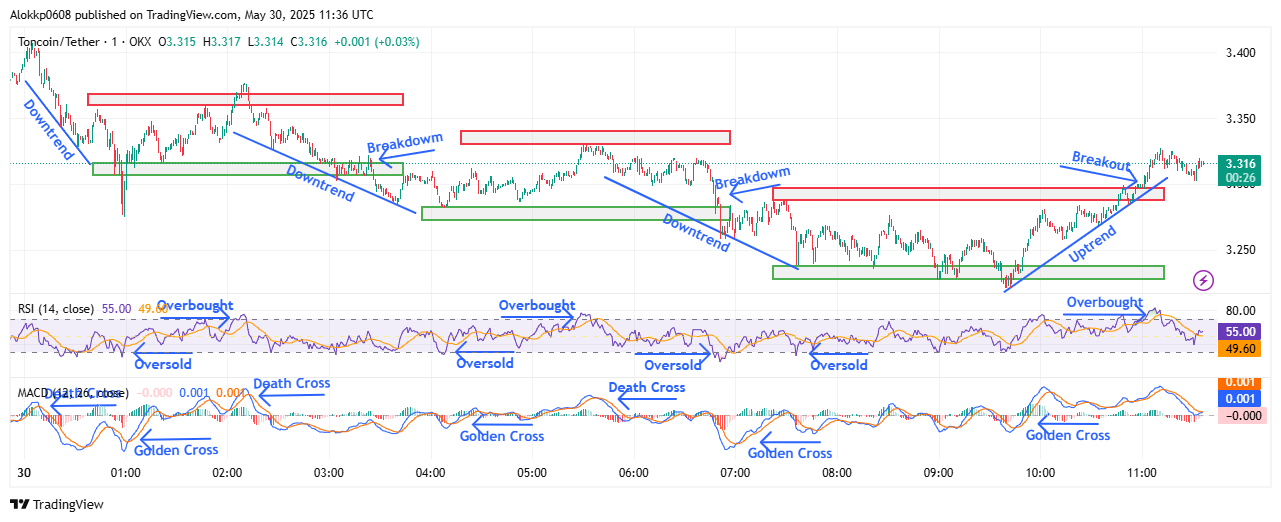
TON/USDT M-1 Chart, Analyzed by Alokkp0608, published on May 30th, 2025.
After falling to a new support zone near $3.282, TON price started climbing again from 04:11 UTC. A golden cross on the MACD coincided with a series of higher lows, establishing a brief uptrend. This move peaked at $3.330 around 05:32 UTC, creating a new local resistance zone between $3.325–$3.330. However, the rally couldn’t hold — price reversed within minutes, and by 05:38 UTC had entered another downtrend. This second downtrend was sharper and confirmed a lower low (LL) around $3.238 by 06:51 UTC. RSI reached oversold territory again, while MACD printed another death cross near the breakdown.
Support Holds, Bulls Regroup in Mid-Session
Between 07:00 UTC and 09:30 UTC, Toncoin found consistent buying near the $3.238–$3.245 support zone. The price tested this area multiple times without breaking lower, forming a base. At 07:55 UTC, a golden cross on the MACD triggered a steady grind upward. RSI also recovered from oversold and hovered near midline during the buildup. Though initial attempts to push above the $3.295 resistance were rejected, a higher low (HL) structure formed repeatedly. By 09:45 UTC, TON made a strong push from $3.255, entering a steeper uptrend phase.
The rally that began at 09:45 UTC quickly gained traction. The TON price pierced through the $3.295 resistance level and confirmed a breakout by 10:58 UTC. The movement created a bullish higher high (HH) near $3.316 and solidified the $3.295–$3.300 range as new support. RSI also spiked into the overbought zone during this rally, while the MACD displayed a clean golden cross that aligned with upward momentum. This breakout ended nearly six hours of indecisive price action, flipping the bias in favor of bulls heading into the late session.
Momentum Builds but Faces Overhead Resistance
In the final segment approaching 11:35 UTC, TON price maintained its breakout above $3.300 but slowed around $3.316. Price flattened slightly below the earlier $3.330 resistance zone, forming what could be an emerging consolidation. The uptrend structure remained intact with a rising slope and consistently higher lows. However, RSI began dipping out of the overbought zone, suggesting buyers might be taking a breather. The MACD histogram narrowed but held above the signal line, keeping bullish momentum alive, though slightly weakened. A rejection near $3.330 or a sideways phase may develop if bulls don’t extend follow-through buying soon.
Breakout Holds Above $3.300, Bulls Eye $3.330 Retest
Toncoin price shows a bullish short-term outlook after reclaiming the $3.295 level with strong momentum. Immediate support lies at $3.295 and $3.282, while resistance remains at $3.330 and $3.376. Momentum remains slightly bullish, with RSI cooling off from overbought but not reversing. MACD continues to support buyers, with its recent golden cross still active. If buyers can sustain control above $3.300, a retest of $3.330 is likely, and a breakout there could target the earlier high near $3.376. However, a drop below $3.295 may reopen the $3.245–$3.282 support zone.
Toncoin (TON) Price Analysis of June 5, 2025
The Toncoin price action today, from the start of trading to 09:42 UTC, shows a volatile session with distinct structural shifts and clear indicator signals. Price initially moved sideways between $3.170 and $3.193, facing multiple rejections around both levels until 01:54 UTC. At that point, a MACD golden cross and RSI rebound near midline signaled a bullish turn. This led to a breakout by 02:30 UTC, pushing Toncoin into a brief uptrend. The price formed a Higher High at $3.223, establishing new resistance, while $3.196 acted as interim support during minor pullbacks between 02:30 and 03:00 UTC.
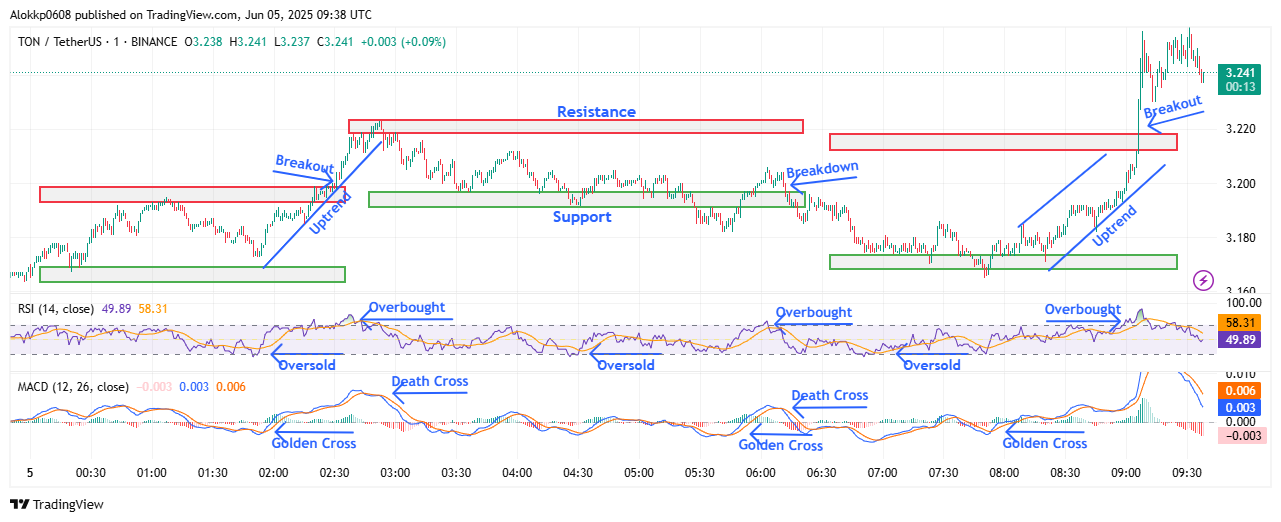
TON/USDT M-1 Chart, Analyzed by Alokkp0608, published on June 5th, 2025.
Between 03:00 UTC and 05:30 UTC, Toncoin entered a congestion phase as bullish momentum faded. After peaking at $3.223, the price created a Lower High and began oscillating between $3.196 and $3.223, forming a tightening range. The MACD death cross near 02:52 UTC hinted at weakening momentum, while RSI gradually descended from overbought territory toward mid-range. Despite repeated tests of $3.196, the support held until 06:18 UTC. The lower highs and pressure buildup ultimately led to a breakdown, confirming that sellers had regained control. Support was redefined lower at $3.174 while resistance shifted to $3.212.
Temporary Breakdown Followed by Weak TON Recovery
From 05:30 UTC to 07:30 UTC, the TON price dipped to a low of $3.182 before a shallow recovery. The bounce toward $3.205 by 06:10 UTC was short-lived, aligning with a MACD death cross and RSI rejection near 60, signaling a lack of strength. This region also marked a Lower High compared to the earlier upthrust. A confirmed breakdown below $3.196 occurred by 06:18 UTC, dragging the price toward the new $3.174 support. The market stabilized around this level, with MACD flattening and RSI nearing oversold, suggesting indecision. A golden cross at 07:53 UTC marked the end of bearish pressure.
Strong Uptrend Ignites After Key Support Hold
From 07:30 UTC to 09:00 UTC, TON Price staged a solid rebound off the $3.174 support zone. A sequence of Higher Lows developed, followed by a clear Higher High at $3.212. The MACD golden cross at 07:53 UTC aligned with RSI snapping back from oversold and entering the overbought zone by 08:50 UTC, validating the uptrend strength. This bullish structure saw price steadily accelerate and eventually break above $3.212. The prior resistance failed to hold, and momentum expanded rapidly as price crossed into uncharted territory, setting up a continuation play.
Breakout Surge Toward New Highs Above $3.250
From 09:00 UTC to the end of the chart, TON exploded upward following a decisive breakout at $3.212. The price rose to a session high of $3.258 by 09:31 UTC. RSI surged into the overbought zone again, indicating strong buyer control, while the MACD histogram expanded with wide signal line separation, a sign of bullish dominance. The structure formed Higher Highs and Higher Lows in quick succession, clearly establishing an aggressive uptrend. Despite brief pauses, bulls maintained control above $3.240. No immediate rejection was seen, confirming continuation pressure building above prior range highs.
TON Price Breaks Out with Momentum Aimed at $3.30+
Toncoin price currently shows strong bullish momentum after reclaiming the $3.212 level and surging to $3.258. The short-term structure favors further upside as Higher Highs and Higher Lows dominate the 1-minute chart. Support zones to monitor are $3.212 and $3.196, while immediate resistance lies at $3.258, followed by a potential psychological barrier at $3.300. RSI remains elevated but not sharply reversing, and MACD continues expanding bullishly after the last golden cross. If momentum sustains, Toncoin could challenge new intraday highs.
Toncoin (TON) Price Analysis of June 10th, 2025
The Toncoin price action today shows high volatility within a tightening range. The token began near a support level around $3.300, triggering a strong uptrend at 00:17 UTC. This rally moved quickly to the $3.330 resistance level, confirming a Higher High (HH) by 00:39 UTC. However, RSI entered overbought territory and MACD marked a death cross shortly after, stalling momentum. For the next hour, price moved sideways within a narrow band of $3.309–$3.330, repeatedly forming LHs (Lower Highs), signaling exhaustion and setting up for a downtrend.
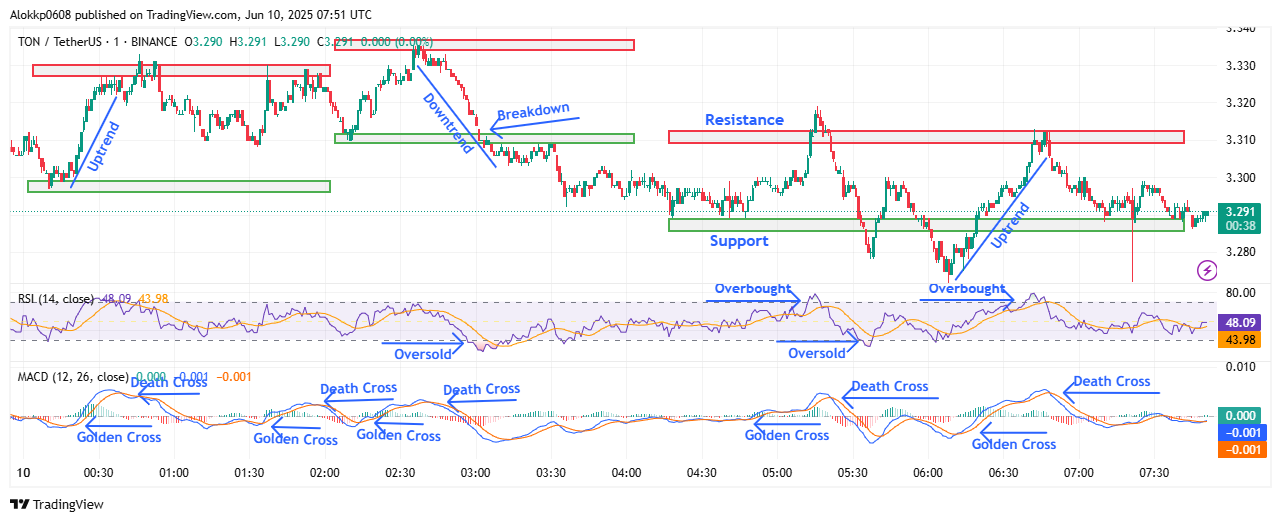
TON/USDT M-1 Chart, Analyzed by Alokkp0608, published on June 10th, 2025.
By 01:58 UTC, TON price transitioned into a clear downward phase. A sharp decline followed, breaking below prior support and forming a Lower Low (LL) at $3.310 by 02:10 UTC. This price behavior aligned with a death cross on MACD and RSI trending below 50. A brief recovery started at 02:14 UTC with a golden cross confirmation and RSI recovery, launching an uptrend. Prices quickly returned to test the $3.335 resistance zone by 02:37 UTC, forming another HH. But the momentum faded again by 02:42 UTC, leading to a second wave of selling pressure.
Breakdown and Support Retests Shape Mid-Session Action
Between 03:00 and 05:00 UTC, TON breaks down below the $3.310 level, establishing a new SL at $3.290. Price hovered sideways for over an hour, forming multiple HLs near support, with MACD staying flat and RSI dipping briefly into oversold territory. A weak rally began at 04:47 UTC, reinforced by a golden cross and RSI bounce, pushing prices above $3.310 by 05:15 UTC. However, the breakout lacked volume and failed to hold, reversing quickly after a death cross at 05:21 UTC. This failed breakout confirmed the $3.310–$3.335 area as strong resistance.
By 06:08 UTC, TON price printed a session low near $3.271, signaling another LL. This zone held firm as RSI dipped into oversold again, sparking a small recovery at 06:10 UTC. The price then entered an uptrend channel, supported by a golden cross and rising RSI. Within the next 30 minutes, TON approached the resistance near $3.310 again but failed to push higher. A Lower High was formed at 06:48 UTC before momentum reversed. A final death cross on MACD signaled loss of bullish control, and prices fell back toward support.
Rejection Near $3.310 Caps Recovery Efforts
The final trading hour showed weakening recovery strength. After rejecting $3.310, the price formed a clear LH followed by a small dip near $3.285. RSI hovered near 48, suggesting neutral momentum, while MACD continued to decline with no bullish crossover in sight. Despite several bounce attempts, buyers could not regain upside traction. The overall pattern reflects compression between $3.271–$3.310, pointing to indecision or absorption around key levels. Without fresh volume or a strong MACD reversal, bullish attempts are likely to face resistance above $3.300.
TON Struggles in Tight Range, Eyes $3.271–$3.310 for Next Move
Toncoin price remains in a neutral-to-bearish posture heading into the next session. The current momentum is fading after multiple failed attempts to reclaim the $3.310–$3.335 resistance zone. Key support lies near $3.271, with a secondary SL around $3.285. On the upside, $3.310 remains a pivotal RL, followed by $3.330. RSI is currently at 48, suggesting no directional bias. MACD shows a bearish tone with recent death crosses and weak histograms. If TON reclaims $3.310 with volume and MACD confirmation, it could attempt another breakout. Otherwise, downside retests remain probable.
Toncoin (TON) Price Analysis of June 14th, 2025
The TON price action today shows early weakness followed by a clear recovery phase. Prices started within a downtrend channel, initially trapped between the $3.015 support level and $3.025 resistance. After hitting the SL by 00:34 UTC, a breakdown occurred by 00:53 UTC. This led to the formation of a lower support near $3.000 and a revised resistance around $3.011. The MACD issued a death cross at 00:10 UTC, reflecting bearish momentum. The RSI briefly dipped into oversold territory near 01:00 UTC, supporting the short-term bottom formed just above the $3.000 level.
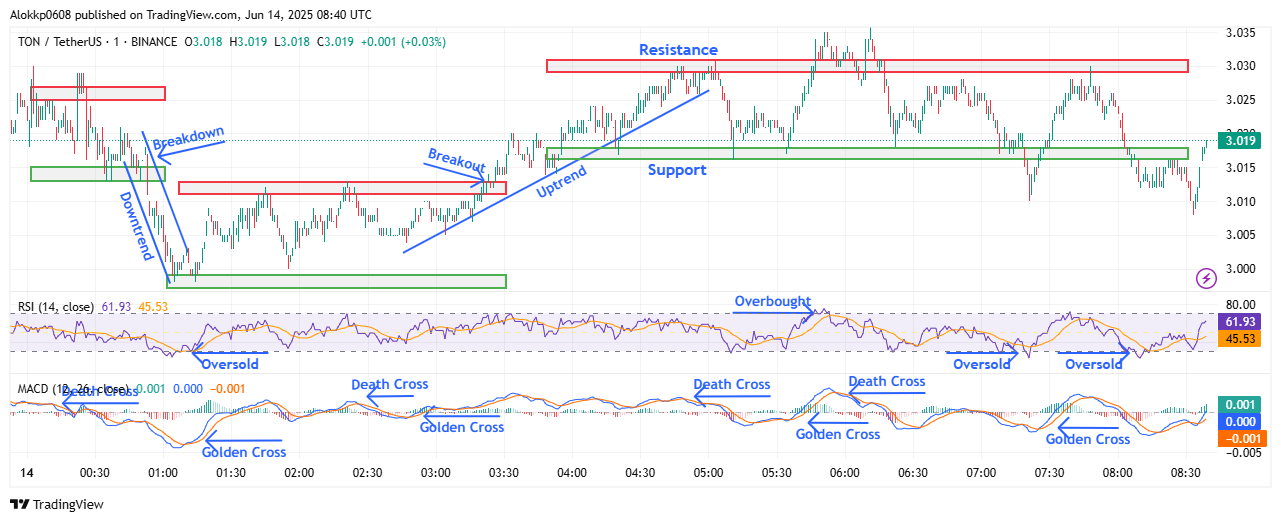
TON/USDT M-1 Chart, Analyzed by Alokkp0608, published on June 14th, 2025.
From 01:12 UTC onward, the momentum shifted bullish as Toncoin price rebounded from support, confirmed by a golden cross on the MACD. Price attempted a breakout above $3.011 multiple times—first failing at 01:45 UTC, then again at 02:21 UTC. These rejections formed two consecutive LHs, while the support around $3.004 held firm, creating an HL. This compression of price action was followed by a MACD golden cross around 02:47 UTC. RSI, having recently rebounded from oversold, climbed steadily through the neutral zone, showing strengthening momentum into the next leg.
Shift from Compression to Uptrend and Resistance Retest
Between 03:00 and 05:00 UTC, TON price entered an uptrend channel, breaking above $3.011 and forming a new support zone at $3.018. A breakout above the prior range occurred by 03:23 UTC, and the price climbed toward the new resistance near $3.031. The structure developed multiple HLs along the way, with consistent bullish MACD behavior. By 04:49 UTC, TON reached its RH just above $3.031, where a rejection triggered a death cross on the MACD. RSI peaked in the overbought region at that point, indicating that momentum was likely exhausted.
The pullback after the 04:49 UTC rejection sent TON back to the $3.018 support, where it attempted another push upward around 05:47 UTC. However, this rally also stalled near resistance, forming another LH. The price dipped back toward support again by 06:22 UTC, showing early signs of weakening momentum. During this span, the MACD printed both a golden and a death cross within a short window, revealing indecisiveness. RSI fell out of the overbought zone and flattened near the midpoint, reflecting fading bullish strength.
Rejection at Key Resistance Zone Near $3.031
After 06:30 UTC, the third rejection from the $3.031 level signaled a firm resistance ceiling. The price dropped steadily, and by 08:33 UTC, TON breached its $3.018 support and tagged a low around $3.008. This marked a temporary LL in the near-term structure. However, the MACD flipped bullish again at 07:25 UTC, just before the decline, and posted a death cross at 07:47 UTC, confirming the bearish follow-through. RSI again dipped into oversold near the low, hinting at a possible rebound.
In the final minutes leading to 08:40 UTC, Toncoin price bounced from the $3.008 low and reclaimed the $3.018 support level. This upward move coincided with another MACD golden cross and a strong RSI recovery, suggesting a fresh bullish attempt might be forming. However, the structure now holds both LHs and LLs, signaling a weak short-term trend until a clear break above $3.031 or below $3.000 occurs.
TON Holds Support but Faces Resistance at $3.031
TON’s short-term outlook leans neutral-to-bullish as it tries to stabilize above $3.018. Momentum remains fragile, while RSI has rebounded from oversold, it’s still below overbought territory, and MACD signals are alternating rapidly. Key support levels are $3.008 and $3.000; a break below these would shift momentum bearish. Resistance remains firmly stacked at $3.025 and $3.031, both having triggered multiple rejections. A close above $3.031 could reinitiate an uptrend with targets toward $3.040. Until then, traders should watch for consolidation within the $3.008–$3.031 range.


