

Are you planning to buy $TRUMP coin but unsure where it’s headed after the recent rally? Then, this price action breakdown is for you. $TRUMP price made some big moves in the past 24 hours, with buyers pushing toward the $15.00 level before getting knocked back. It’s now trading in a tight range just above $14.00, and momentum is cooling off. With indicators showing mixed signals, it’s a key moment to assess support, resistance, and trend strength. Let’s unpack what the chart is telling us.
$TRUMP Price Analysis of 10th May, 2025
The $TRUMP price action over the last 24 hours shows a market that began by extending the bullish momentum from the prior day, with an initial slow rise consolidating into an upward channel. This moderate climb started gaining traction by 08:40 UTC, gradually pushing prices higher within the channel. RSI began to approach overbought territory during this ascent, reflecting growing buyer interest. A golden cross formed on the MACD around 09:30 UTC confirmed bullish continuation. By 13:55 UTC, $TRUMP touched $14.95 near a known resistance, marking a temporary high. However, signs of exhaustion started emerging as RSI hit extreme overbought and MACD momentum began to flatten.

Chart 1- TRUMP/USDT M5 Chart, Analyzed by Alokkp0608, published on May 10th, 2025.
The momentum reversed sharply as the price tumbled from the $14.95 peak, breaking out of the channel and dropping to $13.70 by 16:05 UTC. This downward move coincided with a MACD death cross, validating the trend shift. RSI also dropped steeply, nearly reaching oversold levels. Despite this, buyers defended the key support at $13.70, sparking a recovery toward $14.80 by 18:10 UTC. During this bounce, MACD formed a golden cross, and RSI lifted off oversold territory. However, the recovery lacked strength, and price entered a sideways path afterward, hovering between $14.30 and $14.60 through the evening.
Buyers Lose Steam After Resistance Break
From 21:00 UTC, the $TRUMP started building upward momentum again with a new channel emerging around 23:00 UTC. The price moved decisively toward $15.00, the previously tested resistance. Around 01:15 UTC, there was a brief breakout above $15.00, but this $TRUMP breakout was not sustained. RSI was again overbought, indicating exhaustion, while MACD flattened and showed no significant divergence. This fakeout was followed by a steep decline, as the Trump meme coin price fell rapidly back to $14.14 by 02:00 UTC. A sharp MACD death cross and RSI drop during this period confirmed strong bearish control post-breakout rejection.
$TRUMP Price Consolidation Near Support in Tight Range
From 02:00 UTC to the chart’s end around 09:00 UTC, the Trump memecoin price stabilized within a narrow trading range of $14.03 to $14.57. RSI hovered around neutral, occasionally bouncing between 50 and 37 without strong directional signals. MACD printed a golden cross around 06:00 UTC, but follow-through was limited. This range-bound behavior signals indecision among traders following the failed $TRUMP breakout. Despite recent volatility, the price is finding short-term footing just above the $14.00 level, with no clear trend dominance visible. The last visible candle settled around $14.24, suggesting a pause in momentum as the market awaits further cues.
Momentum Faces Key Test Around $14.00–$14.50
$TRUMP price is currently caught in a sideways structure after rejecting $15.00 and falling back into a tight range. The momentum has faded from both bulls and bears, with RSI trending neutral and MACD showing weak but positive crossover signals. Key support remains at $13.70, while the immediate resistance is near $14.60–$14.95. Unless bulls reclaim $14.80 and sustain above the $15.00 barrier, the bias may remain neutral to slightly bearish. Expect prices to hover between $14.00 and $14.60 short-term, with potential $TRUMP breakout attempts hinging on volume and renewed momentum on indicators.
$TRUMP Price Analysis of May 15th, 2025
The $TRUMP price action over the last 24 hours shows considerable volatility marked by sharp spikes, fast sell-offs, and multiple trend channel shifts. After starting around $13.07 in a brief upward path, the price plunged sharply around 10:20 UTC but reversed just as quickly with a spike to $14.00 by 10:30 UTC. That rapid upswing encountered resistance immediately and couldn’t hold. Trump coin price action then entered a descending channel, breaking below the $13.60 resistance level. By 17:10 UTC, sellers pushed it toward the $12.95 $TRUMP support level. The RSI showed an early overbought signal before the fall, while MACD had already flipped into a bearish death cross.

From 17:10 UTC onward, the $TRUMP rebounded from the $12.95 support, gradually forming an upward channel. Buyers pushed the coin toward the earlier resistance near $13.60, which it tested again by 01:00 UTC on May 15 but couldn’t break. $TRUMP price rejected sharply and moved into a mild downtrend, slipping to $13.15 by 01:50 UTC. The RSI had moved into overbought territory during this $TRUMP recovery phase, but weakening momentum was evident. A MACD death cross around 02:00 UTC foreshadowed the reversal, and subsequent histogram readings remained weak, supporting the bearish tilt.
Trend Shifts After Rejection from Resistance
The failure to breach the $13.60 resistance sparked a fresh downtrend. From 01:50 UTC to 05:50 UTC, the $TRUMP declined steadily within a descending channel and eventually breached the key $12.95 $TRUMP support level. By 05:50 UTC, $TRUMP fell to $12.72, triggering oversold RSI conditions. MACD also showed a bearish death cross shortly before the drop, confirming seller strength. Despite momentary bounces along the way, bearish momentum remained intact, reflecting lower highs and consistent RSI weakness. Each failed bounce only led to another leg lower, underscoring a lack of strong buyer presence during this phase.
Sellers Push Below Support, Buyers Hesitate
After falling through support, the Trump coin slid further to $12.56 by 07:45 UTC. MACD finally showed a golden cross shortly after, and RSI rebounded from oversold, suggesting potential short-term relief. However, that bounce lacked follow-through strength. $TRUMP prices tried to stabilize around $12.70, with RSI recovering slightly above 50, but without any break above resistance. The MACD lines remained close to neutral, showing indecision. Volume also appeared to dry up during this time, indicating buyer hesitation despite the rebound attempt. No bullish divergence appeared on indicators, leaving the trend direction uncertain.
$TRUMP Price Mild Rebound, But Momentum Lacks Strength
As of the latest visible price near $12.71, TRUMP is attempting a slow recovery but still faces headwinds. The bounce from $12.56 appears corrective rather than trend-reversing. Resistance now forms near the broken support zone at $12.95, while stronger resistance remains at $13.60. MACD recently formed a golden cross, but the move lacks conviction without higher price highs. RSI hovers just below 51, suggesting neutral momentum without strong buyer pressure. Until bulls reclaim key resistance zones with volume support, the rebound is likely to remain weak or get sold into again.
TRUMP Coin Struggles Below Key Resistance, Downside Bias Persists
The Trump price is showing weak recovery signs after a sharp drop, but momentum remains fragile. The current trend leans bearish unless price can reclaim $12.95 and sustain above it. Resistance remains strong at $13.60, and the immediate $TRUMP support level is now at $12.56. RSI has exited oversold but still lacks bullish conviction. MACD golden cross suggests possible short-term upside, yet signals remain shallow. Unless buyers step in strongly above $13.00, TRUMP risks falling back toward $12.50. The overall momentum is neutral but fading, and traders should watch $12.95–$13.15 as the pivot zone for the next direction.
$TRUMP Price Analysis of May 27, 2025
The $TRUMP price action today, from the start of trading to 07:30 UTC, shows a volatile structure that began with a weak sideways trend before sharply breaking down. Between 00:00 and 01:00 UTC, the price ranged between $12.65 and $12.78 in a shallow decline, repeatedly testing support at $12.65. The $TRUMP breakdown at 01:00 UTC triggered a steep fall, forming lower lows (LL) that reached $12.37 by 01:20 UTC. This established a new Support Zone between $12.37 and $12.48. During this drop, RSI dipped into oversold territory, and MACD confirmed bearish sentiment with a death cross at 00:19 UTC.
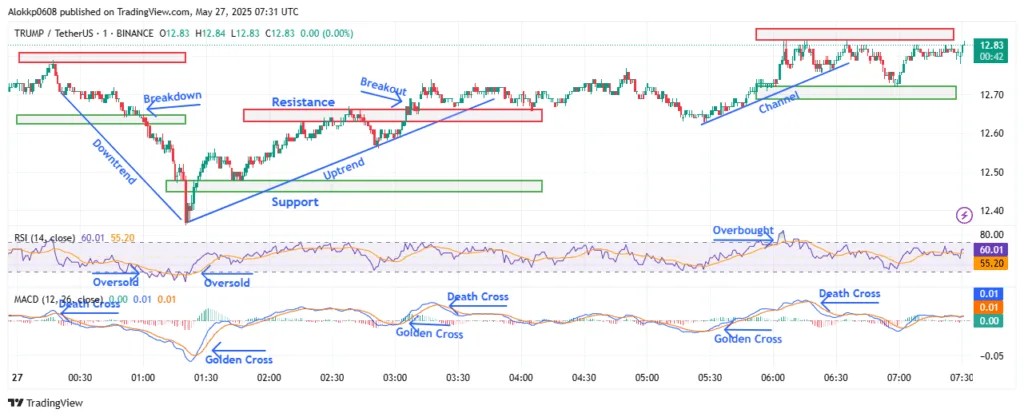
TRUMP/USDT M-1 Chart, Analyzed by Alokkp0608, published on May 27th, 2025.
From 01:20 to 03:00 UTC, $TRUMP entered a clear uptrend, establishing a series of higher highs (HH) and higher lows (HL), capped by a breakout above resistance at $12.66 by 03:07 UTC. A golden cross on MACD at 01:25 UTC confirmed the bullish reversal. Price remained strong above the earlier resistance, now flipped support, as RSI bounced back from oversold levels, signaling a momentum shift. However, a short-lived death cross at 03:21 UTC hinted at consolidation pressure, which aligned with choppy structure just above the breakout zone.
Consolidation Within a Tight Channel
Between 03:00 and 05:15 UTC, the $TRUMP price moved in a sideways channel between $12.66 and $12.77, showing a lack of directional conviction. Multiple lower highs (LH) were followed by brief recoveries, creating a neutral structure. RSI remained stable just below the overbought threshold, while MACD flattened, indicating reduced momentum. The structure reflected hesitation near the resistance zone, suggesting that bulls were absorbing selling pressure rather than surrendering the trend. This period formed a valid base for the next leg, as the price continued hovering just below the previous highs.
Uptrend Reignited After Temporary Dip
At 05:15 UTC, TRUMP memecoin briefly dipped to $12.63 before bouncing sharply, initiating a fresh uptrend. This dip retested the earlier breakout level, which held as support, validating a new SL at $12.72. By 05:27 UTC, a MACD golden cross aligned with the new upmove. The price then formed higher lows (HL) and moved steadily toward the resistance zone near $12.85. RSI briefly entered the overbought region around 06:00 UTC during this rally, signaling strong bullish intent, though the overbought condition triggered modest pullbacks later. Price remained within a clean ascending channel up to 07:30 UTC.
Breakout Attempts Face Overhead Pressure
In the final stretch, from 06:30 to 07:30 UTC, the $TRUMP price repeatedly tested the $12.85 resistance but failed to secure a decisive breakout. Several small-bodied candles showed hesitation near the upper boundary of the channel. A MACD death cross at 06:18 UTC hinted at possible short-term exhaustion, although the price held its uptrend structure. RSI softened from the overbought zone but stayed above the median line, indicating buyers were still active. The resistance at $12.85 continues to cap bullish momentum for now, forming a potential double-top rejection unless buyers push higher with volume support.
$TRUMP Price Hovering Below Resistance With Bullish Bias Intact
TRUMP memecoin’s current momentum is bullish but cautious, with the price consolidating just below resistance at $12.85. A confirmed breakout above this level could trigger a quick rally toward $12.92. However, failure to break out may lead to a retest of $12.72 or even $12.66, where new support has formed. Momentum indicators suggest mixed signals, RSI is neutral after earlier overbought levels, while MACD shows weakening follow-through. Support zones to monitor are $12.72, $12.66, and $12.48. Resistance remains firm at $12.85, followed by $12.92. If MACD turns up again, a bullish continuation remains likely above $12.85.
$TRUMP Price Analysis of June 12th, 2025
The $TRUMP price action today shows an overall bearish structure marked by a series of lower highs and breakdowns. Price opened around the $10.68 resistance and struggled to maintain upward momentum through the early hours. Between 00:00 UTC and 02:10 UTC, the price oscillated within a tight range, repeatedly testing the $10.58 resistance and $10.68 rejection level. This range coincided with multiple MACD golden and death crosses, reflecting indecision. RSI dipped briefly into the oversold zone near 01:00 UTC but otherwise hovered in a neutral band. The market was searching for direction, and each rally attempt was met with immediate resistance pressure.

TRUMP/USDT M-1 Chart, Analyzed by Alokkp0608, published on TradingView June 12th, 2025.
From 02:10 UTC to 03:20 UTC, the $TRUMP price entered a clear downtrend after a sharp breakdown below the $10.58 support. This movement was accompanied by a MACD death cross and RSI falling toward the 40-level. Price fell to a new intraday low near $10.50, which then established a temporary support zone. The pattern formed a lower high at $10.62 around 03:47 UTC before reversing again. Despite a golden cross on the MACD around 03:31 UTC that briefly lifted the price, the inability to break above $10.62 marked weakness. This section reflected sellers regaining control after every minor bounce.
Bearish Breakdown and Failed Recovery Attempts
Between 03:51 UTC and 05:07 UTC, TRUMP memecoin showed another rejection from the $10.62 level, forming a lower high, then sharply broke below the $10.50 support. This breakdown coincided with a MACD death cross at 03:51 UTC. Price quickly moved into a new range, establishing a fresh SL at $10.42 and RL near $10.52. The RSI also neared the oversold zone again, but without a sharp rebound. There was a brief golden cross on the MACD at 05:15 UTC, but follow-through was weak. TRUMP struggled to generate bullish momentum, and every rise failed to form a higher high.
From 05:10 UTC to 06:50 UTC, the $TRUMP price traded in a narrow sideways channel, unable to decisively reclaim the $10.52 resistance. The MACD flipped bearish again with another death cross near 05:40 UTC, while RSI continued hovering near neutral levels with no strong overbought or oversold activity. The market lacked conviction, and the price hovered between $10.42 and $10.50 with no sustained breakout attempts. The price formed a sequence of lower highs again, hinting at seller dominance even in consolidation.
Rejection at Support Bounce Fizzles Out
The final leg of the session saw a mild bounce attempt from the $10.42 support zone after 07:00 UTC, but once again, resistance near $10.50–$10.52 held firm. The MACD showed some bullish behavior with a minor golden cross, but RSI stayed muted, never reaching overbought levels. The structure continued forming LHs and LLs, confirming persistent bearish pressure. By the end of the chart at 08:28 UTC, the price stood at $10.43, just slightly above the lower bound. Despite repeated support tests, there was no strong bullish recovery or breakout signal.
TRUMP Faces Bearish Pressure Below $10.52 Zone
The TRUMP memecoin price appears stuck in a weakening structure with fading momentum. Short-term outlook remains bearish to neutral unless a clean break above $10.52 resistance occurs. Price is currently hovering just above the $10.42 support, which remains key. If $10.42 breaks, the next downside level could be around $10.35. Key resistance levels are now stacked at $10.50 and $10.52, while the broader range extends up to $10.58. MACD’s recent death cross shows weakening momentum, while RSI has avoided extremes but never gained upward steam. Any recovery effort will need a strong RSI push above 60 and a MACD reversal to signal trend change.
$TRUMP Price Analysis of June 26th, 2025
The $TRUMP price action today shows a volatile session marked by sharp breakouts and deep pullbacks. Price opened with strong bullish momentum, racing from the support level of $8.92 to test resistance at $8.99 by 00:17 UTC. After a short rejection, a second rally began at 00:47 UTC and eventually broke through $8.99 by 01:33 UTC. This breakout was followed by a sharp spike to $9.07 by 01:37 UTC, forming a higher high. However, a MACD death cross at 01:41 UTC signaled an incoming downtrend, aligning with RSI pulling back from overbought levels.

TRUMP/USDT M-1 Chart, Analyzed by Alokkp0608, published on TradingView June 26th, 2025.
Between 01:45 UTC and 03:15 UTC, Trump Memecoin retraced aggressively, forming a lower high near $9.04 before descending toward a newly established support at $8.97. A brief golden cross on MACD at 02:50 UTC attempted to revive the momentum, sparking a minor breakout above $9.07 at 03:04 UTC. But the rally was short-lived. The price fell again by 03:09 UTC, triggering a fresh MACD death cross and slipping into a downtrend that solidified with a lower low near $8.95 by 04:05 UTC. This confirmed a bearish lower-high, lower-low structure and suggested exhaustion in upward pressure.
Range-Bound Drift and Support Consolidation
From 04:15 UTC to 05:45 UTC, the $TRUMP price entered a tight consolidation phase, hovering just above the $8.95–$8.97 support zone. This zone repeatedly held price despite multiple downward wicks, signaling accumulation. During this stretch, MACD remained relatively flat, while RSI lingered around the midpoint, lacking any clear direction. This low-volatility environment hinted at indecision, but also stability around support. At 05:45 UTC, a golden cross on the MACD injected fresh optimism. The price gradually pivoted from a higher low and entered a new uptrend.
From 05:50 UTC to 07:30 UTC, the uptrend picked up pace. $TRUMP price pushed upward from $8.97, creating higher lows and breaching minor resistance levels, eventually touching $9.06 by 07:23 UTC. RSI briefly entered the overbought region, while MACD confirmed bullish strength. However, this upward push lacked volume strength and showed hesitation near the $9.07 mark, the day’s earlier high. Multiple rejections around that zone hinted at a strong resistance ceiling. The repeated failure to form a new higher high above $9.07 started weakening bullish momentum.
Rejection at Key Resistance Near $9.07
Between 07:30 UTC and 08:28 UTC, $TRUMP struggled to sustain its position above $9.05. After failing to break $9.07, sellers regained control, triggering a MACD death cross at 07:31 UTC. This marked the start of a moderate pullback, dragging the price back toward the $9.00–$9.02 region. While the dip didn’t break below support, the inability to register new highs suggested fading bullish strength. RSI cooled from overbought levels but remained above the midline, signaling mixed momentum. A higher low hasn’t formed yet, leaving the next move uncertain. Price is now sitting just above $9.00 as traders await confirmation.
Momentum Slows Near Resistance as Bulls Recalibrate
Trump Memecoin currently trades around $9.02, consolidating after a failed breakout above the $9.07 resistance. Momentum appears neutral to slightly fading. If buyers defend the $8.97–$9.00 support zone and form a higher low, another breakout attempt could follow. Immediate resistance lies at $9.05 and $9.07, with stronger barriers likely above $9.10. On the downside, key support remains at $8.97, followed by $8.95. MACD’s recent death cross and RSI’s retreat from overbought territory suggest caution, but not a full-on bearish reversal. Price projection leans neutral for now, with potential upside if bulls reclaim strength above $9.05.


