
Wanna buy TRUMP coin but don’t know where it’s going post-rally? If so, then this price action breakdown is for you. TRUMP price saw some big moves over the last 24 hours, with buyers driving the TRUMP price up before being bounced back. It’s now trading in a tight range and momentum is cooling off. With mixed signals in the indicators, it’s an important juncture to evaluate support, resistance, and trend strength. Without and more delay, let’s dive into what the chart is showing us.
TRUMP Price Analysis of September 13, 2025
TRUMP price action started with a converging triangle that established the day’s low of $8.91. That pattern broke up at 3:35 IST, supported by a golden cross of macd, propelling price into a prolonged $9.00 support – $9.10 resistance zone. The resistance eventually gave way to the upside at 02:25 IST with another golden cross, sparking a sharp rally. TRUMP initially spiked to $9.53, its daily high, then faded and encountered resistance at $9.50. If TRUMP clears this critical level it may run to $10.00, otherwise consolidation could rule before the next directional move.
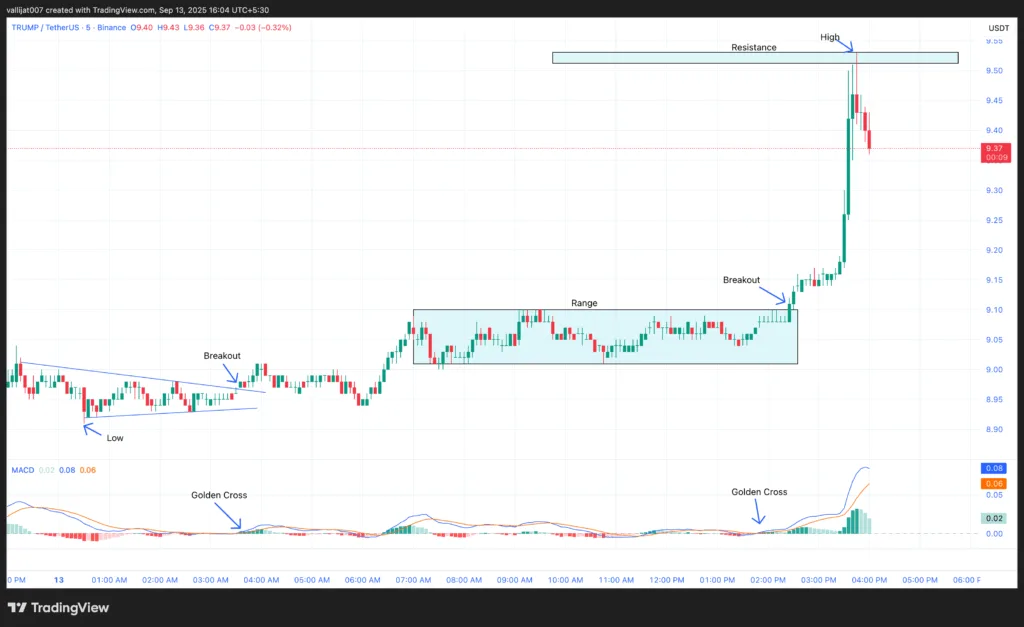
Chart 2: TRUMP/USDT M5 Chart, Analysed by Vallijat007, published on TradingView, September 13, 2025
TRUMP price converging triangle that held the days low of $8.91. Break out was at 03:35 IST to the up side supported by MACD golden cross. Price jumped and then created a lifetime trading range, with support at $9.00 and resistance at 9.10.
Resistance gave way to the upside at 02:25 IST after a golden cross of MACD. TRUMP price broke out with a strong surge to the upside and copyrighted the day’s high at $9.53. Once it finally made it over the high, price backed off some to the downside and established a resistance zone near $9.50. If TRUMP price breaks resistance at $9.50 then move up to $10.00. If resistance holds or breakout fails TRUMP price may consolidate for a while before going one way or the other.
Meanwhile at SEC Headquarters – Senate Regulator Paves TRUMP Token’s Runway
TRUMP token back on track after bipartisan Senate crypto rules plan Sep 2025 On Sept. 9, a dozen Senate democrats dropped a draft-style plan for digital asset regulations, igniting new bipartisan momentum for crypto legislation. This Democratic structure pairs with the Republican-sponsored Responsible Financial Innovation Act, which establish clear regulatory pathways that reduce the uncertainty for politically-minded cryptocurrencies.
Canary Capital’s trailblazing ETF filing for TRUMP token is the first try to bring a memecoin to mainstream markets. TRUMP Coin ETF to provide institutions with access to Solana-powered token — no custody needed This as Senate eyes integrating digital assets with traditional finance, potentially validating meme coins.
Technical indications suggest increasing investor interest in the face of widespread market volatility. TRUMP last traded near $8.90, with support in the $8.70-$8.80 range already having been established in August. The token exhibits neutral-bullish momentum with RSI at 52 and exponentials bunched near prices. Trading volume surged 36% to $395 million, indicating speculative positioning ahead of regulatory headwinds for politically-connected tokens.
TRUMP Focuses on $10.00 Senate Deal and ETF Rally
TRUMP’s recent rally underscores the force of technical and fundamental catalysts. Now with support up around $8.91 and resistance at $9.50, price sits in a cauldron zone where a breakout could open the door to upside toward $10.00. The shift is supported by cross-party Senate rules that offer a more defined path for politically-oriented tokens, minimizing regulatory ambiguity. And Canary Capital’s ETF filing also opens the door for institutional exposure to TRUMP, stoking the speculation even more. And although RSI and clustered EMAs indicate established momentum, additional advances require resolutely breaching $9.50 and sustaining volume overhead since recent levels in the face of increased regulatory scrutiny.
TRUMP Price Analysis of September 1, 2025
The TRUMP token price on 1 September 2025, traversed volatile yet bullish territory. The session opened with an upside breakout at 02:45 IST, supported by golden crossover of MACD, but the move lacked strength and soon slipped into a downward channel. A more serious downside breakout queued up at 07:20 IST, setting the low of the day at $8.34. Buyers took the reins again by 09:15 IST, igniting another rally. Momentum continued into a ragged upside spike at 11:25 IST, setting the day’s high at $9.24, where TRUMP coiled into a new range in anticipation of its next commanding breakout.
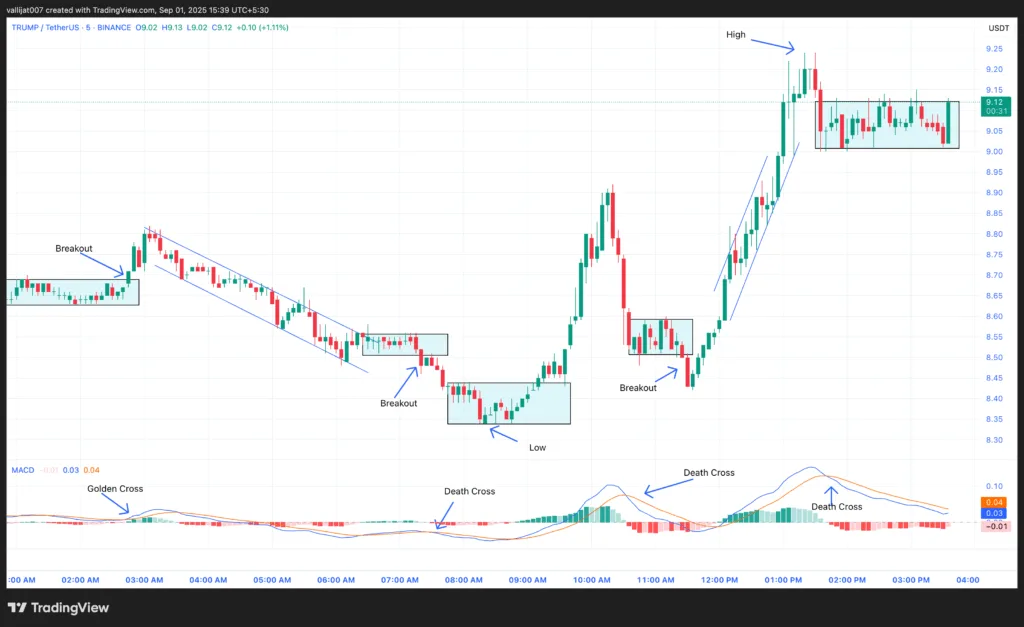
Chart 1: TRUMP/USDT M5 Chart, Analysed by Vallijat007, published on TradingView, September 1, 2025
The TRUMP price consolidated into a range. The range broke out to the upside at 0245 IST, backed by golden crossover of MACD. TRUMP price shot up to the upside, but momentum was feeble and price created a downward-sloping channel, dragging TRUMP price down. Price then formed another range.The range broke out to the downside at 0720 IST, aided by a death crossover of MACD. Price spiked to the downside and made the low of the day at $8.34.After tagging the low, the TRUMP price structured a range.
The range broke out to the upside at 0915 IST, aided by a golden crossover of MACD, and consolidated into another range.The range once more broke to the downside at 1125 IST, buttressed by a death crossover of MACD, but the downside breakout fizzled and the TRUMP price rocketed to the upside, setting the day’s high of $9.24.Following the high, the price again formed a range. If the range breaks out on the upside, then price could move to $10. If the range breaks to the downside, then TRUMP should fall to $8.
TRUMP Token Skyrockets on ETF Filing and Technical Resurgence
TRUMP token’s recent surge is a fascinating mix of institutional interest and technical momentum. Canary Capital’s ETF registration on August 14 was a breaking point, which was the initial official movement toward introducing a TRUMP token ETF to conventional markets. This filing with Delaware regulators, albeit preliminary, indicates increasing institutional appetite for memecoin exposure beyond incumbents Dogecoin and Shiba Inu.
Technical indicators are a cautiously optimistic picture with TRUMP trading at $9.07, well above its 7-day sma of $8.42 and 30-day ema of $8.88. Relative strength index in the mid-40s to 50, and MACD signals suggest upward momentum. Fibonacci retracement levels puts the next resistance target at $9.69, yet the 200-day SMA at $10.87 is still looming as a very daunting challenge.
Post-unlock stabilization seems to be setting in after July’s massive 50 million token dump that sent prices into a tailspin of 85%. The market appears to have digested this dilution shock, with diminished selling pressure leaving room for speculative buyers to poke back in.
But regulatory uncertainty remains as the SEC’s classification of memecoins remains unclassified and 73.5% of TRUMP’s total supply remains locked, providing future dilution risks that could threaten price appreciation persist.
TRUMP Token Meets Headwinds Near $10 as ETF Momentum
TRUMP’s trading between $8.34 and $9.24 represents a market trying to reconcile technical rebound with regulatory-fueled enthusiasm. Canary Capital’s ETF filing on August 14 has fed institution speculation, aligning TRUMP with memecoin front-runners Doge and Shiba. TRUMP at $9.07, sustaining above its 7-day SMA ($8.42) and 30-day EMA ($8.88). Resistance waits at $9.69 and the 200-day SMA ($10.87), which need to be breached for continued upside. Though diminished post-unlock selling bolsters bullishness, the token’s 73.5% locked supply and regulatory ambiguity are still material risks, likely placing a ceiling on near-term momentum despite institutional tailwinds.


