

TRON (TRX) is a decentralized blockchain platform that went online in 2017 and is aimed at allowing creators to have absolute control over their digital content by rewarding them directly, avoiding third parties. The platform can be used with smart contracts and decentralized applications (dApps) and has a high transaction speed (~2000 transactions per second), and there are no fees, which makes it a scalable alternative to Ethereum. We shall also use technical analysis of TRX price based on price action, Relative Strength Index (RSI), and Moving Average Convergence Divergence (MACD) to understand momentum and possible reversals in the pursuit of forming accurate entry and exit points in this dynamic market.
TRX Price Analysis of August 26, 2025
On August 26, 2025, TRON (TRX) opened with mixed momentum, initially forming a range that broke to the downside at 04:35 IST, supported by a death cross of MACD. TRX price then moved into a downward triangle before creating support at $0.3400. This support briefly failed at 06:25 IST, with TRX spiking to $0.3388 to mark the daily low. Buyers stepped in, pushing the price higher into a channel that evolved into a range. At 08:50 IST, a golden cross of MACD fueled a breakout to the upside, with TRX spiking to $0.3455 to set the high of the day before consolidating once more.
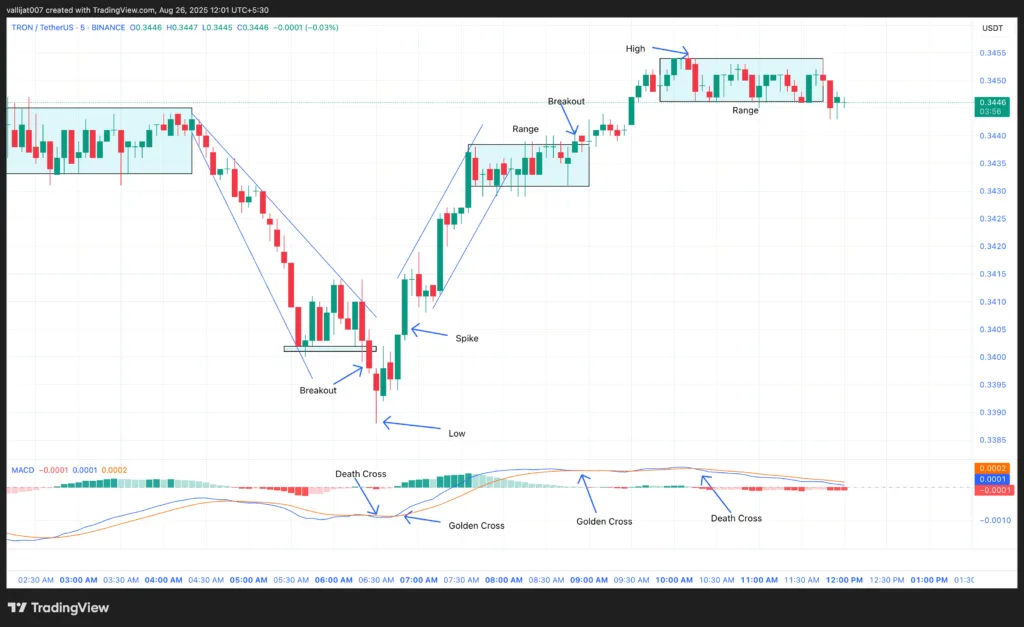
Chart 1: TRX/USDT M5 Chart, Analysed by Vallijat007, published on TradingView, August 26, 2025
- The TRX price formed a range, which broke out to the downside at 04:35 IST, supported by a death cross of MACD. Price then formed a downward-moving expanding triangle pattern. The pattern failed to break out to either side and created a support area at the level of $0.3400.
- The support broke to the downside at 06:25 IST, supported by a death cross of MACD. Price spiked to the downside, but the breakout failed. This move marked the low for the day at $0.3388.
- After marking the low, the TRX price spiked to the upside and formed a channel. The channel failed to break out to either side and developed into a range.
- The range broke out to the upside at 08:50 IST, supported by a golden cross of MACD. Price spiked to the upside and marked the high for the day at $0.3455.
- After marking the high, the price formed another range. If the range breaks out to the upside, price may rise to the level of $0.3500. If the range breaks out to the downside, the price may drop to the level of $0.3300.
TRON Slips Amid Martha Price Rotation and Selling Pressure
TRON (TRX) has slipped noticeably as bearish momentum has weighed across the broader crypto market. With a drop of over three percent in the past twenty-four hours, TRX underperformed Bitcoin and mirrored losses from other altcoins such as Ethereum and Solana. The move comes during a period of risk-off sentiment with Bitcoin dominance climbing above fifty-seven percent, reflecting a decisive shift away from smaller assets.
A key factor behind TRX’s decline is active profit-taking. Short-term holders who entered during recent rallies are cashing in as gains ranged from moderate to high across one-week and three-month timeframes. This has created significant selling pressure, which coincided with a spike in trading volume, suggesting that the rally was met with aggressive exits. Long-term selling activity reported earlier in August further amplified this cooling momentum.
On the technical front, TRX struggled above the critical Fibonacci retracement level near thirty-five cents and quickly retreated. Indicators such as a negative MACD histogram and cooling RSI readings imply that momentum is fading, while the fifty-day simple moving average at thirty-four cents remains the key support zone. A breakdown may open the path toward thirty-three cents if sentiment continues weakening.
TRON Faces Pressure at Key Levels:
TRX’s technical structure reflects the market’s indecision, with the token trading between critical support and resistance. The $0.3455 high highlights short-term upside resistance, while the $0.3388 low underscores the vulnerability of its support base. If the current range breaks to the upside, TRX could retest $0.3500, a level aligned with its Fibonacci resistance. However, failure to hold $0.3400 may expose the TRX price to a drop toward $0.3300. With selling pressure from profit-taking and broader market rotation into Bitcoin, TRX remains under pressure, and traders are closely watching whether $0.34 can hold as a pivot.


