

Are you looking forward to buying Trust Wallet Token (TWT) and want to be assured with detailed price action analysis? Then, this price analysis is for you. TWT has seen some interesting price movement over the past day, especially with its strong breakout above a key resistance level. After a period of sideways swings, bulls have stepped back in and reclaimed control. The momentum looks promising, but the market is still testing its strength near the upper levels. Let’s take a closer look at what the price chart and indicators are revealing.
TWT Price Analysis of 10th May, 2025
The TWT price action over the last 24 hours shows a wide-ranging movement that began with high volatility and transitioned into structured trend phases. After the previous day’s bullish momentum, the price initially entered a choppy range between $0.8350 and $0.8550. From 06:00 UTC to 09:00 UTC, Trust Wallet Token surged to a high of $0.8611 before sharply pulling back to $0.8348, revealing short-term profit-taking and rejection near overbought RSI levels. MACD during this period printed a death cross around 08:45 UTC, aligning with the subsequent decline. RSI signaled an overbought condition just before this peak, reinforcing the short-term correction setup.
Chart 1- TWT/USDT M5 Chart, Analyzed by Alokkp0608, published on May 10th, 2025.

From 09:00 UTC to 18:00 UTC, the TWT price entered a large sideways path, oscillating between the $0.8350 support and $0.8550 resistance zones. Although several attempts were made to break the range, momentum remained mixed, and no decisive trend emerged. MACD showed alternating golden and death crosses but lacked strong follow-through, signaling indecision. RSI stayed mostly neutral during this stretch, with no significant dips or spikes. Buyers showed interest near the lower boundary, but broader conviction was missing until later in the day. This phase essentially acted as a reset for both momentum and structure before the next move.
TWT Breakout Fuels Short-Term Bullish Momentum
Between 18:00 UTC and 00:00 UTC, TWT transitioned from range-bound behavior into a structured uptrend. Price carved a shallow ascending channel, testing the resistance near $0.8550 multiple times. A confirmed breakout occurred at 23:45 UTC, which led to a sharp spike to $0.8740 within 35 minutes. This move coincided with an RSI overbought reading and a clear MACD golden cross, which reflected rising bullish momentum. The breakout invalidated the prior resistance and converted it into short-term support. The price behavior during this stretch highlighted strong buyer conviction, likely driven by intraday accumulation around $0.8500–$0.8550.
Following the TWT breakout peak at 00:20 UTC, the momentum cooled. From 00:00 UTC to 06:00 UTC, the price retraced below the newly formed support zone but did not break below $0.8500 for long. TWT quickly rebounded and reclaimed the $0.8550 level by around 05:00 UTC. During this cooling phase, RSI again reached overbought territory before slipping back, while MACD recorded a death cross followed by another golden cross, illustrating short-term volatility but with underlying bullish bias intact. This behavior shows that buyers remained active even during pullbacks, defending higher lows within the new trading zone.
TWT Consolidation Near Resistance After Breakout
In the final visible hour approaching 07:00 UTC, TWT traded mostly sideways just above the $0.8550 level, hovering around $0.8630. RSI was modestly elevated, signaling healthy consolidation rather than exhaustion. MACD turned positive again with another golden cross, indicating potential readiness for the next push higher. The consolidation appeared orderly, with no sharp selloffs or volume spikes. This phase may represent a base-building effort above the prior resistance, which now acts as support. Buyers are likely watching for a TWT breakout above $0.8700 to confirm further upside, while sellers may target $0.8500 as the breakdown threshold.
Momentum Builds as Bulls Defend Key Support Zone
TWT price is showing constructive bullish behavior, consolidating above prior resistance at $0.8550 after a breakout-led rally. Momentum remains moderately bullish with a potential for extension toward $0.8750–$0.8800, provided buyers maintain pressure. Immediate support lies between $0.8500 and $0.8550, while stronger support is at $0.8350. RSI has cooled from overbought levels, now suggesting room for further upside. MACD remains in bullish alignment with the latest golden cross, reinforcing a continuation scenario. While short-term volatility persists, the structure leans bullish as long as TWT stays above $0.8550 with increasing volume on upward pushes.
Trust Wallet Token (TWT) Price Analysis of May 15th, 2025
The TWT price action over the last 24 hours shows a gradual bearish transition after a period of sideways movement. Starting with a minor downtrend, the token dropped from the previous day’s high and entered a defined sideways channel between $0.8950 and $0.8727. This trading range persisted for several hours before a brief decline occurred around 17:00 UTC. Notably, this drop did not establish a clear trend reversal. RSI hovered near neutral for most of the sideways phase, briefly spiking into overbought territory, suggesting minor speculative buying rather than strong momentum.
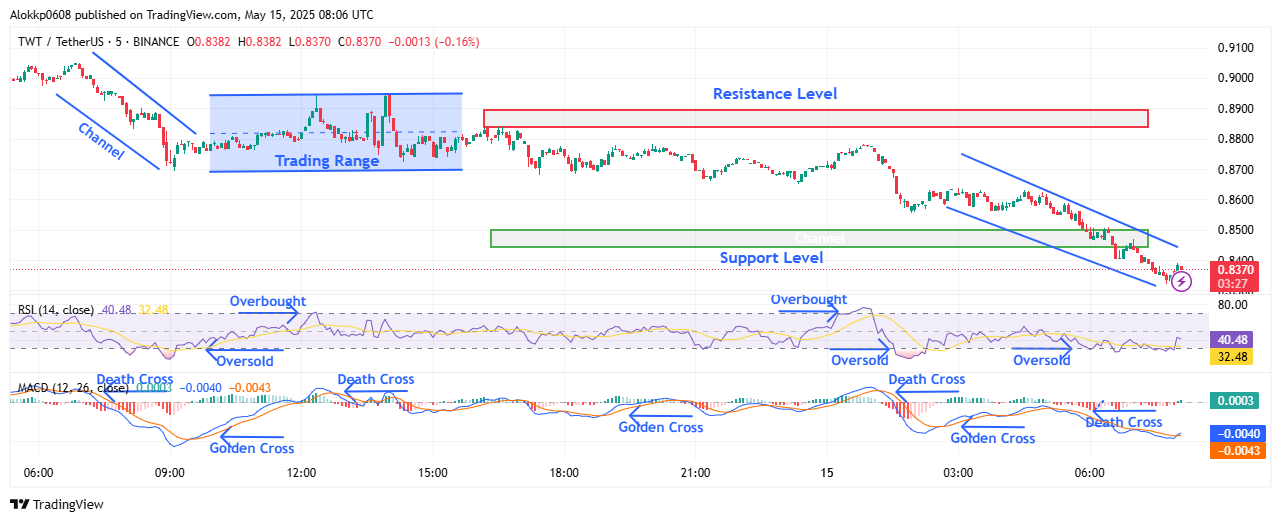
By late evening UTC, TWT price resumed flat trading, but with lower highs, a sign of buyer fatigue. Around 00:50 UTC on May 15, the price began a sharp descent, breaking the key TWT support zone near $0.8500. This downward move marked the exit from the previous sideways channel into a steeper bearish channel. MACD confirmed this with a death cross shortly after the breakdown, while RSI entered oversold territory. Sellers gained dominance as the price slipped deeper below the support level, indicating weakening sentiment across short-term traders.
Bears Take Control After Sideways Drift
The fresh downward channel formed during the early hours of May 15 shows sustained selling pressure. The price fell from around $0.8600 to $0.8370, with no significant bullish attempts to break the new descending structure. TWT Support from the prior $0.8500 level now acts as a psychological ceiling. Multiple MACD death crosses within this decline confirmed strong bearish momentum, with no bullish divergence detected so far. RSI repeatedly touched the oversold line but lacked a convincing bounce, reflecting low conviction from buyers even at discounted levels.
Despite this weakness, the Trust Wallet Token briefly hovered near the lower trendline of the descending channel around 07:30 UTC, hinting at potential short-term exhaustion among sellers. However, the failure to climb meaningfully above $0.8400 indicates strong resistance ahead. The lack of volume-driven recovery reinforces the bearish narrative. At the time of the latest price point, TWT trades near $0.8370, with buyers showing hesitation and momentum indicators still leaning downward. The price remains well below the established resistance of $0.8900.
Pressure Builds Near Channel Support
The TWT price momentum currently favors bears as it consolidates near the bottom of a declining price channel. Unless a bullish MACD crossover or RSI rebound confirms a reversal, the token risks retesting lower support levels near $0.8300. The previous intraday TWT support zone of $0.8500 now acts as overhead resistance, with selling pressure expected around that range. A decisive close above $0.8550 could indicate relief, but as long as MACD lines stay below the baseline and RSI hovers under 40, recovery attempts may stall early.
Outlook: Bearish Momentum Stretches TWT Below Key $0.8500 Support
Trust Wallet Token trend remains bearish after breaching the $0.8500 support and forming a steep downtrend. Momentum shows no signs of reversal, with RSI hovering around 32 and MACD showing a fresh death cross. As sellers maintain control, the price could retest $0.8300 or lower unless a clear bullish signal emerges. Resistance lies between $0.8550 and $0.8600, with stronger walls at $0.8900. A recovery is unlikely without MACD flattening and RSI reclaiming 45+. Until then, downside risk persists as TWT consolidates at a vulnerable position.
Trust Wallet Token (TWT) Price Analysis of June 11th, 2025
The TWT price action today shows early weakness followed by prolonged range-bound movement and a bearish continuation. The session opened with a drop from the $0.8435 resistance zone and quickly broke below the $0.8380 support by 00:54 UTC. This created a clear lower low (LL), followed by a weak recovery attempt from $0.8344. The MACD issued a death cross at 00:07 UTC, supporting the early selloff. RSI briefly dipped into oversold territory before bouncing. A golden cross at 01:32 UTC sparked a minor rally, but resistance at $0.8390 capped gains. A lower high (LH) formed there, maintaining the bearish tone.
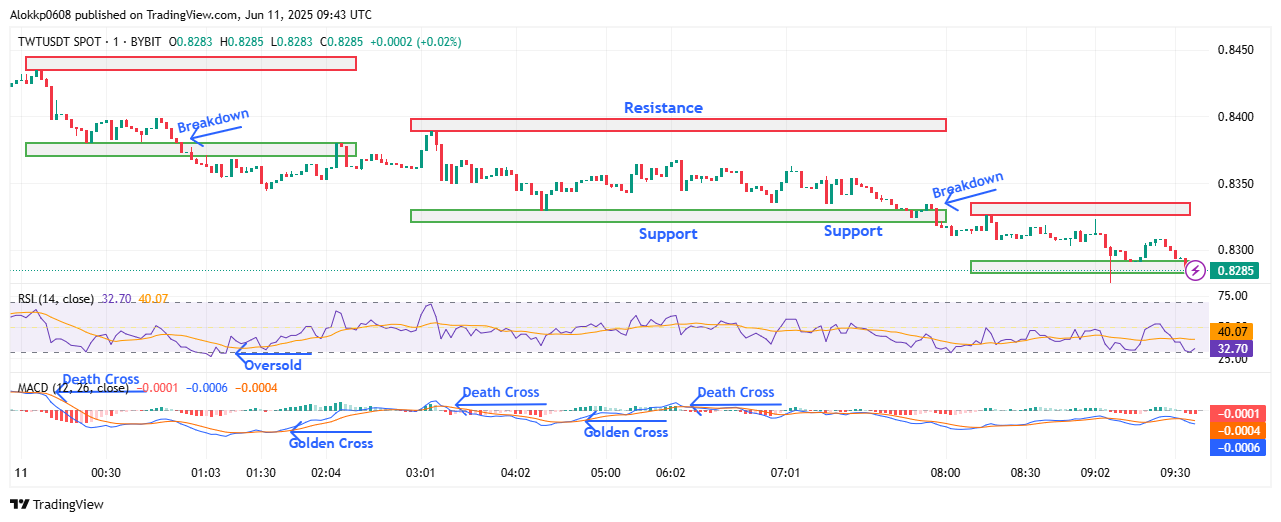
TWT/USDT M-1 Chart, Analyzed by Alokkp0608, published on June 11th, 2025.
From 03:00 UTC to 07:00 UTC, the TWT price action turned sideways inside a narrow channel between $0.8330 and $0.8390, establishing both support and resistance. Despite a brief rally to test the upper boundary at 03:05 UTC, the price quickly reversed following a MACD death cross at 03:09 UTC. The subsequent move to $0.8336 created a short-term HL but lacked bullish conviction. Another MACD golden cross at 04:17 UTC tried to lift momentum, but price remained boxed in. RSI oscillated in the mid-range, neither signaling strength nor exhaustion. This indecision foreshadowed the breakdown that came later in the day.
TWT Breakdown From Support and Return to Downtrend
Between 07:00 UTC and 08:30 UTC, Trust Wallet Token finally broke below its support zone at $0.8330, confirming bearish continuation. The breakdown at 07:57 UTC pushed the price down to $0.8290, where a new support level was formed. The structure clearly printed a fresh LL, cementing the descending trendline. MACD printed another death cross at 06:06 UTC, and RSI began to fall again toward the 30 level, signaling renewed bearish momentum. Any bullish setups failed to materialize, and sellers regained control. Minor consolidation followed the breakdown, but without meaningful bullish divergence or volume support.
From 08:30 UTC to the end of the chart at 09:42 UTC, the TWT price fluctuated between the new $0.8290 support and $0.8325 resistance, both established after the earlier breakdown. This range represents a continuation of the descending channel. Attempts to break above $0.8320 were rejected quickly, confirming it as a short-term LH. MACD stayed below the zero line, and RSI hovered near 32, showing the lack of recovery strength. No bullish divergence was visible, and sellers defended even shallow rallies. The structure showed consistent LHs and LLs, which reinforces the active downtrend heading into the next session.
Rejection at Key Resistance Zone Near $0.8325
The latest price rejection near $0.8325 shows a clear lack of bullish follow-through. This resistance aligned with prior breakdown levels and held strong despite multiple price tests. TWT showed a series of LHs leading into this rejection, and the MACD stayed negative throughout, with histogram bars flattening rather than expanding. RSI hovered between 30–40 without signs of snapping back, suggesting weak demand. The small rally attempts remained capped by tight supply near the RL, with no effort strong enough to push the price back toward the earlier $0.8390 highs. The market remains vulnerable to further downside unless buyers reclaim key zones.
Bearish Pressure Mounts With Weak Momentum and Support Retest
The trend remains decisively bearish heading into the next session, with Trust Wallet Token settling near $0.8285. Momentum continues to fade, with no strong bullish signals on either RSI or MACD. Short-term projection leans toward a possible breakdown of $0.8290, which could open the door to test deeper levels like $0.8250 or even $0.8220. To the upside, resistance remains firm at $0.8325, with a more critical ceiling near $0.8390. MACD is trending negative, with multiple recent death crosses. RSI is weak but not yet rebounding, suggesting limited bullish fuel. As long as TWT stays below $0.8325, bears remain in control for June 11’s trading window.
Trust Wallet Token (TWT) Price Analysis of June 16th, 2025
The TWT price action today shows a mix of downtrends, consolidations, and breakout moves that define multiple shifts in short-term structure. The session began in a moderate downtrend, with prices moving from around $0.778 toward the support level at $0.7725. Selling continued until a reversal emerged at 01:15 UTC when TWT bounced sharply. A golden cross on the MACD around 01:37 UTC aligned with an uptrend breakout, driving a move above the resistance level of $0.7820. This breakout peaked near $0.7842 by 02:13 UTC, followed by a slowdown as prices entered consolidation just under the new high.
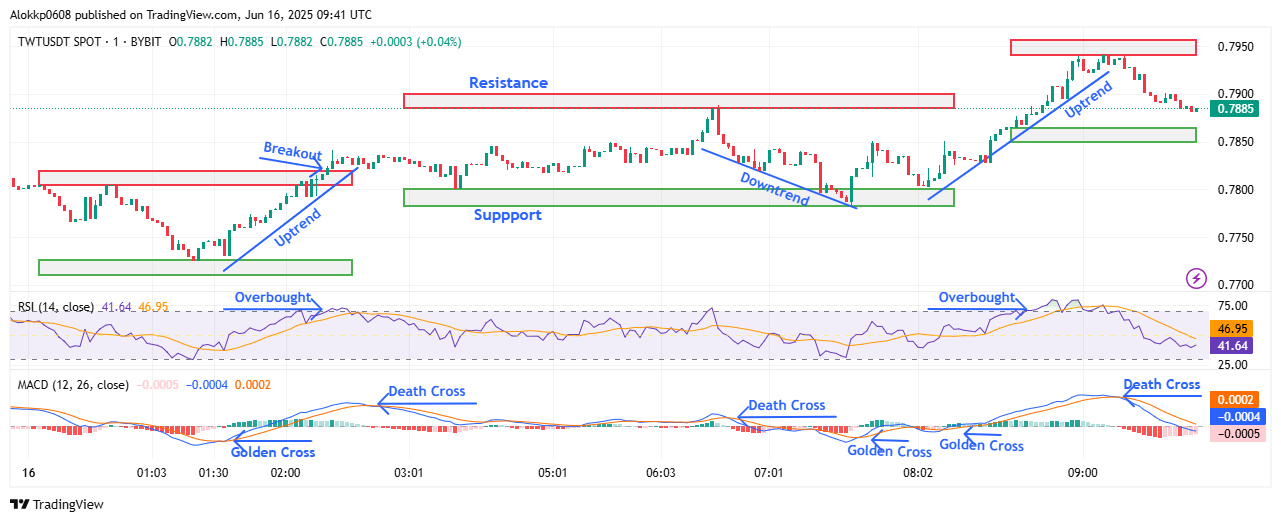
TWT/USDT M-1 Chart, Analyzed by Alokkp0608, published on June 16th, 2025.
Between 02:15 UTC and 06:30 UTC, Trust Wallet Token mostly ranged within a newly defined support zone at $0.7800 and resistance near $0.7885. The earlier bullish momentum faded after a MACD death cross at 02:42 UTC, and prices flattened without fresh higher highs or lower lows. RSI backed this neutral phase, holding mid-range levels without reaching either overbought or oversold zones. This stretch produced overlapping candles with no directional dominance, keeping traders cautious. Even though price attempted brief lifts toward the upper resistance, sellers quickly absorbed the moves, keeping TWT in a sideways path until a renewed push started taking shape around 06:30 UTC.
Failed Breakout and Downward Drift Below Midrange
Between 06:30 UTC and 07:40 UTC, bulls made another push from $0.7844, reaching $0.7885 by 06:41 UTC. However, price failed to break through the ceiling, and rejection followed almost immediately. The MACD issued another death cross at 06:43 UTC, and TWT rolled over into a brief downtrend. The next leg down broke below the $0.7800 support by 07:35 UTC, printing a lower low and marking a bearish shift. Still, the drop lacked conviction, and by 07:38 UTC, a MACD golden cross signaled early signs of reversal. RSI dipped toward 40 but avoided a full oversold signal, showing buyers were preparing for another attempt.
Recovery Rally Reclaims Lost Ground
From 07:40 UTC to 09:09 UTC, the TWT price formed a new HL around $0.782 and climbed steadily. MACD flipped bullish again with a golden cross at 08:13 UTC, and a clear uptrend took shape. Price carved out higher highs and higher lows, advancing to a new peak near $0.7940, establishing a fresh resistance level. RSI entered the overbought zone briefly during this rally, confirming strength. After hovering near this top range between 08:59 UTC and 09:09 UTC, momentum began to slow. Candles grew smaller, and buyers struggled to extend gains beyond $0.794. This plateau hinted at a possible exhaustion near the upper band.
Rejection at Resistance and Shift in Momentum
Following the 09:10 UTC candle, the TWT price started to pull back from the $0.7940 high. A MACD death cross occurred at that moment, marking the end of the bullish push. The price slid back toward $0.7885 and continued to test support without forming new highs. This move brought a lower high into play and shifted momentum to neutral-to-bearish. RSI sharply dropped from overbought toward the midline, reflecting fading buyer interest. The price remained above the $0.7865 support zone but lost the upward thrust it held earlier. If bulls fail to reclaim $0.792 or higher, short-term control may flip back to sellers.
TWT Price Faces Resistance at $0.7940 as Bulls Lose Momentum
Trust Wallet Token’s short-term structure shows fading bullish momentum after failing to hold above $0.7940. While the earlier rally created a clean sequence of HHs and HLs, the recent rejection and MACD death cross suggest a shift to neutral or mild bearish pressure. Support levels to watch are $0.7865 and $0.7800, while resistance remains firm at $0.7940 and earlier at $0.7885. RSI is heading downward from overbought, hinting at further cooling. Unless price reclaims the upper band quickly, TWT may consolidate or drift lower.


