

If you want to invest in or buy Uniswap and wonder what the right price to start accumulating Uniswap is, then you are at the right place. As we go through the analysis, we will determine different patterns and how Uniswap reacts to them. We will also see support and resistance, which is a good area for any instrument to buy or sell. Without any further delay, let’s dive into the Uniswap price analysis and explore different opportunities arising from it.
Uniswap (UNI) Price Analysis of May 22, 2025
Uniswap price demonstrated clear bullish momentum during the session, beginning with a recovery from the session low at $6.204. A series of bullish UNI breakouts from successive ranges, supported by golden MACD crossovers, confirmed strong buying interest. Price climbed steadily, forming upward and downward channels along the way, with each pullback being met by renewed upside pressure. Despite multiple overbought RSI signals suggesting temporary exhaustion, the UNI price continued pushing higher, eventually marking the high of the day at $6.484 before settling into a consolidation range.
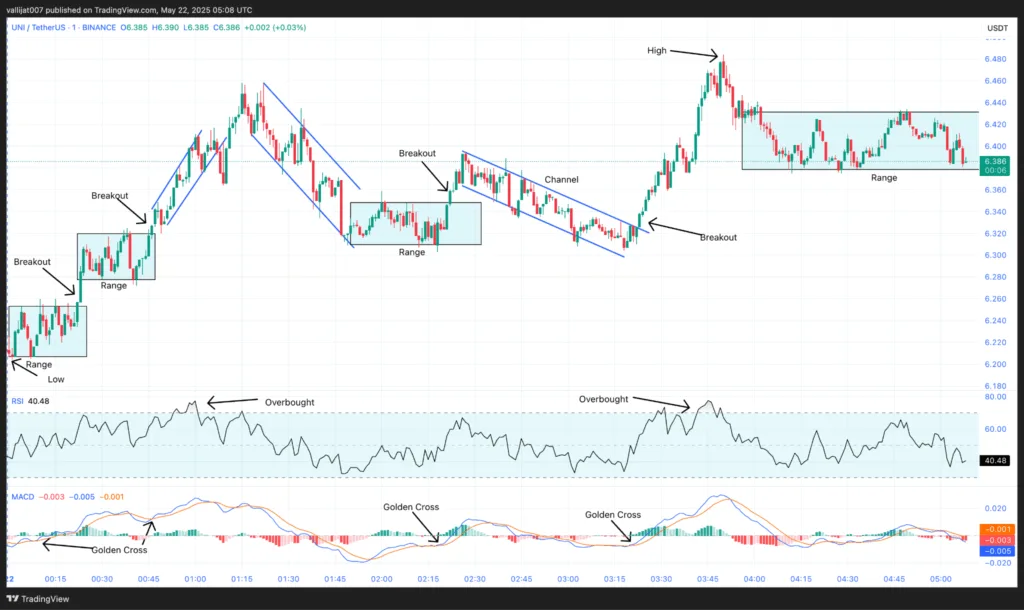
Chart 1: UNI/USDT M1 Chart, Analysed by vallijat007, published on TradingView, May 22, 2025
After marking the low for the day at $6.204, UNI formed a range. The range broke out to the upside at 00:22 UTC, supported by a golden crossover of MACD. The Uniswap price moved to the upside and formed another range. The second range again broke out to the upside at 00:46 UTC, supported by a golden crossover of MACD. Price spiked to the upside and formed an upward-moving channel. In the meantime, at 01:00 UTC, RSI moved above the level of 70, indicating overbought market conditions, suggesting at least a pullback.
Golden Cross Rally, UNI Challenges $6.50 Resistance
A downward-moving channel appeared in the Uniswap price, which failed to break out to either side, and the pattern evolved into a trading range. The trading range broke out to the upside at 02:22 UTC, supported by a golden crossover of MACD. Price spiked to the upside and formed a downward-moving channel. The downward-moving channel broke out to the upside at 03:23 UTC, supported by a golden crossover of MACD. Price spiked to the upside, marking the high for the day at $6.484.
In the meantime, at 03:43 UTC, RSI moved above the level of 70, indicating overbought market conditions, suggesting a reversal or at least a pullback. After marking the high, the price formed a trading range. If the range breaks out to the upside, then the price may rise to the level of $7.000. If the range breaks out to the downside, then the price may drop to the level of $6.000. Uniswap price patterns show an upward-moving channel in the higher timeframe. Traders and investors should be cautious before placing any trade, as Uniswap is trading near its resistance area.
UNI Maintains Bullish Momentum, Eyes Key Breakout Levels
The UNI price remains in an upward trend with strong structural support from MACD and price action. While overbought RSI results warn of short-term declines, the Uniswap price still looks bullish in the long run. The trading range could trigger a directional move to either side. If the price breaks out of the UNI range, it is likely to keep rising to around $7.000. Conversely, a downside breakout could bring the price back down to $6.000. So long as the trend is in place, traders should wait for breakout confirmation before risking that trade. Traders should be careful as the price approaches the resistance level.
Uniswap (UNI) Price Analysis of May 26, 2025
Uniswap price action during the session was dominated by a series of technical breakouts, reflecting a battle between momentum surges and pullbacks. The day started with a downward-moving channel, establishing the low at $6.111 before a golden MACD crossover sparked a rally. UNI price advanced through several formations, channels, ranges, and an expanding triangle, interspersed with frequent MACD crossovers and RSI readings oscillating between overbought and oversold. Despite the volatility, the UNI price eventually pushed to the session high of $6.586, riding an upward-moving channel.
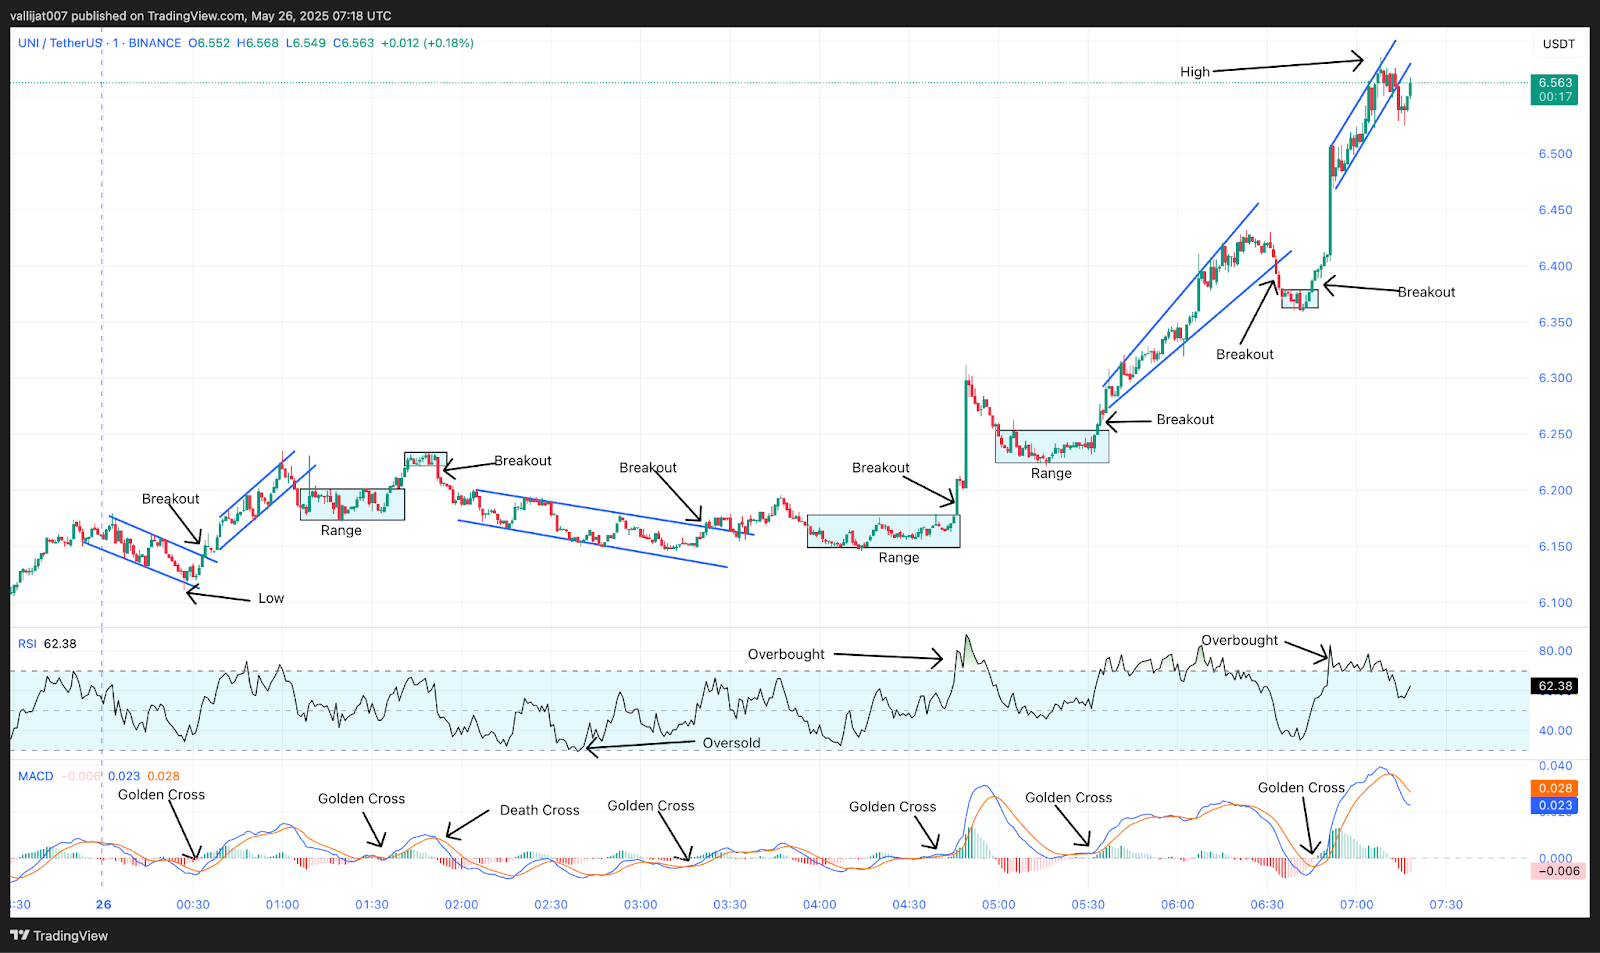
Chart 2: Uniswap/USDT M1 Chart, Analysed by vallijat007, published on TradingView, May 26, 2025
A downward-moving channel appeared in the Uniswap price, which marked the low for the day at $6.111. The downward-moving channel broke out to the upside at 00:34 UTC, supported by a golden crossover of MACD, and the Uniswap price spiked to the upside, forming an upward-moving channel. The channel broke out to the downside at 01:04 UTC, supported by a death crossover of MACD, and a range followed. The range broke out to the upside at 01:36 UTC, supported by a golden crossover of MACD, forming a minor range.
Overbought RSI Warns of Potential Pullback
The minor range broke out to the downside at 01:52 UTC, supported by a death crossover of MACD, and a downward moving channel formed. In the meantime, at 02:40 UTC, RSI dropped below the level of 30, indicating oversold market conditions, suggesting a reversal or at least a pullback. The downward-moving channel broke out to the upside at 03:22 UTC, supported by a golden crossover of MACD, but failed to sustain a trend, and another range followed.
The range broke out to the upside at 04:46 UTC, supported by a golden crossover of MACD, pushing RSI above 70, suggesting a reversal or at least a pullback. A range followed in the form of a pullback. This range broke out to the upside at 05:33 UTC, supported by a golden crossover of MACD, and formed an expanding triangle pattern. In the meantime, at 06:10 UTC, RSI moved above the level of 70 again, indicating a reversal or at least a pullback.
The expanding triangle pattern broke out to the downside at 06:33 UTC, supported by a death crossover of MACD, and a minor range formed. The minor range broke out to the upside at 06:45 UTC, supported by a golden crossover of MACD, forming an upward moving channel that marked the high for the day at $6.586. If the breakout succeeds, the price may rise to $7.000. If the breakout fails, the Uniswap price may drop to $6.000.
Uniswap Approaches Key Inflexion, Watch for Confirmation
Uniswap coin’s current upward breakout has brought it to the high of the day, but sustained momentum remains uncertain. Multiple golden MACD crossovers and overbought RSI signals suggest bullish interest but also a market prone to rapid reversals. If the breakout above $6.586 holds, Uniswap may target the $7.000 mark next. However, a failed breakout could trigger a sharp drop back toward the $6.000 support zone. With volatility elevated and indicators flashing mixed signals, traders should wait for a confirmed move before committing to directional trades. Tight risk management is essential in this volatile environment.
Uniswap (UNI) Price Analysis of May 31, 2025
The Uniswap token opened the session with an early attempt to reclaim bullish momentum, briefly pushing higher before forming a downward-moving channel. Although bullish MACD crossovers supported initial breakouts, they failed to deliver sustained upside moves. Each upward attempt quickly reversed, establishing new resistance levels. As the session progressed, Uniswap price action became increasingly choppy, with the RSI signaling both overbought and oversold extremes in rapid succession. Momentum cues were often short-lived, and most breakouts reverted into sideways ranges or opposing moves, pointing to trader uncertainty and lack of conviction.
Chart 3: UNI/USDT M1 Chart, Analysed by vallijat007, published on TradingView, May 31, 2025
The Uniswap price marked the high for the day at $6.229 and formed a downward-moving channel. The channel broke out to the upside at 00:21 UTC, supported by a golden crossover of MACD. However, the breakout failed to establish an uptrend and instead created a resistance level at $6.145. The Uniswap price broke this resistance to the upside at 00:38 UTC, supported by a golden crossover of MACD, but the breakout again failed, and the price dropped sideways, forming a range.
Death Cross Dominance Establishes $5.888 Low
In the meantime, at 01:05 UTC, RSI dropped below the level of 30, indicating oversold market conditions and suggesting a reversal or at least a pullback. The range broke out to the downside at 01:25 UTC, supported by a death crossover of MACD, and formed a downward-moving channel. The channel broke out to the upside at 02:06 UTC, supported by a golden crossover of MACD, and formed a range. The range broke out to the downside at 02:28 UTC, supported by a death crossover of MACD, and formed another range.
The next range broke out to the upside at 03:45 UTC, supported by a golden crossover of MACD, but the breakout failed to gain momentum, and another range followed. That range broke out to the downside at 04:01 UTC, supported by a death crossover of MACD, and formed yet another range. This final range broke out to the downside at 04:16 UTC, supported by a death crossover of MACD, marking the low for the day at $5.888.
After marking the low, the UNI price spiked to the upside and formed a range. In the meantime, at 04:25 UTC, RSI moved above the level of 70, indicating overbought market conditions and suggesting a reversal or at least a pullback. The range broke out to the downside at 05:15 UTC, supported by a death crossover of MACD. If the breakout succeeds, the Uniswap price may drop to the level of $5.500. If the breakout fails, the UNI price may rise to the level of $6.500.
Bearish Pressure Remains Despite Volatile Rebounds
The Uniswap price action indicates a hesitant market marked by several failed attempts to maintain upward or downward breakouts. Though MACD crossovers still offer technical signals, these cues have mostly failed to produce solid directional follow-through. The repeated RSI dips below and surges above critical levels suggest reactive trading rather than trend-based movement. Until a clean breakout above resistance or a breakdown below support occurs with momentum confirmation, the Uniswap token is likely to remain stuck in a volatile, range-bound structure. Traders should stay cautious and avoid chasing moves without confirmation.
Uniswap (UNI) Price Analysis June 4, 2025
Uniswap price showed strong bullish intent throughout the trading session, with price action largely favoring upside breakouts. The day began with an upward-moving channel that briefly reversed before marking the low of the day at $6.282. A golden MACD crossover triggered a strong rebound, and UNI surged into a new upward channel. Subsequent downside breakouts repeatedly failed to sustain, while upside breakouts, especially during the afternoon session, successfully carried UNI price action higher. A range breakout in the late session sent UNI to its daily high of $7.114, indicating clear buying interest and bullish momentum as the market rejected downside continuation. Uniswap price is currently trading at $6.700.
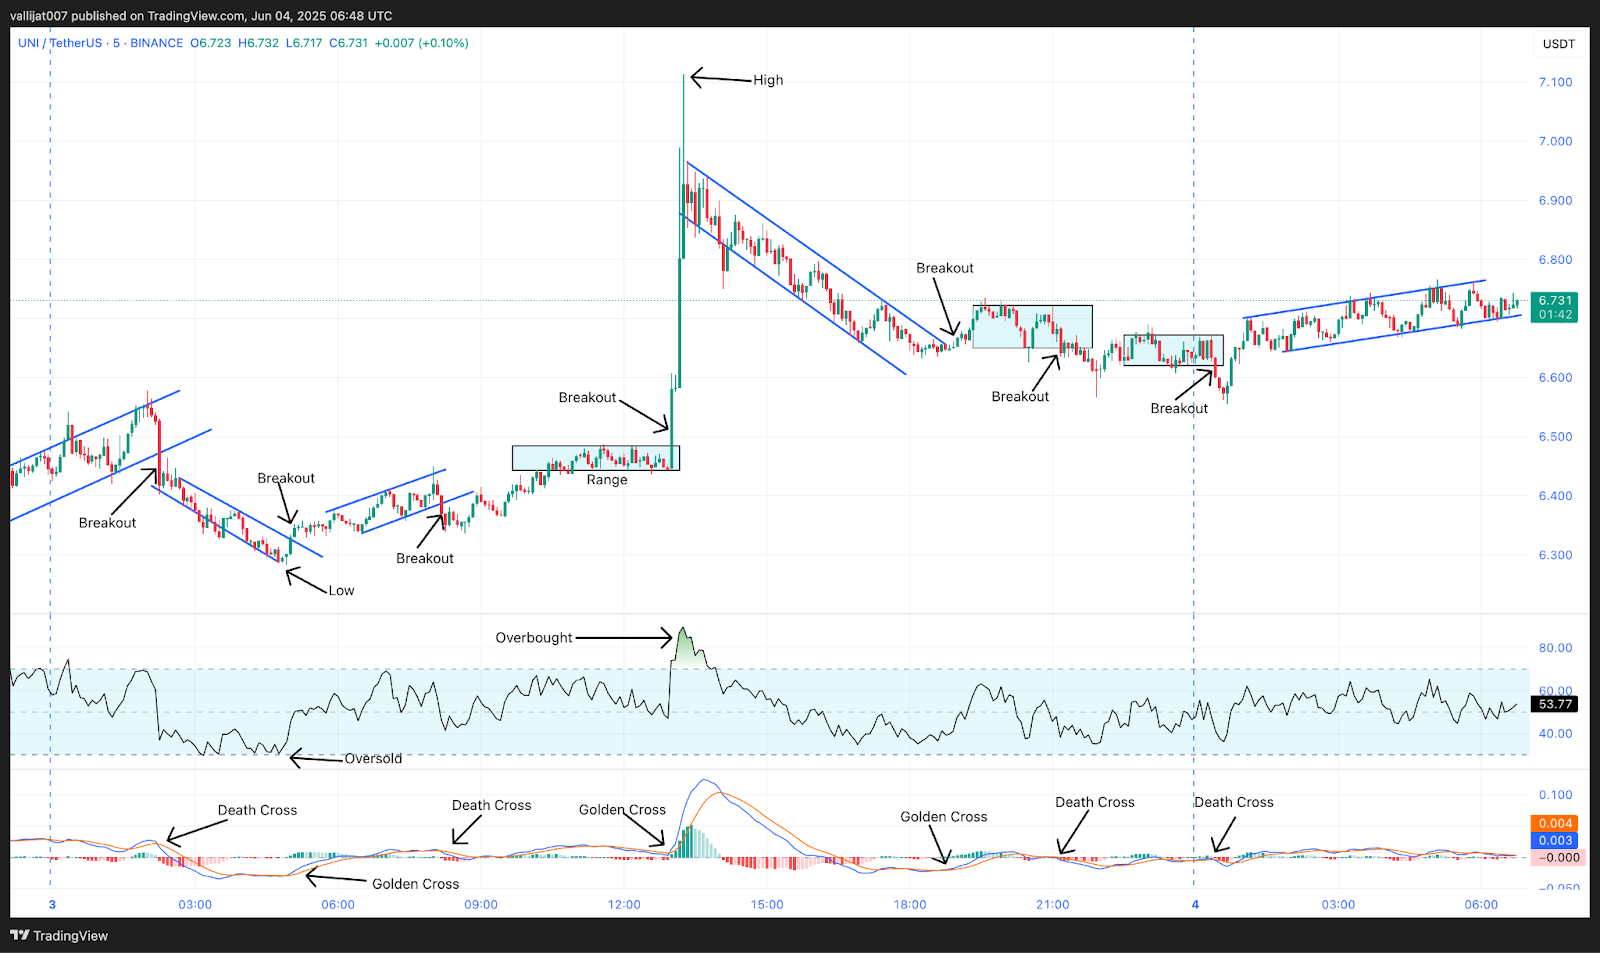
Chart 4: UNI/USDT M5 Chart, Analysed by vallijat007, published on TradingView, June 4, 2025
The Uniswap price formed an upward-moving channel. The upward-moving channel broke out to the downside at 02:15 UTC, supported by a death crossover of MACD. The price moved lower and formed a downward-moving channel. This downward channel marked the low for the day at $6.282. The downward-moving channel broke out to the upside at 05:05 UTC, supported by a golden crossover of MACD. The price climbed and formed an upward-moving channel. The upward channel broke out to the downside at 08:10 UTC, supported by a death crossover of MACD, but the downside Uniswap breakout failed, and the price rose again, forming a range.
Upward Channel Signals Potential $7.500 Target
The range broke out to the upside at 13:00 UTC, supported by a golden crossover of MACD. The price formed a downward-moving channel. At 13:10 UTC, RSI moved above the level of 70, indicating overbought market conditions, suggesting a reversal or at least a pullback. The spike from the breakout marked the high for the day at $7.114. The downward-moving channel broke out to the upside at 19:00 UTC, supported by a golden crossover of MACD, but the upside breakout soon faded, and the price formed a range.
The range broke out to the downside at 21:10 UTC, supported by a death crossover of MACD, but the downside trend did not sustain, and the Uniswap price formed another range. The second range broke out to the downside at 00:25 UTC on 4th June 2025, but the downside breakout again failed, and the UNI price rose to the upside, forming an upward-moving channel.
If the upward-moving channel breaks out to the upside, the price might increase to the level of $7.500. If the upward channel breaches to the downside, the price may fall to the $6.000 level. The UNI price action shows a trending behavior, with most of the upside breakouts succeeding in reaching their target price, while downside breakouts failed to sustain. This indicates strong bullish momentum. Traders and investors should be cautious before placing a downward Uniswap breakout trade, as UNI shows clear strength to the upside.
Bullish Strength Holds Despite Volatility
Uniswap price action displayed a classic case of bullish dominance. Despite several pullbacks and bearish setups signaled by death crossovers, the market consistently rejected lower levels. The most significant takeaway is the failure of downside breakouts to hold, which underlines strong support from buyers at each dip. Conversely, upside breakouts reached their targets, reinforcing the strength of bullish sentiment. With the price currently consolidating in an upward-moving channel, traders should watch for a breakout direction. If UNI breaks to the upside, further gains may follow. However, a downside move could test deeper support before any recovery.
Uniswap (UNI) Price Analysis of June 10, 2025
Uniswap token started the day with a bearish tone, forming a downward channel that marked the low at $6.831. A golden crossover of MACD at 00:09 UTC triggered an upside breakout, initiating a volatile stretch marked by alternating trends and frequent RSI extremes. Within hours, Uniswap price action cycled through multiple channels and ranges, with both overbought and oversold RSI readings flagging potential reversals. Despite upward momentum, breakouts lacked conviction. UNI eventually peaked at $7.247, but upside pressure couldn’t hold. As the session progressed, trend formations and MACD signals suggested indecision, reflecting a market caught between breakout attempts and consolidation tendencies. The Uniswap token is currently trading at $7.050.
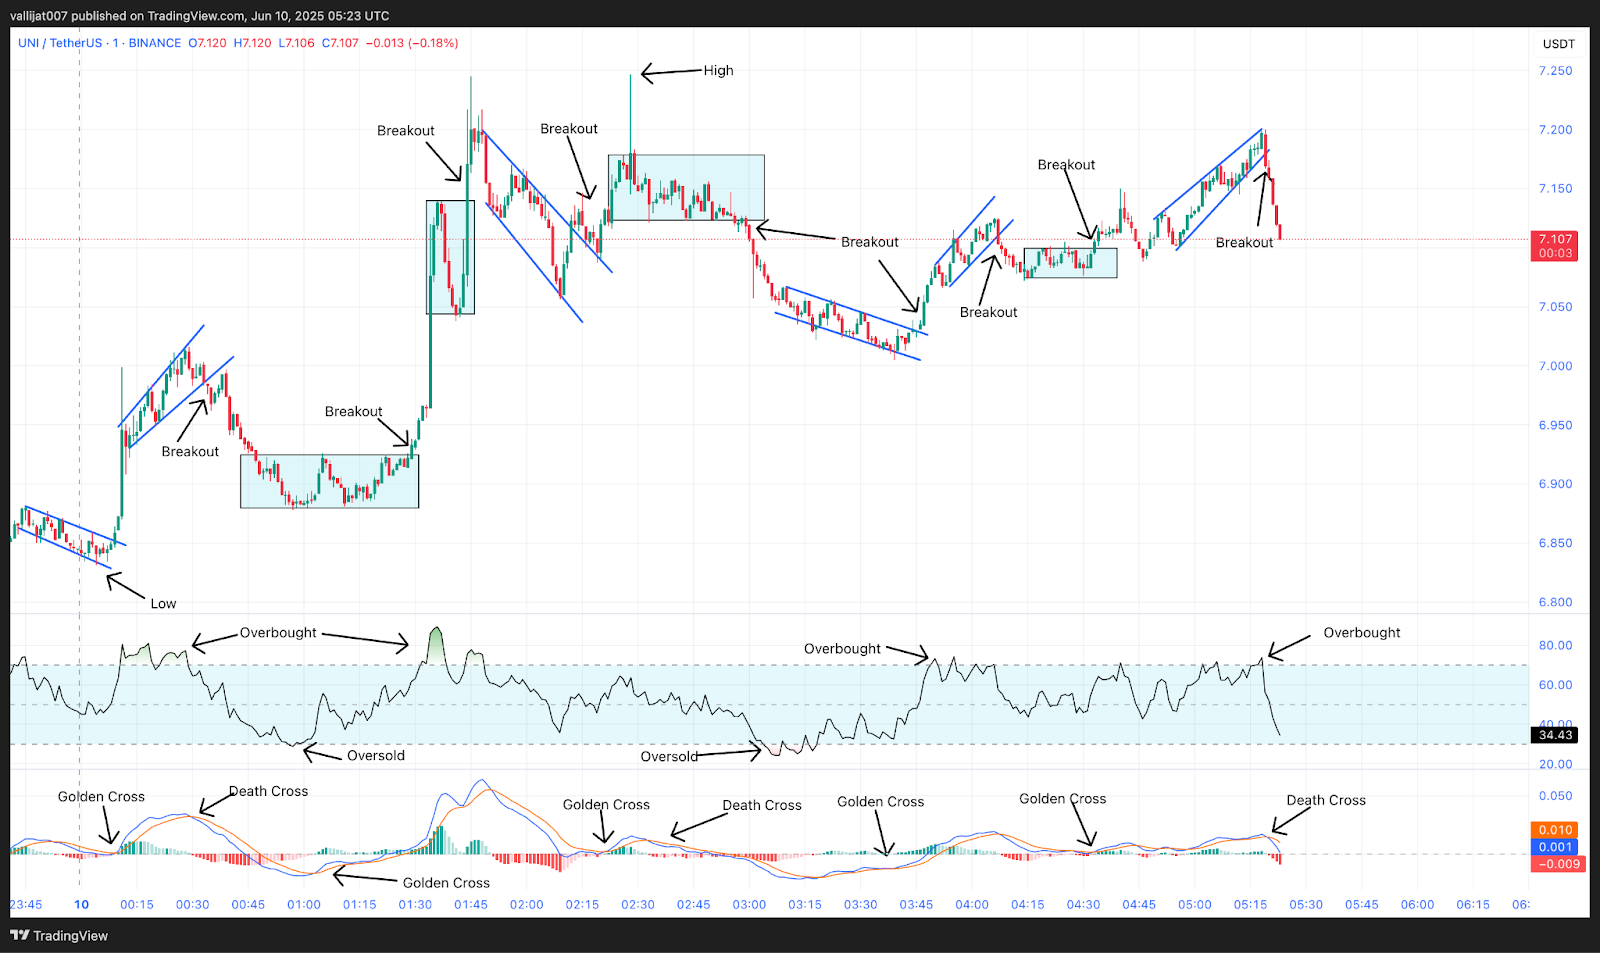
Chart 5: UNI/USDT M1 Chart, Analysed by vallijat007, published on TradingView, June 10, 2025
Uniswap price formed a downward-moving channel, which marked the low for the day at $6.831. The downward-moving channel broke out to the upside at 00:09 UTC, supported by a golden crossover of MACD. Price moved back to the upside and formed a channel. At 00:15 UTC, RSI moved above the level of 70, indicating overbought market conditions. The upward-moving channel broke out to the downside at 00:34 UTC, supported by a death crossover of MACD. Price moved back to the downside and formed a range. At 00:57 UTC, RSI dropped below the level of 30, indicating oversold market conditions.
Failed Breakouts Dominate UNI Price Action Near $7.25 Resistance
Supported by MACD’s golden crossover, the range broke to the upside at 01:29 UTC. Price rebounded upward and created a range. RSI surpassed the 70 level at 01:35 UTC, pointing toward oversold market circumstances. At 01:44 UTC, the range broke out to the upside, supported by a golden MACD crossover, but the upper breakout failed, and price created a descending channel. With MACD’s golden crossover, the downward-moving channel breakout to the upside at 02:20 UTC, the price moved upward, establishing the high for the day at $7.247 and creating a range.
The range broke out to the downside at 03:00 UTC, supported by a death crossover of the MACD. Price moved to the downside and formed a downward-moving channel. At 03:05 UTC, RSI dropped below the level of 30, indicating oversold market conditions, suggesting a reversal or at least a pullback. The downward-moving channel broke out to the upside at 03:45 UTC, supported by a golden crossover of MACD. The UNI price moved to the upside and formed an upward-moving channel. At 03:50 UTC, RSI moved above the level of 70, indicating overbought market conditions.
The upward-moving channel broke out to the downside at 04:07 UTC, supported by a death crossover of MACD. Price moved to the downside and formed a range. The range broke out to the upside at 04:33 UTC, supported by a golden crossover of MACD. Uniswap price moved back to the upside and formed an upward-moving converging triangle pattern. At 05:15 UTC, RSI moved above the level of 70, indicating overbought market conditions. The converging triangle pattern broke out to the downside at 05:19 UTC, supported by a death crossover of MACD.
UNI Swings Between $6.831 Low and $7.247 High
Uniswap’s trading behavior highlighted high volatility and a lack of trend conviction. Although it reached $7.247, sustained upside was challenged by repeated RSI overbought signals and weak follow-through. Similarly, downside dips were capped by RSI oversold conditions, with price bouncing off the $6.831 low. Multiple golden and death crossovers from the MACD illustrated constant shifts in short-term sentiment. With no clear breakout holding, UNI remains range-bound. Traders should not follow strong spikes or sudden price changes until they are confirmed. If trading above $7.25 takes place, it could lead to a continued rise, but a fall under $6.80 could make bears stronger.


