
XRP also remains one of the most popular coins in the cryptocurrency market as a bridging currency towards quick cross-border payments. This Technical analysis will determine major support and resistance for the XRP price, which will determine the price’s next big move. By considering trend patterns and momentum indicators as well as trading volume, we determine whether a bullish continuation or a bearish reversal is more probable. The traders will become equipped with pragmatic information about the possible entry and exit points that are supported by the chart patterns and key price areas. Regardless of whether you prefer a swing trade or a long-term position, the below technical dynamics will be necessary to understand the volatility of the XRP price.
XRP Price Analysis of August 21, 2025
On August 21, 2025, XRP opened with support near $2.9100, where the XRP price rebounded at midnight IST and quickly spiked to the upside, marking the high of the day at $2.9896. After hitting resistance, the price consolidated in a range that broke down at 05:20 AM IST, supported by a death crossover of MACD. XRP dropped into an expanding triangle, which failed to resolve and transitioned into another range. A second breakdown followed at 11:30 AM IST, again backed by a death crossover of MACD, with price sliding into a downward channel and marking the day’s low at $2.8858.
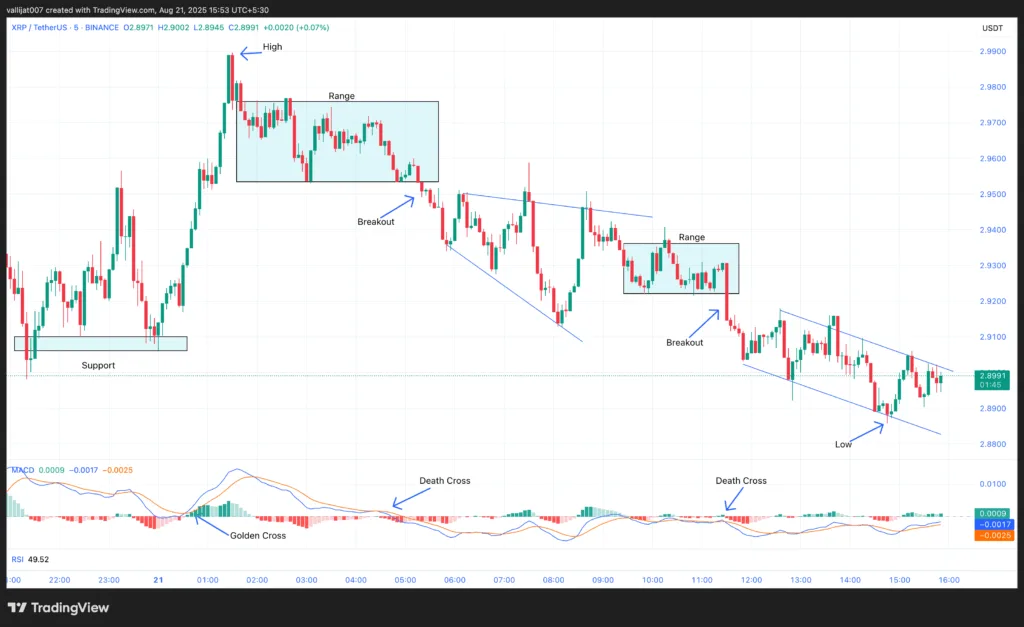
Chart 1: XRP/USDT M5 Chart, Analysed by vallijat007, published on TradingView, August 21, 2025
- The XRP price formed a support area at $2.9100. Price took support at midnight IST and spiked to the upside, marking the high for the day at $2.9896.
- After marking the high, the XRP price formed a range. The range broke out to the downside at 05:20 AM IST, supported by a death crossover of MACD. XRP spiked to the downside and formed an expanding triangle. The triangle failed to break out on either side and developed into a range.
- The range broke out to the downside at 11:30 AM IST, supported by a death crossover of MACD. Price spiked to the downside and formed a downward-moving channel, which marked the low for the day at $2.8858.
- If the channel breaks to the upside, XRP may rise to $3.000. If the channel breaks to the downside, XRP may drop to $2.800.
XRP Struggles Between ETF Delay, Whale Sells, and Adoption
XRP is currently at a crossroads as investors weigh positive structural developments against bearish short-term pressures. The U.S. Securities and Exchange Commission has postponed rulings on various spot XRP ETF applications from Bitwise, Grayscale, and 21Shares. The final decision now shifts to mid-October, marking a defining moment for the token’s regulatory clarity. While delays are seen as standard, approval could validate XRP’s compliance and spark institutional inflows.
At the current dollar, XRP whales recently sold off over a billion dollars’ worth of tokens, a move that saw dollars slipping below three dollars. The sell-offs coincided with key technical breakdowns, indicating weakening momentum. Analysts identify the next support zone in the mid-two-dollar range, although oversold indicators suggest potential for short-term stabilization.
Amid these market jitters, institutional adoption continues to expand. Nasdaq-listed VivoPower has partnered with Crypto.com to custody one hundred million dollars in XRP as part of its treasury strategy. This step highlights growing corporate confidence in XRP’s role as a reserve asset.
In support of the long-term bullish narrative, the U.S. Securities and Exchange Commission (“SEC”) has formally dismissed its lawsuit against Ripple after five years and, as a result, has fundamentally removed a long-lasting regulatory overhang. Ripple is now free to pursue new partnerships in the financial infrastructure space without having to carry the stress of a lawsuit on its back.
XRP Balances Risk and Opportunity:
XRP remains caught between short-term headwinds and long-term growth potential. The SEC’s ETF ruling delay has dampened sentiment, while billion-dollar whale sell-offs added downside pressure. Technically, XRP must defend support in the mid-$2.80s to avoid a deeper retracement toward $2.80. On the flip side, institutional adoption continues to expand, with VivoPower’s $100 million custody deal and the SEC officially dropping its Ripple lawsuit. These moves strengthen the token’s structural case. A breakout above $3.000 could re-energize bullish momentum, while failure to hold current levels may invite more selling. XRP’s next move hinges on ETF clarity and whale behavior.
XRP Price Analysis of July 14, 2025
XRP price opened the session with volatility, forming an expanding triangle pattern that marked the day’s low at $2.7637. The pattern broke out to the upside at 04:45 IST, supported by a golden MACD crossover, initiating a steady climb. Resistance formed at $2.8400, which was broken at 06:30 IST, leading to successive upside breakouts through ranges and channels. RSI readings crossed above 70 multiple times, flagging overbought conditions as the price reached the high of $3.0067. The overall structure reflects sustained bullish pressure, driven by technical momentum and further supported by expanding institutional and regulatory interest in the broader XRP ecosystem.
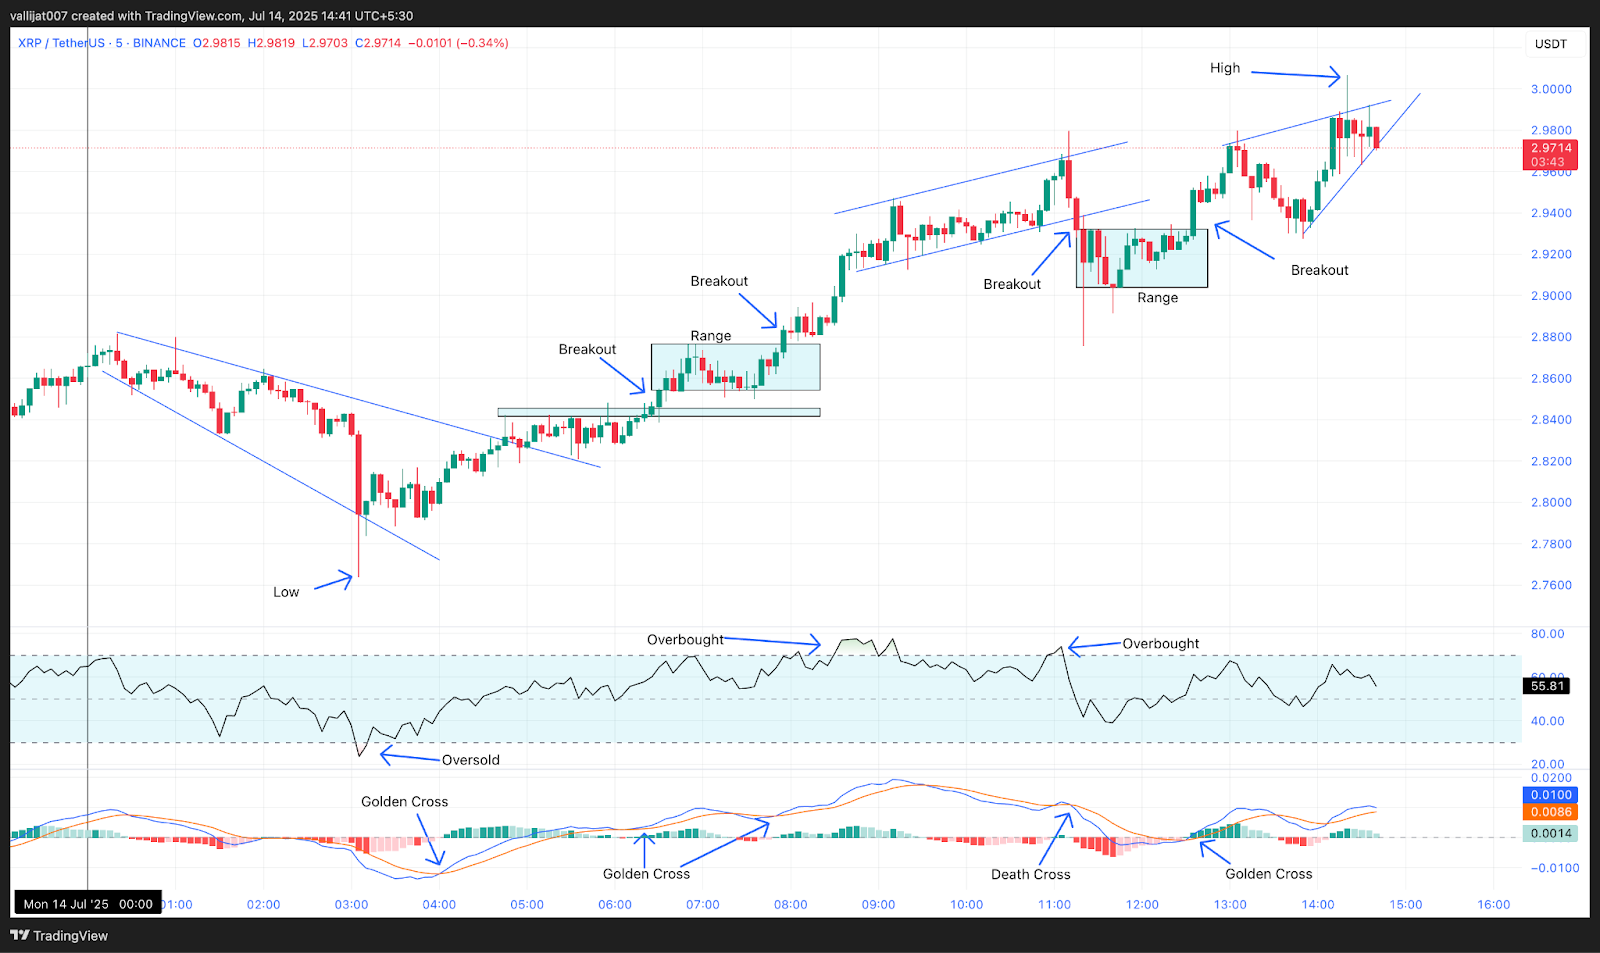
Chart 1: XRP/USDT M5 Chart, Analysed by vallijat007, published on TradingView, July 14, 2025
The XRP price formed an expanding triangle pattern, which marked the low for the day at $2.7637. The expanding triangle pattern broke out to the upside at 04:45 IST, supported by a golden crossover of the MACD. Price formed a resistance area after the breakout at the level of $2.8400. The XRP price broke the resistance area to the upside at 06:30 IST, supported by a golden crossover of the MACD. Price spiked to the upside, and a range developed. The range broke out to the upside at 07:55 IST, supported by a golden crossover of MACD. Price spiked to the upside and formed an upward-moving channel.
At 08:40 IST, RSI was above the level of 70, indicating overbought market conditions, suggesting a reversal or at least a pullback. The upward-moving channel broke out to the downside at 11:15 IST, supported by a death crossover of MACD. Price spiked to the downside, and a range developed. The range broke out to the upside at 12:35 IST, supported by a golden crossover of MACD. Price spiked to the upside and formed a converging triangle pattern, which marked the high for the day at $3.0067.
Ripple’s XRP Gains Momentum with Regulatory Clarity and Institutional Adoption
Any licensing of Ripple by the U.S. as a bank may give XRP a leading role in cross-border transactions. Significantly due to its compatibility with the ISO 20022 specification. The action would increase the usability and economic presence of XRP. Making it the most popular currency around the world. Also, since Ripple settled with the SEC, the regulatory status of XRP has become stronger, which increases investors’ confidence and readiness to use it on an institutional level.
The ruling eliminates the uncertainty that still existed. Giving it some stability that might encourage additional financial services institutions to consider using the XRP payment technology. Due to its speed and low cost of payment. Another major step in the XRP sector is that ProShares has launched the world’s first XRP Futures ETF. This provides regulated exposure to XRP as futures that have been approved by the SEC. The landmark reflects the increased institutional interest in and regulatory acknowledgment of XRP.
In the meantime, the double-leverage XRP ETF offered by Teucrium is providing additional liquidity and trading volume. As the weekly numbers are notably large. The price of XRP gained 6.44 percent over the previous 24-hour period to stand at $2.9, whereas the trading volume increased by 31.22 percent to mark a valuation of 9.73 billion dollars, which is an indicator of the imminence of a bullish trend. As the regulatory barriers continue to be overcome, the range of institutionalized products widens, and XRP can be more widely used, finding its niche in the novel digital assets market.
XRP Poised for Broader Upside as Institutional Tailwinds Strengthen
XRP price technical setup is aligning with a surge in institutional backing and regulatory clarity. The recent breakout to $3.0067 follows bullish signals supported by rising volume and repeated MACD confirmations. Ripple’s potential licensing as a U.S. bank and its ISO 20022 compliance position XRP for leadership in cross-border finance. The launch of the ProShares XRP Futures ETF and Teucrium’s double-leverage product reflects growing institutional demand. With a 6.44% daily price gain and $9.73 billion in volume, XRP appears ready to push higher. If momentum holds, XRP may target $3.20 next. Investors should monitor RSI levels and breakout validation closely.


