

If you want to invest in or buy the Zcash token and wonder what the right price to start accumulating Zcash is, then you are in the right place. As we go through the analysis, we will determine different patterns and how Zcash reacts to them. We will also see support and resistance, which is a good area for any instrument to buy or sell. Without any further delay, let’s dive into Zcash price analysis and explore different opportunities arising from it.
Zcash Price Analysis of May 10, 2025
The Zcash token began the trading day by establishing a support zone near the day’s low, reflecting buyer interest at lower levels. After stabilizing, the ZEC price formed a tight range that broke to the upside, supported by a golden crossover of the MACD. This breakout triggered upward momentum and signaled renewed buying interest. However, as price action advanced, volatility increased. An expanding triangle pattern appeared, hinting at a tug-of-war between bulls and bears. Although RSI crossed into overbought territory, buyers maintained control through the session, keeping the overall trend intact and setting up Zcash for further potential gains.
The Zcash price marked the low for the day at $40.99, forming a solid support area at the $41.00 level. Following the establishment of support, a range developed in the price action. This range broke out to the upside at 10:35 UTC, supported by a golden crossover of the MACD. The breakout triggered a sharp upward spike, signaling renewed buying interest and bullish momentum.

Chart 1: ZEC/USDT M5 Chart, Analysed by vallijat007, published on TradingView, May 10, 2025
After the breakout, Zcash formed a downward-moving expanding triangle, a structure that often reflects increased volatility and a battle between bulls and bears. Interestingly, prior to the breakout, at 07:45 UTC, RSI had already moved above the 70 level, indicating overbought market conditions and suggesting the likelihood of a pullback or temporary reversal. Despite this signal, buyers maintained control.
ZEC’s Next Move: Breakdown to 41 or Rally to 45?
Finally, the expanding triangle burst out to the upside at 22:10 UTC once more, backed up with a golden crossover of the MACD. This breakout produced the next bullish surge, and the ZEC price increased to top the day’s high at $43.89. At 00:25 UTC on 10 May 2025, RSI again crossed above level 70, which again amounted to the condition of increasing overboughtness. As is usual, a pullback followed soon after, and the price opened lower at $42.35, where it set up a fresh short-term support area.
Today, the $42.35 level is playing the role of a key decision point. If this support area collapses to the downside, it might be possible for the Zcash price to revisit the $41.00 level, which had previously been a strong support and was also the session’s low. In contrast, if the $42.35 level maintains its integrity and buyers return with momentum, Zcash is likely to continue its up move and advance to the $45.00 level.
The combination of repeated overbought RSI readings and multiple MACD golden crossovers shows both bullish strength and potential exhaustion. Traders should monitor momentum indicators and volume closely. A confirmed breakout or breakdown from the $42.35 area will likely set the tone for Zcash’s next directional move. Until then, the market may remain reactive and range-bound within these key levels.
ZEC Price Tests Make-or-Break Support: 42.35 Hold or 41 Collapse?
The Zcash price now trades near a key short-term support level. If the $42.35 zone holds, the price could resume its climb toward the $45.00 resistance area. A bullish breakout from this level would reinforce trend continuation. However, if the support breaks, Zcash may revisit the $41.00 range. Multiple MACD golden crossovers and RSI overbought signals show momentum but also warn of exhaustion. For now, Zcash remains in a reactionary phase. Traders should wait for a confirmed move beyond the current support or resistance before initiating new positions. Directional clarity is likely once the market chooses a breakout path.
Zcash (ZEC) Price Analysis of May 15, 2025
Zcash coin has been navigating a volatile trading session, with price action dominated by sharp breakouts and rapid reversals. The day began with a downside breakout from an expanding triangle, leading to a series of lower highs and lower lows. Minor upward structures repeatedly failed to hold, with each breakdown supported by MACD death crossovers and confirmed by oversold RSI readings. After hitting the day’s low, a temporary recovery led to an upside breakout and the formation of a converging triangle, which again broke to the downside. With RSI swinging between extremes, the market is signaling both exhaustion and the potential for consolidation or a sharp move.

Chart 2: ZEC/USDT M5 Chart, Analysed by vallijat007, published on TradingView, May 15, 2025
An expanding triangle pattern appeared in the Zcash price, which marked the high for the day at $43.81. The expanding triangle pattern broke out to the downside at 07:15 UTC, supported by a death crossover of MACD. Price spiked to the downside and formed a minor upward-moving trendline. The minor trendline broke out again to the downside at 08:50 UTC, supported by a crossover of MACD. Price spiked to the downside and formed an upward-moving channel.
Oversold RSI Bounce Fails: Bears Maintain Control at $40.48 Low
At 09:00 UTC, RSI dropped below the level of 30, indicating oversold market conditions, suggesting a reversal or at least a pullback. The upward-moving channel broke out to the downside at 12:35 UTC, supported by a death crossover of MACD. ZEC price spiked to the downside and formed a downward-moving channel, which marked the low for the day at $40.48. In the meantime, RSI again dropped below the level of 30, indicating overall market conditions suggesting a reversal or at least a pullback.
The downward-moving channel broke out to the upside at 18:40 UTC, supported by a golden crossover of MACD. The ZEC price spiked to the upside and formed a converging triangle pattern. In the meantime, at 19:50 UTC, RSI moved above the level of 70, indicating overbought market conditions, suggesting a reversal or at least a pullback. The converging triangle pattern broke out to the downside at 01:10 UTC, supported by a death crossover of MACD. In the meantime, at 01:50 UTC on 15th May 2025, RSI again dropped below the level of 30, indicating market conditions suggesting a reversal or at least a pullback.
If the downside breakout succeeds, then the Zcash price might drop to the level of $40. If the breakout fails, then the price may rise to the level of $45. The Zcash price showed trend behaviour where most of the breakouts hit their target price. Traders and investors should be cautious before placing an upward breakout trade, as the price shows bearish momentum. There are also chances that the price may consolidate, because after a strong trend, a consolidation phase usually follows.
Zcash Coin at a Tipping Point, Break or Bounce?
Zcash price is at a critical juncture, with the latest downside breakout threatening a drop toward a key psychological support level. So far, most breakouts, both bullish and bearish, have reached their targets, reinforcing the current trend-driven behavior. However, persistent oversold RSI readings and repeated MACD crossovers suggest the trend may be overextended. While the broader structure leans bearish, a failed breakdown here could lead to a swift reversal toward higher levels. Traders should be cautious with upward breakout setups and look for clear confirmation before entry. With momentum weakening, the possibility of a consolidation phase is rising, making timing and risk control essential.
Zcash (ZEC) Price Analysis of May 20, 2025
Zcash price action during the session reflected a clear trading range environment, marked by multiple failed breakouts and constant reversals. After establishing the day’s high, the price trended lower through a series of downward channels. Despite several upside breakouts confirmed by golden MACD crossovers, none developed into a sustained uptrend. Instead, each recovery attempt stalled, especially near the Zcash resistance level at $41.15. The price has remained trapped between defined support and resistance zones, with oversold RSI levels occasionally triggering brief rebounds but without strong continuation. This structure underscores market indecision and weak momentum on both sides.
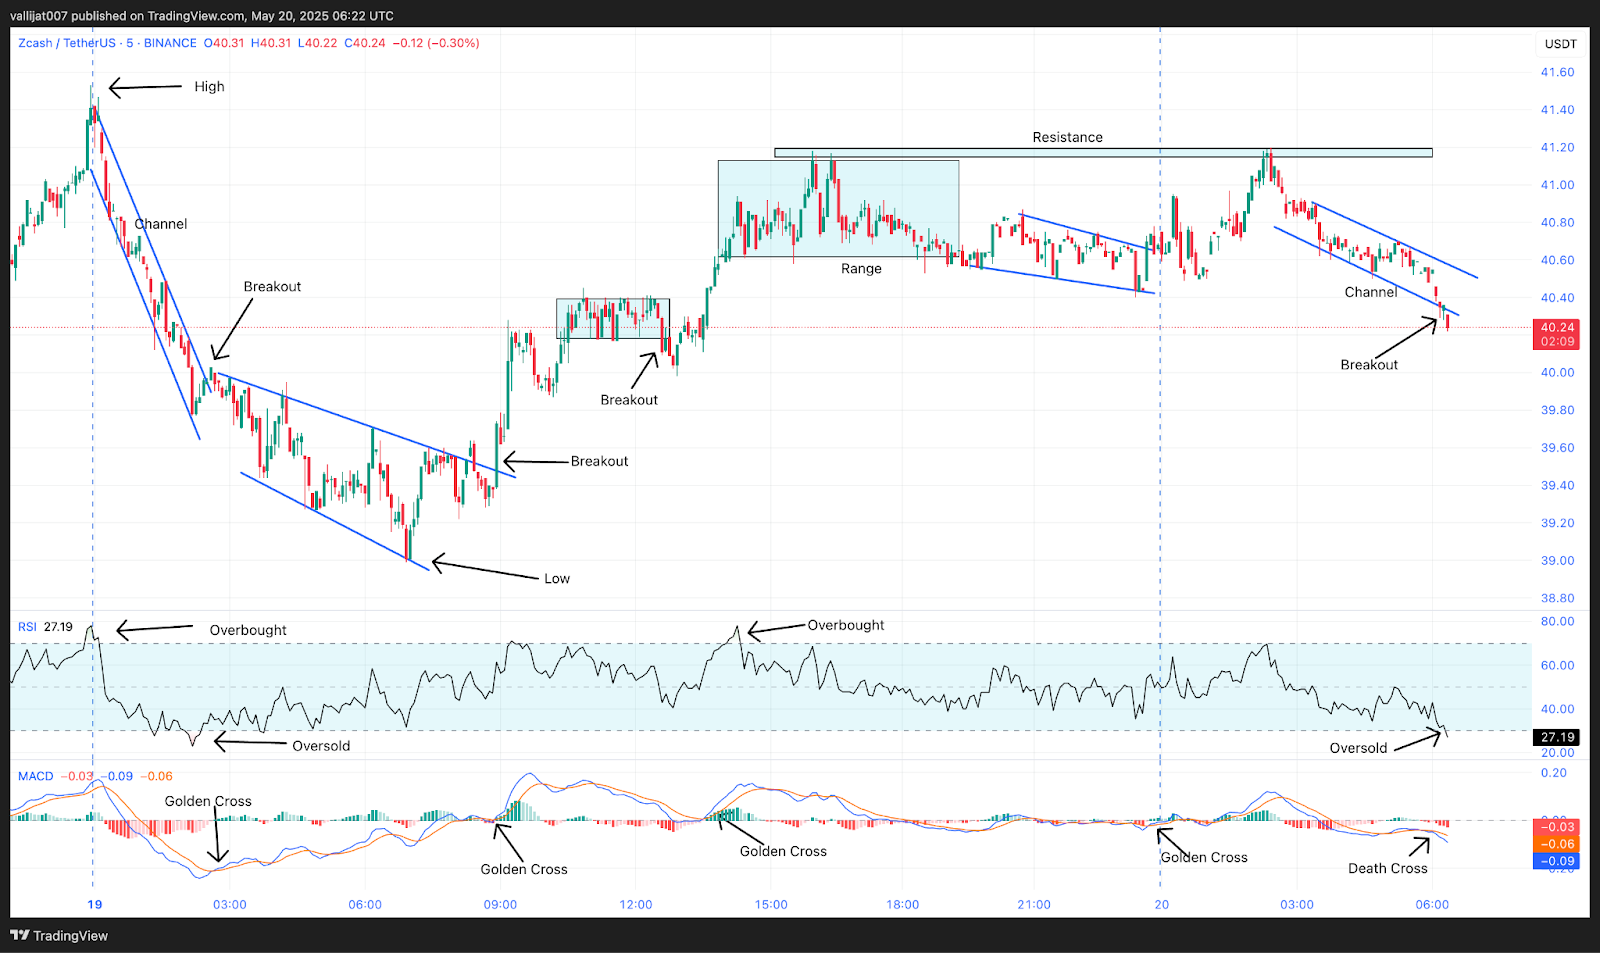
Chart 3: ZEC/USDT M5 Chart, Analysed by vallijat007, published on TradingView, May 20, 2025
After marking the high for the day at $41.53, Zcash formed a downward-moving channel. The downward-moving channel broke out to the upside at 02:35 UTC, supported by a golden crossover of MACD, but ZEC price failed to form an uptrend, and a downward-moving channel appeared in the price, which marked the low for the day at $38.99. The downward-moving channel broke out to the upside at 08:55 UTC, supported by a golden crossover of MACD.
Failed Breakdowns Highlight Strong Support at $40.60
The Zcash price spiked to the upside and formed a range. The range broke out to the downside at 12:35 UTC, supported by a death crossover of MACD, but the downside breakout soon failed, and the price reversed to the upside. Another range appeared in the price with a resistance level at $41.15 and a support level at $40.60. The range failed to break out to either side, and a downward-moving channel appeared in the ZEC price, which broke out to the upside at 23:40 UTC, supported by a golden crossover of MACD.
But the Zcash price failed to break the resistance level of $41.15, and a downward-moving channel appeared in the price again. The downward-moving channel broke to the downside at 06:10 UTC on 20th May 2025, supported by a death crossover of MACD. In the meantime, at 06:20 UTC, RSI dropped below 30, indicating an oversold market condition, suggesting a reversal or at least a pullback.
If the breakout succeeds, then the Zcash price may drop to the level of $39.00, and if the breakout fails, then the price may again rise to the level of $41.15 in an attempt to break the resistance level. If the price is able to break its resistance level, then it may rise to the level of $42.00. Zcash shows a trading range behavior with most of the breakouts failing to have follow-through and reversing to the other side.
Zcash Stuck in Choppy Range, Direction Awaits Breakout
The Zcash price continues to exhibit range-bound behavior, with most breakouts lacking the strength to follow through and often reversing direction. The price is currently testing lower levels following another channel breakdown, supported by a MACD death crossover. However, oversold RSI conditions suggest a possible pullback or reversal in the short term. Traders should monitor the $39.00 support and $41.15 Zcash resistance closely. A successful breakout above resistance could target $42.00, while a confirmed move below support would reinforce the bearish structure. Until momentum builds in either direction, Zcash is likely to remain locked in consolidation, favoring short-term range strategies over directional trades.
Zcash (ZEC) Price Analysis of June 17, 2025
Zcash opened with low volatility, initially trading in a tight range. The first significant movement occurred at 01:50 UTC when the price spiked on a golden MACD crossover, leading to a Zcash breakout and subsequent formation of a downward trendline. Continued upside attempts brought Zcash to its high of the day at $46.63 by 09:35 UTC, where overbought RSI conditions hinted at a potential pullback. From there, momentum waned as breakout attempts failed and price gradually declined through a series of ranges and triangle patterns. Zcash price is currently trading at $43.00.
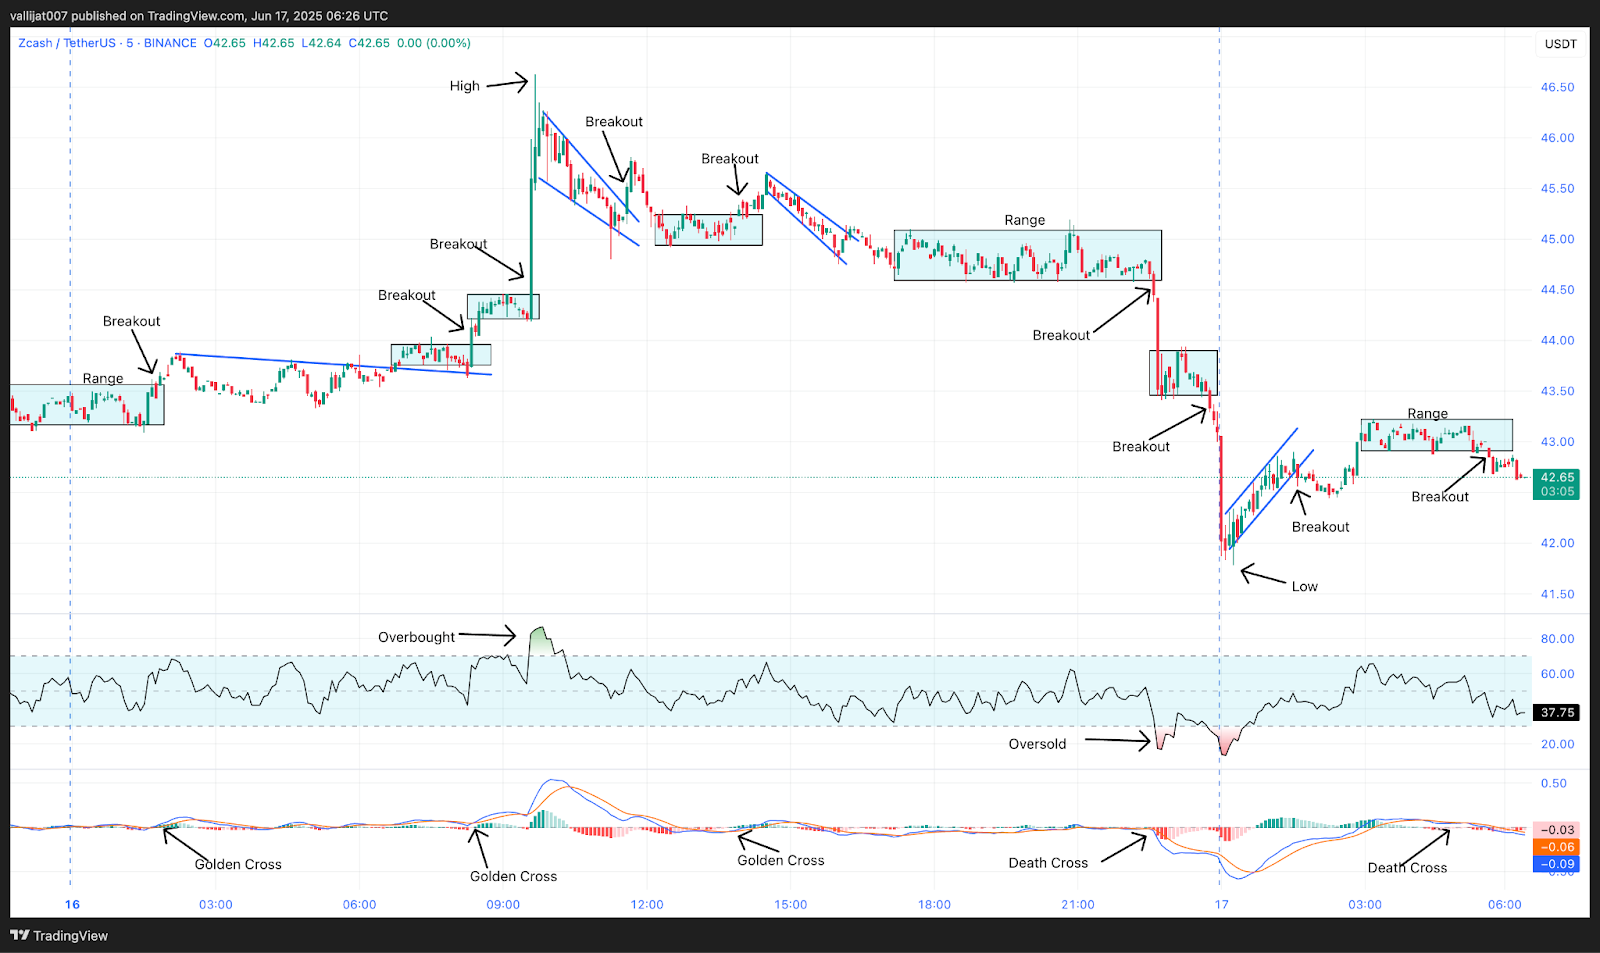
Chart 4: ZEC/USDT M5 Chart, Analysed by vallijat007, published on TradingView, June 17, 2025
Zcash price formed a range, which broke out to the upside at 01:50 UTC, supported by a golden crossover of MACD. Price spiked to the upside and formed a downward-moving trendline. The downward-moving trendline broke out to the upside at 06:45 UTC, supported by a golden crossover of MACD, but the momentum was weak, and the ZEC price formed a range. The range broke out to the upside at 08:20 UTC, supported by a golden crossover of MACD, and another range developed. The range again broke out to the upside at 09:35 UTC, supported by a golden crossover of MACD, marking the high for the day at $46.63.
Expanding Triangle Transition Fails to Resolve Directionally
At 09:40 UTC, RSI moved above the level of 70, indicating overbought market conditions, suggesting a reversal or at least a pullback. After marking the high, the price formed a downward-moving converging triangle pattern. The converging triangle pattern broke out to the upside at 11:35 UTC, supported by a golden crossover of MACD, but the upside breakout failed, and the price dropped to the downside, forming a range. The range broke out to the upside at 14:00 UTC, supported by a golden crossover of MACD.
But again, the breakout failed and the Zcash price dropped to the downside, forming a downward-moving expanding triangle pattern. The expanding triangle pattern failed to break out to either side, and a range developed. The range broke out to the downside at 22:35 UTC, supported by a death crossover of MACD, and formed another range. At 22:45 UTC, RSI dropped below the level of 30, indicating oversold market conditions, suggesting a reversal or at least a pullback.
Range Breakdown at 23:45 UTC Establishes Daily Low of $41.78
The range broke out to the downside at 23:45 UTC, supported by a death crossover of MACD, marking the low for the day at $41.78. After marking the low, the price formed an upward-moving channel. The upward-moving channel broke out to the downside at 01:35 UTC on 17th June 2025, but the downside Zcash breakout failed, and the price rose to the upside, developing a range. The range broke out to the downside at 05:40 UTC, supported by a death crossover of MACD. If the breakout succeeds, the price may drop to the level of $40.00. If the breakout fails, the price may rise to the level of $45.00.
$41.78 Low Signals Bearish Shift Despite Early High at $46.63
The Zcash price action showed early strength but closed on a weaker note after repeated failed breakouts. Despite reaching a high of $46.63 during the morning rally, multiple golden MACD crossovers could not sustain bullish momentum. A decisive breakdown at 23:45 UTC marked the session’s low at $41.78, further confirmed by RSI oversold readings. Subsequent price action attempted recovery via an upward channel, but bearish pressure persisted. If the ongoing breakdown holds, ZEC price could fall toward $40.00. A failed breakdown, however, may trigger a bounce back toward the $45.00 resistance level.


